
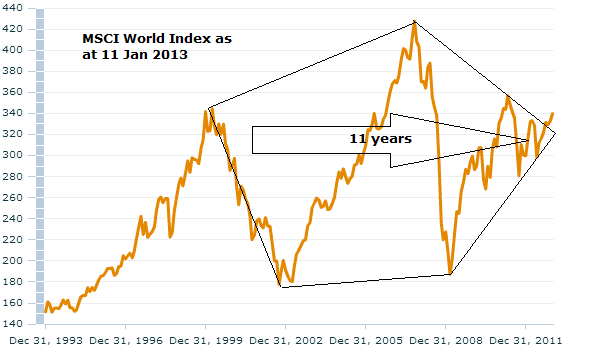
We got the advance that I was looking for into today’s new moon, taking us a little more overbought and overbullish, plus Tom DeMark also fairly well aligned: his call yesterday was to exit Europe longs and that the SP500 should top by 1492 possibly as early as today – for a subsequent 5% decline. My forecast based on solar/secular history for world equities looked like this in Sept 2012, namely a breakout from the secular bear pentagon into 2013 and a final but mild and short-lived cyclical bear 2013-14 before secular bull momentum erupts:
 The MSCI World today looks like this:

Source: MSCI
A breakout indeed, and drawing together the models of the previous post, I predict a higher high (and cyclical bull topping high) by around June 2013, but on negative divergences, before a cyclical bear in H2 2013 into early 2014 takes us back to the pentagon angle level roughly. All subject to developments of course.
So I took 40% stock indices longs profits today, but I retain all the different country stock indices that I listed to some degree. I don’t believe this is the cyclical top, but that stocks should in due course pull back, advance again to a new marginal high on weaker internals and that the whole H1 2013 will be a topping process in hindsight. Therefore if stocks do make the anticipated pullback I may add again for a final push up. If stocks continue upwards some way further I shall ride the remaining positions. But the main focus is now to see if commodities can start to outperform equities, as my weighting is now much more skewed towards them, playing for a secular finale of parabolic fashion, expecting that outperformance versus equities as of now, born out of current excessive pessimism in various softs and precious metals.
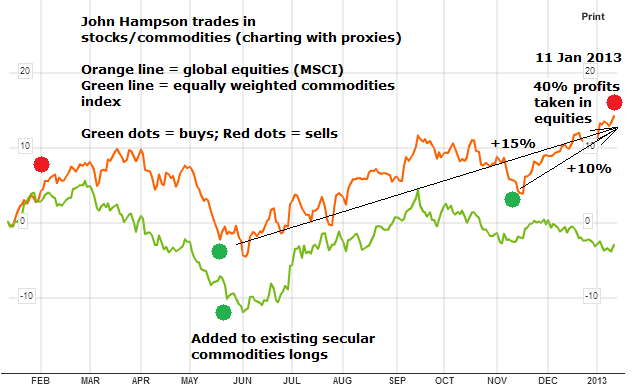 Underlying source: Bloomberg
Have a great weekend all. I now in the Kota Kinabalu region of Borneo for a few days.

Thank you John
I am going to do the same
Sell 40% of equities
regards
bob
Cheers Bob
I found your website just a few days ago. I must say, you are doing a great job !
Although, I have a few questions.
Your call a high on the 11th seems to be a nice call. However, in this post you are talking about a minor pull-back before a rally could take the indices towards slightly higher highs. Any idea about the size of this pull-back ?
Furthermore, you are talking about a topping process in H1. That’s a different stance you mentioned in your post ‘Tools for 2013’, were you mentioned this March/April low ?
Many thanks and keep up the good work !
Hi Ivan, and thanks. A cyclical bull topping process historically takes place over several months and is a fairly large range but overall sideways. Take a look here:

I am imagining we are at the start of such a process and that this will last the first half of 2013, with a dip down into March time, and that important second high and negative divergences mid-year.
John, two questions, again:
1st. I´m sorry, but the time-frame of the Dow Jones nowdays is (for me) 1974-78, so I expect this year or in 2014 a retracement about 0,618 of the bull market from 2009 to nowdays. We are in a 17 years Cycle from 2000, not in 40´s.
2nd. To response the question in the prior page: Last year, there was a significant divergence in the Cumulative Trend Geo Plus Lunar, it pointed out a great drop, dis you realized?
No stroms for jan13?
Thanks
Hi Antonio,
1st. I can’t help you with that. You have persisted over the last year with the different time analogies. I have produced my case with detailed evidence, and the markets have supported my case. I don’t agree with the mirror being 1974-1978 nor a 17 year cycle.
2nd. Yes, stocks pulled away, commodities obeyed. I am very interested to see what happens this year – whether the gap in stocks and model closes. The forecast for the next 3 weeks is shown in the models – no significant storms are forecast.
Ok, John, no need to agree each other. If I persist, is because I studied this structure for the Industrials from long time ago, and is a model, historical structure for the Dow Jones for centuries (. The 17 years- cycle for this roof market, the 3rd since 1932, but the first, from 1932-1950, is different to the 2nd and the 3rd.
The same from 1835, 1st, the same to 1932-50, the second ( 1869-1886) and the 3rd 1906-23.
And from 1720, the prospection is not the same but very similar. Cycles, only cycles, John.
I don´t want to disturb you, but look out with your model, John, this is long time run on markets and I m a runner from long distances and my structure for the DOW support my professional dedication on markets much before 2000.
In a twinkling of an eye, things can change.
Remember facts in summer11.
Yes. I expected a drop in 2012, the FED is lagging this cycle, but things I trust will set in its place in 2013? or in 2014?
Hi Antonio,
I am with you on the 17 year cycle. Have a look at this, it’s out on 25th Feb 2013:
http://www.amazon.com/17-6-Year-Stock-Market-Cycle/dp/0857192736
I think we are in a similar timeframe to 1942 & 1978.
Regards,
Kerry
Congrats on getting it out Kerry, a great effort, even though as you know I disagree that such a cycle exists. Question: you see our current stocks bear lasting until 2018, do you also see the commodities secular bull lasting until 2018?
Hi John,
Thanks John. I see the commodities bull coming to an end before 2018. I have been looking at gold as a proxy for commodities and I anticipate the gold bull coming to an end in 2015 (as per 1980), thus setting the scene for a prolonged secular stock bull market on the back of falling commodity prices (1982 to 2000 = 2018 to 2035).
I know you don’t believe in a 17.6 year cycle but I think you’d find the cycle very interesting as it is comprised of smaller sub-cycles which may fit in with your work.
When the cover is finished this will illustrate what I mean as I have identified intermediate turning points within the 17.6 year cycle such as 1987 and 2007.
Regards,
Kerry
Interesting article on the 17.6 year cycle which states that the cycle is an average rather than a regularly repeating cycle. However, I woud be interested in reading the book.
http://www.tradersnarrative.com/the-18-year-stock-market-commodity-cycle-2760.html
Kerry, 25th feb13? What you mean?
Antonio – 23rd February is the date that the book is released, not a projected top or bottom 🙂
Thanks Jack, I think it’s a good book and cycle enthusiasts should enjoy it.
Regards,
Kerry
John, you probably have it timed perfectly as the Chinese are taking profit under the cover of the “high” headline inflation news.
This leg up has been very nice and the market is getting a bit too frothy for me. I took profit a day before you did. I also placed a tiny short position on the EEM with a wait and see attitude.
You da’ best.
Thanks Edwin
John,
Thank you for your regular updates. Amazing that you can do this while on an extended trip, away from your office. You have a pretty good laptop (but still a small screen compared to your home setup, I would guess) and are able to get reliable internet connections along the way.
Enjoy your travels! (I’ve enjoyed reading about the places you’ve visited. Bali sounds amazing.)
When do you plan to return to England? Or maybe you just stay in southeast Asia? 🙂
Hi Greg, I am slugging around a heavy powerful laptop on my back – but only inbetween hotels and airports. Internet has been a problem in regions like Thailand and Bali, but overall the style of my trading – medium to long term rather than day trading or short term – means that I can go a few days here and there without. The trip should come to an end late March / early April, so plenty time left to experience. What happens after the trip ends is under discussion, no rush to decide – yet!
That should read “You likely have a pretty good laptop…”
Hi John,
I agree with your scenario, I ran my Demark sequential indicator on several stocks and indices and many have completed a 13 countdown to indicate a top at current levels. The S&P seasonal’s also suggest weakness into late February/March.
Not sure if you read Daniel Ferrera at Sacred Science but his 2013 Outlook published in September calls for a weakening market Jan. through March, an advance into early May, decline into August then a final bull market push by early Nov. His work is primarily Gann but it’s a great analysis based on his Mass Pressure (Dicennial Pattern) Indicator and 45-year cycle among other things.
As for commodities I’m currently stalking Cotton, Sugar and Coffee.
Have fun in Borneo!
Thanks for that Brent
Thanks for the update, John. Curious if you cut your stock longs equally or favored/disfavored certain countries. Also wondering whether you view gold miners as stocks or commodities.
Glad to hear your adventures extend till spring. Look forward to more of your photos as you have quite the camera eye. Many of your shots speak volumes; the packed motorcycle (Indonesia?) still sticks in my brain.
Thanks Marlowe – I will get round to a Thailand post soon.
I cut across my range of countries, keeping all to some degree. I specifically stated stock indices, because my sole sector holding – the gold miners ETF – is in tact. With bearish extreme sentiment I believe it is in a good place to rally.
Hi John,
Interesting agreement between COT and 45 year Cycle for first half of 2013 yet some divergences toward latter part of 2013.
Agreement between the two are as follows: Jan peak, Mar low,
Slight divergence: COT has a June peak; 45 year Cycle has a June peak followed by a slightly larger July peak; in other words two close peaks.
Bigger divergence: COT has October low, but 45 year Cycle has early August low.
Some divergence but same outcome: COT indicates a rise from October low to December 2013 high; 45 year Cycle indicates rise from August low to early December 2013 high with a slight dip along the way in early November.
Jack
Thanks Jack.
John,
Also interesting is that your Lunar Geomagnetic Model for stocks 2013 supports the two peak June & July scenario for the 45 year Cycle but supports the COT October low as opposed to the 45 year Cycle August low.
Jack
Hi John
I join with others in congratulating you on your excellent updates as you travel . Sabah and Mt .Kota Kinabulu provide a beautiful background to ponder the market .
Your expanded thoughts please , on your comment as per your current update :
“A breakout indeed, and drawing together the models of the previous post, I predict a higher high (and cyclical bull topping high) by around June 2013, but on negative divergences, before a cyclical bear in H2 2013 into early 2014 takes us back to the pentagon angle level roughly. All subject to developments of course.”
The MSCI CHART has the pentagon shape current breakout at 300/320 ( or 72o ) …..but with an even more solid “base” at 280 .
Should the 2nd H 2013 pullback occur and overshoot as it usually does ,I imagine at this stage you anticipate the low point would not be below 280 , and still roughly retain the pentagon shape ?and furthermore on a “time basis” , it may even make the pentagon more “even” in eqi -distance (time)between the Sept 1999 peak at 340, the sept 2008 higher peak at 420(ish) and the ultimate 2nd half 2013? .
Hope you and others can see what I am attempting to describe!
Might be stating the bleeding obvious to most readers , but just like to “visualize” where the coming retracement might tale us ….in addition, that will help potentially see where the commodity overshoot in gold /silver /copper might take us .
best regards
Thanks Maplelegion. My general idea, based on history, is of a breakout from the pentagon, then a backtest of the ‘nose’ level of the pentagon, which would be around 320. But an overshoot to lower would be fine, as long as the general idea of a fairly shallow ending bear comes good, i.e. no fireworks to end the secular stocks bear, just a little more overall coiling before a momentum bull run.
Hope you do not mind John: New highs in 2013 and then the game is up per this analog. Posted about this back in November on your site if I am not mistaken:
FACE/OFF: http://positiveexpectedvalyou.blogspot.com/2013/01/face-off.html
Thanks Ryknow
John,
I am quite new to the Forex Trade, about 2 yrs, and i have been watching with great interest your website, i have recently changed my trading plan from currencies to equities SPX, DOW etc, as this takes some getting used to, my general understanding is that if the Dollar goes up the equity goes down ” is this correct”
I have recently noticed that as the dollar goes up the equity goes up, can you explain to me anybody why this happens.
Also what is the advantage of trading Medium to Long term as opposed to short term. thanks Tony
My opinion is the USD and equities can go opposite or the same way, but commodities have a greater tendency to move opposite the dollar (as they are priced in dollars); and regarding the second point, the shorter the trading timescale the more randomness one faces (there are many different types of market participants making all kinds of trades for all different reasons but pull back and one can see the trends). That said, there are many different ways to make money in the markets, and I have no doubt some are successful trading the short term.
Thanks John
Hi John
I accept I might be being a little pedantic,if so then I’m sorry, but in both the examples you use of this diamond shaped coiling of equity markets by the time “the break” took place i.e 1948/9 and 1979 precious metals had already had their ascent.
I know you are not saying that this time is a carbon copy of previous denouements but this seems a bit odd.
Will
Hi John,
I have to agree with Will. Also, I think that development of the solar cycle 24 has been very similar to the solar cycle 16 so far. Continuation of this analogy would shift the actual solar peak (smoothed monthly SSN) to the middle of 2014 with maximum spikes in non-smoothed monthly SSN in the end of 2015. Couldn’t this shift the gold peak to 2015 or even 2016? It would give gold more time for the substantial decrease of DGR etc. and btw it would correspond with Will’s call of the gold peak in 2015 as well. It could also mean that we are now in 1976 (both stocks and gold) rather than 1979 maybe…
Do you know how reliable solar peak predictions of NASA, NOAA etc. are, please?
Best Regards and many thanks for your inspiring work!
Milan
Hi Milan, if the solar peak forecast changes, my projections change with it. As it’s important I am looking at Nasa, Sidc and Sibet and cross referencing. They use different modelling to get what are currently very similar forecasts (circa Sept 2013 give or take a few months), so that gives me confidence. Nasa also state that once the cycle is underway from the solar minimum they have good confidence they can forecast the peak timing, but the fact is, at the last solar peak of 2000 I didn’t even know what a solar cycle was, so I can’t tell you how it worked out last time. However, as per my wider approach, I also am looking at fundamentals, technicals and drawing together different disciplines to try to assess where stocks and commodites are headed, not just relying on the solar forecast.
Not pedantic Will, valid. Commodities are overdue beginning their acceleration. I could suggest China weakness and the ebb in sunspots as reasons, if now commodities go on to accelerate imminently. But until they truly take off, it’s just theory.
Take a look at my blog
amazingcycles.wordpress.com