

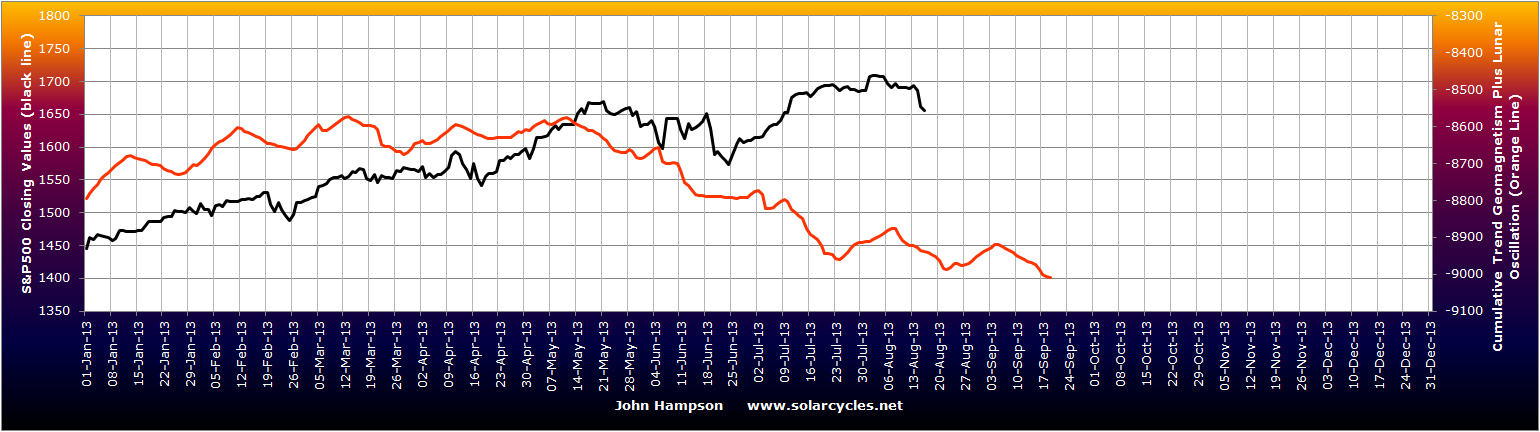
1. Geomagnetism – downtrend out to mid-Sept:
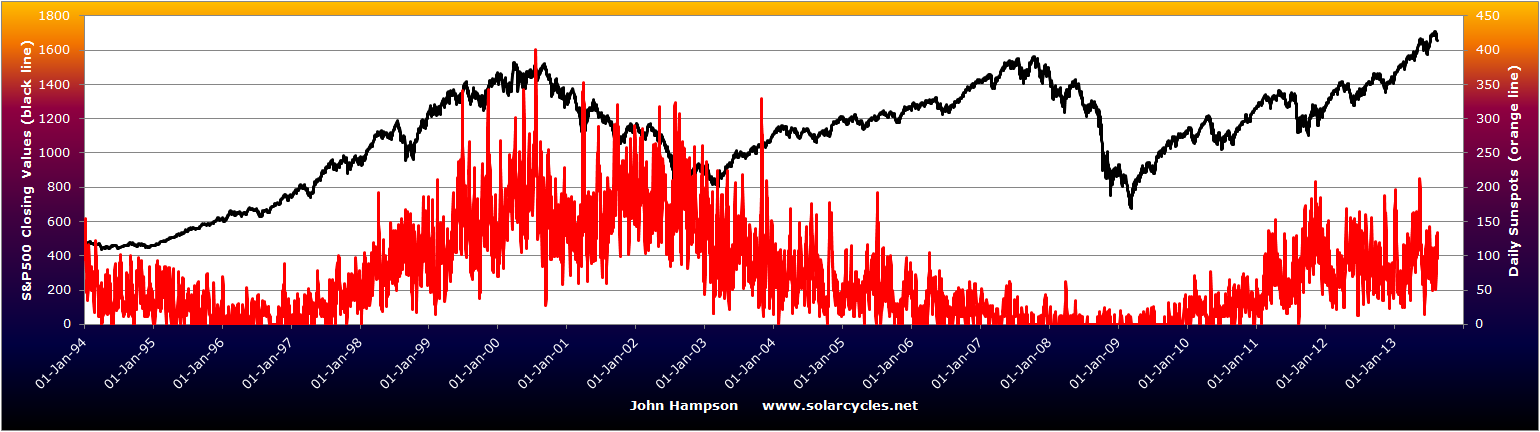
 2. Sunspots – up again currently but still no clear trend:
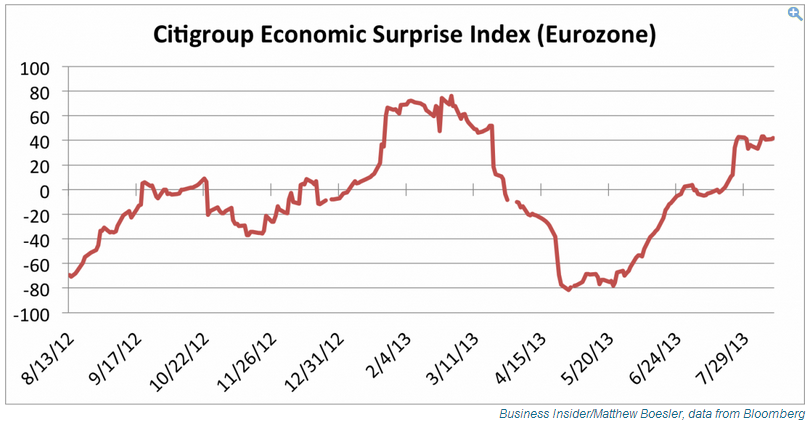
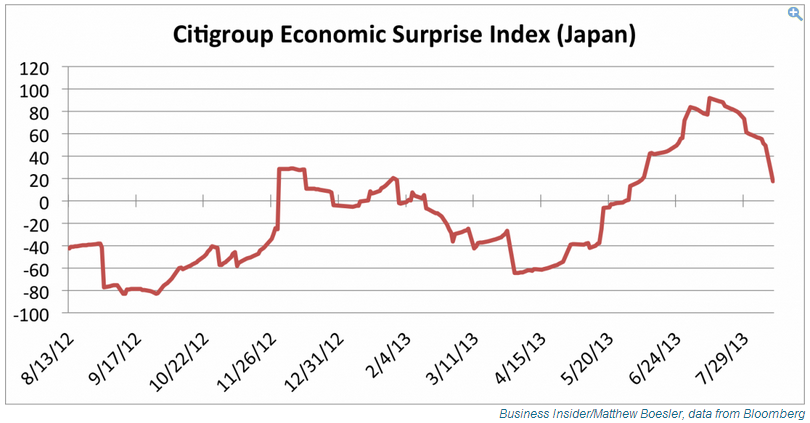
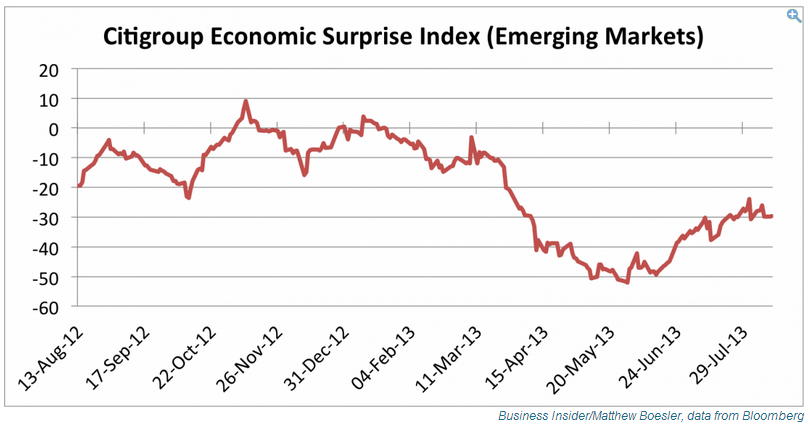
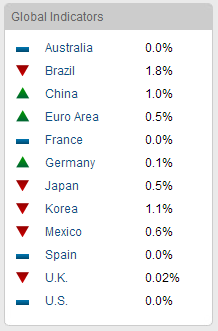
 3. Economic surprises – coincident data positive in USA and Europe, improving in China, disappointing in Japan and languishing in emerging markets:


 4. Leading indicators – weakening of late:
Source: Conference Board

Source: Dshort
5. Climate – July joint hottest 10th month on record, so not at mega-extreme, but still at levels sufficient to potentially disrupt agri.
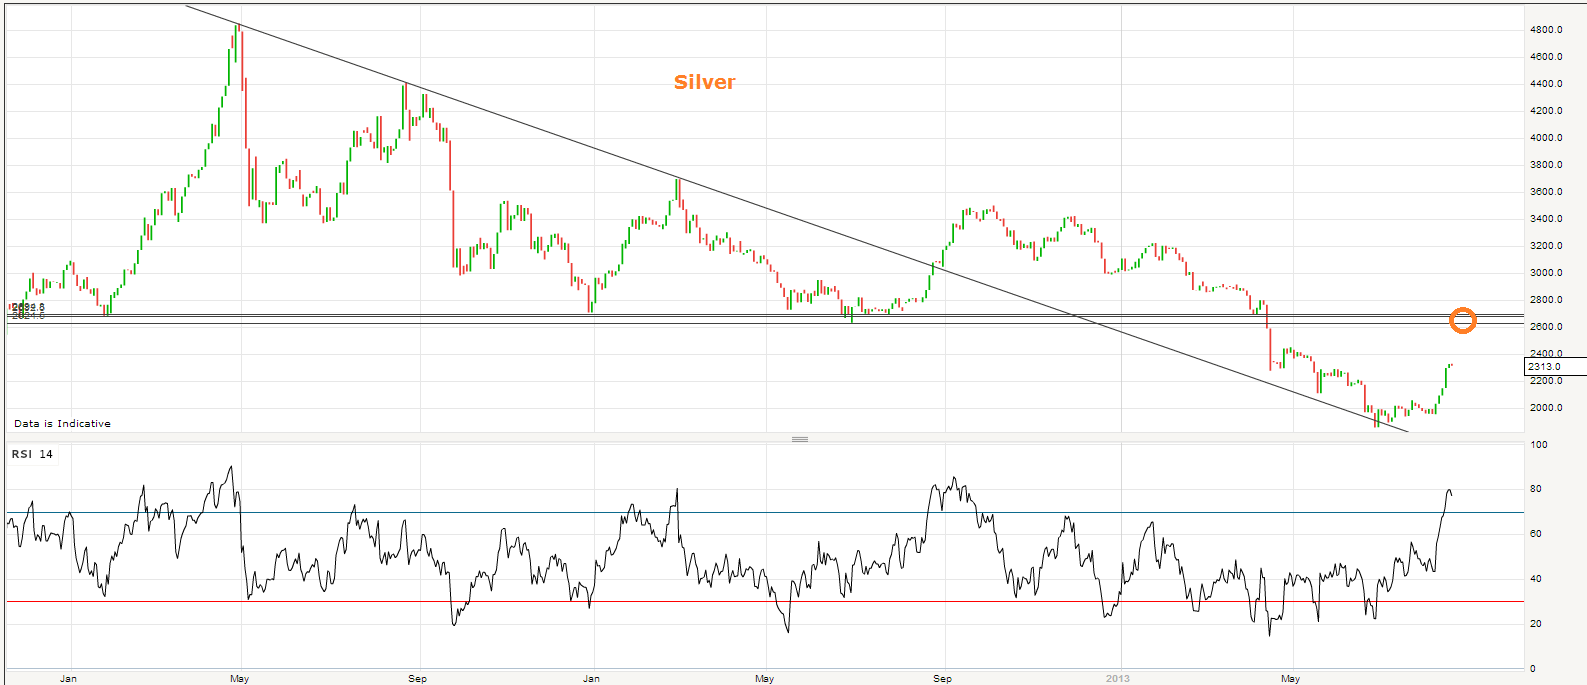
6. Silver – this seems to be the obvious target to me, horizontal resistance and a re-test of the breakdown. If it can get there I will take profits on half my positions.
7. Full moon on Wed and end of lunar negative period this coming weekend. My aim is to take half profits on Dow shorts within that period. I have no price target, just that time target. I expect equities will rise again to complete a multi-month topping process so don’t think this is the time to load up short. One more up-move, I suggest.
8. Treasury yields advanced again. Tough to call what the Fed will do at the mid-Sept FOMC, but a month’s developments to go until then.
To sum up, still looks like a topping process in equities. Commodities outperforming currently and USD weak – this looks promising for a late cyclical rally in commodities, whilst equities top out. If the solar max is still ahead at the end of 2013 that whole process would fit, with commodities topping out in early 2014. To further fit, China and emerging markets should improve whilst the developed economies weaken in terms of leading indicators. Let’s see.

Reblogged this on thedarklordblog.
Thanks
Great post, thanks John. That silver chart is a beauty!
Cheers
Rufus
Thanks
momentum top May
brief correction June
price top August
breakdown August and target previous low ~1570
that is my setup. May bounce from around full moon a couple days 🙂
Thanks Jan. Looking at the chart I can see how that 1570 target looks possible. The overall look would then look similar to Nov 2007.
a sideways range top would suggest SPX goes to bottom of range ~1570, like 2007 and 2011… and kinda like 2000
Go back 60 year & 45 year……sunspot
Louis Hasbrouck ….eistien ..past,present and future.
Retrograde and station with planet angle 0, 90, 180
Apply past ,present and future.
Past 60 year with sunspot……(Ephemeris)
Present……..(Ephemeris)
Future 60 year…….(Ephemeris)
4th Dimesion
Could you explain. I’m a big fan of the 60 year cycle, but don’t understand your post.
Past: 1869 Sunspot High, Jupiter Retrograde, Aug 9, 1869 Uranus 90 Neptune
Present: Sept 3, 1929 High, Jupiter Retrograde, Sept 14, 1929 , Ceres 0 Jupiter
Future: Jupiter Retrograde, Sept 10, 1989 Jupiter 180 Saturn and
Oct 01, 1989 Jupiter 180 Neptune
W D Gann tunnel thru the Air…………..Planet Retrograde & Station.
1929 Crash ….. 60 year Cycle
sunspots are growing into the tidal peak around Sept 10

However the general trend is weakening. The tidal cycle is about 118 days, and the general trend can be seen by a 118 day moving average (yellow below)
The 118MA also shows the bigger swings in solar flux, caused by the major tidal peaks spaced by average 10 months
the ~10 month cycle can probably be better seen when applying a lag like this

major tidal peaks are spaced by 8 and 12 months, and looks like 8 months are a bit more frequent, making the average somewhat less than 10 months.
So there we probably have the known 9 month cycle in markets… perhaps 🙂
One lunar month is 29,5 days. I take it that gives the 118 (=4*29,5). Thus there should be 4 cycles within the 118 day. Every cycle has an up phase and a down phase, taking roughly 14/15 days. Could this be John’s lunar fortnight?
I’ve noticed the shortest tidal swings take some 7 days, half of the fortnight.
Are the assumptions correct?
A lunar month isn’t quite a calendar month, so I am roughly-speaking when I say a ‘fortnight’ up into and around the new moon and a fornight up into and around the full moon. My models are based on the new moon and full moon dates.
the 118CD tidal cycle, is the tidal cycle on the SUN, created mainly by Venus+Jupiter
Taken quarter Dow short off today
John,
As per astrology til sep 6th its down days. When do you plan to take your short off completely. Are you planning to play the upswing or stay short.
Hi Bill. Have no fixed plans, will play it subject to developments. May take off another quarter short before the week is out (when the lunar negative period ends) depending on market action.
Well Rolo
I t looks like “Tunnel thru the air”has rubbed off on you.
Poor penmanship.
I also dont understand your comments.What has the 60 year cycle got to do with 2013?
bob
Hi All,
I’d just like to chime in that I am still expecting a low in Sept/Oct based on longer term 17.6 year cycle and shorter term 17.6 week cycle that I follow. So far so good, especially on FTSE. Dow didn’t pullback as much following May top and then made a new high, but I continue to anticipate an Autumn low (possibly following a short term bounce over next week or two).
http://www.17yearstockmarketcycle.com/2013/05/blog-post.html
Regards,
Kerry