

No reversal yesterday in equities but I maintain it has to be close at hand.
The Nasdaq added another day to its small sideways range. RSI divergence argues the next move should be down.
 Source: Stockcharts
The SP500 is at the top of its megaphone pattern and the Dow has edged above it. Gold miners made a megaphone top in 2011 and they also edged out above it, before reversing:
 The combined reading of II plus AAII sentiment is the highest on record, which casts doubt on the fuel for higher prices in equities.
 Source: Lance Roberts
Positioning is extreme in the US dollar, sentiment is extreme, and there is an RSI divergence between the two recent peaks.


Source: Acting-Man
Gold miners bullish percent reached zero and Friday saw a voluminous bounce. Positioning in gold is also extreme and contrarian:
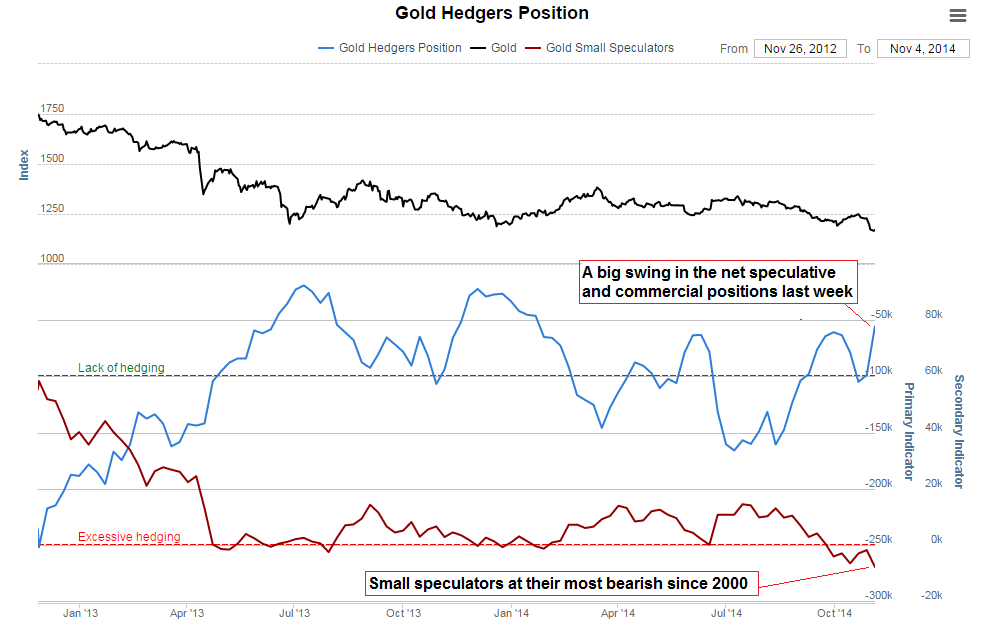
Source: Acting-Man
Sentiment plus oversold conditions in commodities argue for a broader reversal too:


Source: Emma Masterson
Plus positioning in treasuries remains at elevated levels more in keeping with a bottom in treasuries than a top:
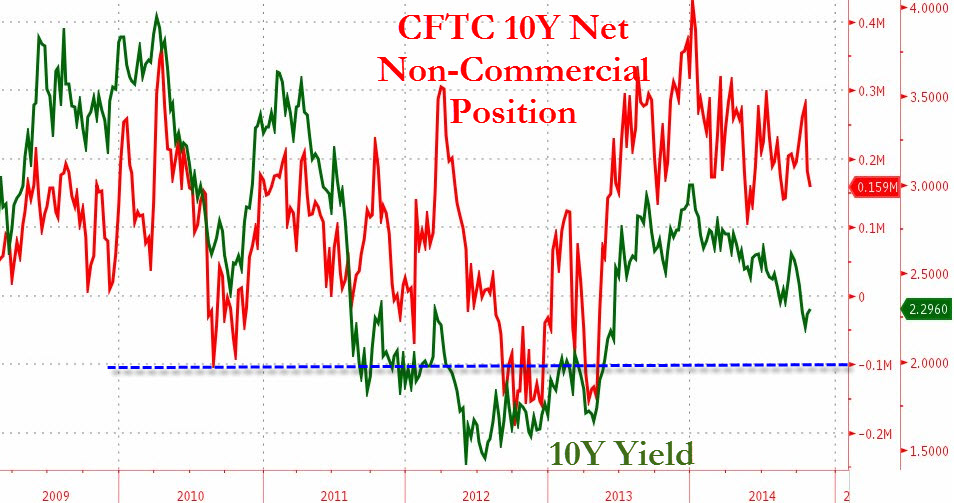
Source: Zero Hedge
Add all these together and there is a compelling set-up for a major reversal out of equities and the US dollar and into gold, miners, treasuries and maybe other commodities too. If gold and miners can hold above Friday’s low then I believe the move kicked off at Friday’s full moon, but we really should see supportive developments a.s.a.p. if so. There is a geomagnetic storm in progress and the cumulative geomagnetic trend remains down, so the underlying pressure is negative on risk assets.
Here’s a look at buy/sell pressure and momentum indicators for US equities. There have been 6 major distribution days in 2014 and no major accumulation days since October 2013. This suggests underlying enduring smart selling pressure despite the higher prices. Also reflective of this are the negative divergences in the two money flow indexes CMF and MFI:

MFI has been divergent since the turn of July, which puts us on borrowed time for stocks to peak, but CMF shows anomalous long divergence since way back in mid-2013, which I suggest shows the atypically long mania in prices.
The Chaikin oscillator and ULT momentum indicator show the same anomalously long divergence, this time since the start of 2013. I don’t believe these indicators are broken, but rather they again reflect the strength and duration of the mania this time, which in turn suggests a major crash lies ahead.

There are multiple other indicators that reveal the mania in stocks began at the start of 2013 and is now almost two years old. Phenomenal and historic.
If we look back at the Nasdaq into its 2000 peak, to compare manias, then those two ChiOsc and ULT indicators still only made a normal 3-month leading divergence. Their divergence versus the Nasdaq in 2014 is around 12 months, which is unprecedented.
 So what does that mean? I believe these indicators further cement the overall picture of one serious mega-mania which is on borrowed time and heading for a major crash. It’s just a matter of patience and money management in negotiating the short term.
So far in November we don’t see a renewed ramp up in sunspots and the probability remains that the smoothed solar max is behind us.
 Meanwhile, the collective evidence from sentiment, allocations, negative divergences, cross-asset positioning and other market indicators make it improbable that stocks can grind higher into year end or Q1 2015 for an anomalous late peak relative to the solar max. Rather, the evidence still supports a renewed turn down in equities this week and a significant down November, keeping the bear trends in European indices in tact and completing the megaphone tops in US large caps.
Simply put, I have no case at all for higher prices from here whilst I have a multi-angled cross-referenced case for equities to turn down without delay in a last gasp of the topping process that began 1st Jan. It is what it is. So on we go, it’s a partial holiday in the US today, but stocks and futures are open whilst bonds closed.

Thanks John. Another BTFD event
http://tradingtweets.wordpress.com/
Daniel, post more than just links to your site, or don’t post.
No problem. Cheers John
We are coming into a bearish time window for a short term high after which i am expecting a buy the dip event to take place. The window extends from the 12-17 November (4 sessions) after which the system is expecting a shallow sell off into the next buying opportunity higher.
Nice comparison chart of the cycles. Folks on the board might like.
Link:
http://iceagenow.info/2014/11/solar-cycle-24-rapid-descent/
Cool! It worked.
I don’t know if anyone else noticed but a small triangle formed on the DJIA (all sessions) from the 7th Nov high which then broke to the upside yesterday. The ‘measured projected move’ was to 17660 from the end of the triangle…..and guess what the overnight high has been 17660. Also the wave after a triangle is the final subwave within the larger wave.
Now personally I hate it when the markets provide such ‘exact’ waves because I keep thinking, where’s the catch – there has to be a catch!!
I guess I should just stop looking at gift horses in the mouth. Lol.
John as usual your thorough approach to each aspect of analysis is a joy to read. Thanks a million…again.
That double top in the Max has become a repeating pattern. The next cycle should be similar, but with an even lower peak. That will be the final indicator that we are full on for a Dalton Minimum.
John H., your work has been great. All of the TA says that the market goes higher. Every indicator says gold should go lower (other than yours). I say, they won’t send out a memo when they are done fleecing the sheep. You will never know what finally spooks the herd.
I believe you are right, the possibility of a crash is there. I just worry that markets will either, conveniently “break”, declare self help, or be shut down. It is starting to happen too regularly.
Thank you for sharing.
I believe these double tops in sunspot numbers are very important. According to Gnevyshev [1967], all solar cycles are double peaked, and this was further researched by Georgieva (Why the Sunspot Cycle is Double Peaked). The gaps between them can be very short, and difficult to observe due to the contrived way we try to measure sunspots.
The two sunspot peaks are caused by two surges in the sun’s toroidal field (this field is created when the main poloidal field is sufficiently twisted by differential rotation of the sun’s plasma over depth and latitude). The solar overall dipole (the true physical measure of solar maximum) switched way back in early March 2013, but has been very slow to establish strength in its new orientation – this is because the northern hemisphere field strength has not budged since then (ie. its still at zero). http://wso.stanford.edu/Polar.html#latest
So the sun’s southern hemisphere has run a fairly “normal” magnetic reversal/sunspot course, but the northern field is still due to have the second toroidal surge. There’s no telling whether this will be enough to create a new SSN high (seems unlikely). There’s no telling when it will happen (shouldn’t be too far away given the length of the cycle so far). But I don’t think we’re about to see sunspot numbers permanently dropping away just yet.
Thanks both
John,
I love your superb analyses but one minor issue today: to conclude on bearish RSI divergence ($COMPQ), you need price to have reversed first (= clear cycle tops, preferably with distinctive “white space” in between).
Thank you John for the well thought out details and most compelling analysis as usual.
Great analysis, as usual. Waiting for some price confirmation!
Regarding that Bucky reversal, USDJPY showing a megaphone top on the hourly, potentially just completed.
Thanks all.
1955 produced a megaphone formation on a very similar timeframe, here is how and when it resolved:
Hi John – Can you elaborate on this one? Doesnt look like it resolved to the downside all that much, although you could be indicating as such with the arrow. Thanks again.
It resolved down to the arrow point, then went up again
Thank you John.
I know it’s easy to make excuses when things don’t go the way you expect and by that I am not referring to you John, because I know tjat ou are the type of person that will take things on the chin.
By that comment I am referring to unusual price action in major global indices and securities, the likes of which I can’t really remember ocurring to such a degree,
Gold and gold stocks were on the precipice of major out breaks higher from down trends earlier this year. In fact they began breaking higher only o promptly reverse as the dollar began, what is has now become the strongest dollar rally in over 3 decades.
Now one can assume that that is just the nature of the beast and that the dollar rally was simply apart of normal market dynamics thus resulting in the loses to gold as the other side of the trade. However, given the timing of the dollar rally that came right on cue with a break in the metals which coincidently,coincided with ECB intervention and various announcements and I don’t think it is coincidence at all.
Secondly, desperate comments from Fed members last month that were timed right as the markets were teetering on a void into the abyss, nce again were NO coincidence.
Thirdly, comments made by ECB President Draghi to do whatever to support markets that not so coicidently again was followed by some of the most sinister action I have seen to date a few weeks ago that literally saw the DAX pulled back from the edge on three seperate occasions…….really suspicious but it shows how much they ate looking, watching and are prepared to act.
Which leads us to the BoJ, whom steps in right on cue along with the biggest pension fund on the planet to buy securities outight as the Fed ends QE(or have they?).
These guys means BUSINESS!
I said last week to watch the Hang Seng. Once again action on the HSI looks bearish, but miraculously it keeps reversing as things begin to look evermore bearish.
Yesterdays action was an attempt to reverse it back above the 50 day but failed. Again today it failed to get back above. I suggest that over the next few days there will be a concerted all out effort to reverse the fortunes of the Hang Seng as it looks increasingly bearish and if any of you are wondering WHY the HSI has become important at this juncture I suggest you look at the weekly chart after looking at the daily chart below.
There is no doubt in my mind at least, that Central Bankers are doing whatever it takes to hold this together, to the point where keeping it together means focusing attention on individual indices most likely to begin breaking down next.
Sooner or later they will be overwhelmed because all the ducks are going to line up at once.
We are close……..VERY CLOSE!
http://stockcharts.com/h-sc/ui?s=$HSI&p=D&b=5&g=0&id=p03112666628
So John, if you want to know why things have not followed through yet, it is because of the greatest market intervention in the history of mankind, BUT, it is catching up to them very quickly. They won’t be able to rescue every index at once without risking a complete loss of confidence. Then gold explodes higher.
Cheers
Anyone think that Central Bankers are not watching these charts and understand what it means if they begin breaking down?
The fact of the matter is that the stock market is the ONLY card they have left to keep confidence together. Lose it and things get very ugly very quickly because deflation is beginning to bite very very hard in Europe.
And now Japan is exporting their problem it is making it that much harder to hold it together..
http://stockcharts.com/h-sc/ui?s=$DAX&p=D&b=5&g=0&id=p61035607885
I will be extremely surprised If they can take the DAX much higher before it rolls over.
http://stockcharts.com/h-sc/ui?s=$DAX&p=W&b=5&g=0&id=p85788265019
Allan,
I agree and watch the US Market shoot up higher again today.
Joe, you may be correct. The problem is though as I said. The ducks are lining up. Major indices and currencies are all reaching points that will have to be defended very soon and sucessfully, or else.
I don’t think they CAN defend it al at once. The US indices will not be the first dominoe to fall but at some point the US indices will begin to fall hard with the rest of the world. They won’t stay aloft whlst the rest of the world is collapsing.
In regard to bonds I agree with Martin Armstrong. The collapse in equities will feed the bond bubble thus leading eventually to all out collapse when it burst.
There are perfect conditions and thus incentive to keep things exactly like they are. Greatest flow of money from workers to executives (and govt. via tax rate, 50% and up) in US history. http://www.zerohedge.com/news/2014-11-11/fed-won-americas-01-are-now-wealthier-bottom-90
The masses are oblivious to what is going on here.
The best piece of writing in your blog I ever since . Agree with you totally. Actually Im going to long EURUSD, NZDUSD tomorrow but watching more AUD which is the strongest horse.ESP35 and ITA40 ready for explosive moves. Just need a catalyst. Looking for oil bottom as well.Btw, I will short SP500 next week not this one. Thanks
I think will start to sell off this Friday and continue into next week (apogee this Saturday, bottom half of Lunar Declination begins next Thursday). Seasonals are weak until after next week. Saturn (price suppressor) is going into superior opposition next week the effect of which last at least a few weeks. Only positive is Lunar Edge.
Almost perfect. Extra things is bond. SP need to correct to match with bond markets
Thank you John, thanks for sharing!
Looks like the SPX is going above 2040
at the open unless futures reverse.
A slow continuous steam roller higher
atm.
megaphone galore! Great finding on the GDX megaphone in 2011! Everything in a megaphone now – SPY, $/Y etc.
the rubber band is certainly stretched!
Sure is, and the snapback will be ferocious. Everyone who’s bullish on the stock market and USD and bearish on gold and silver (which is almost everyone) will find out in the near future that they’ve been had. As Allan said above (correctly), the only way things get this extreme is due to massive and ongoing manipulation. But that manipulation has a mathematical endpoint, and the manipulators know that very well. That’s what Jeff at Greedometer.com discovered when he found that the stock market crashes (or corrections which should have been crashes but were truncated by manipulation) since 2000 have been happening with greater and greater frequency, constituting an exponential decay. The day is coming when nothing and no one will be able to stop the stock market, bond market, USD, and the precious metals from finding their true values. The resultant repricing will shock the world.
We saw a megaphone already at the start of 2014, compared here:
GEM update – the chart John posted for me yesterday shows the added dimension of velocity in the gravitoelectromagnetic Spiral. When the Spiral is moving more quickly so do market prices. Those hourly times yesterday were 3:00 to 6:00 and 9:00 to 12:00. Today the Spiral is contracting more tightly and prices should drift
upward. Any suggestions on an easy to make web page where I can post charts so I don’t have to trouble John?
any of the blogging sites, really. or twitter is good for posting pics simply too. if you post a link to a tweet here I think it will auto-paste it in full…
Actually, Twitter will probably downsize, which is not what you want with a chart. How about http://www.imgur.com?
thank you I’ll try it
What data goes into the GEM. How predictive of price is it (greater than 60%)?
GEM seems like a perfect addition to the Lunar Edge and Trading the Sun.
I’m using hourly Spiral data from 7442 Analytics (although I believe they have the data in as small as 2 minute segments), which is derived by an array of NASA data. Gravitoelectromagnetism spirals around the earth alternating in clockwise and counterclockwise directions. That direction changes tomorrow.
Please continue sharing your GEM analysis. This seems like the real deal.
Reading up on John’s past blogs in regards to 2nd chances and tops. Using my indicators, there is usually a correlation with a test of the midline of the indicator and a Lower high in price movement. This of course would need to stay in our opinion of a bearish market highlighted in red. To trade this indicator would have us exiting any short or long position of a bear / bull market when a turn occurs on the opposite direction and sitting it out until the trend turns with the market sentiment. Keeping any position at its overbought or oversold range where acceleration in prices occurs 99.9% of the time down or up.
Nice comment MP. Most people buy oversold on the investment they like and sell overbought. Your charts show how they should actually trade. Buy overbought and sell oversold. Ie, the $ should be bought until bear confirmed – right now it is showing strength, vice versa for gold.
Daily retest variation buy on GDXJ very close to triggering here..
…has triggered.
Oil is the bull in the china shop. Not only is it signalling deflation but lower oil prices will destroy the US fracking industry which was already rumored to be up against it.
Let’s see what happens when that goes belly up!
should now get the c wave up on gold to at least 1220, usd also finished its wave count so that would tie in nicely with gold trade
They had a fracker on CNBC, he said his costs are $20 TO $25 a barrel. He also said he expects to buy the overextended highly leveraged frackers very cheap. So the supply of oil will not dry up overnight.
Kent, he is lying through his back teeth.
http://www.wallstreetdaily.com/2014/11/11/u-s-fracking-industry/
http://stockcharts.com/h-sc/ui?s=$TYX&p=W&st=2010-02-25&en=today&id=t40082988688&a=367751244&r=1415722250629&cmd=print
did the CB’s engineer a different outcome or will reality assert itself?
it is clear that these jerks are pattern busters so what’s next?
…
cycles say this is dnoe and headed down…divergences (especially on NAUD) going to be hard to re-engineer !
19 up days into the Aug/Sep top – today is 19!
http://stockcharts.com/h-sc/ui?s=$SPX&p=D&st=2014-08-02&en=today&id=p29184750730&a=369529410&r=1415723491164&cmd=print
I use a 21 day regression channel to estimate…
And 18 days with closes above 5sma. Over stretching. From 19th to 21th you can short when appropriated , %R, DNC10
great observation. several analysts are looking for a turn this week or early next.
http://stockcharts.com/h-sc/ui?s=$NYUD&p=D&st=2014-06-12&en=today&id=p68118109264&a=367854604&r=1415725224704&cmd=print
the nya exhibits the characteristics of a failed “T” or bear T
http://stock-market-observations.com/2013/04/17/december-2008-t-theory-update/
If you consider this completely rigged
and predetermined, then why participate.
Surely just step back and let events
run their course is the logical step,
even if you are loath to do this.
CB’s are not omnipotent,
close yes, but no cigar.
Recessions, earnings cycles..
will continue to occur, they can
not be abolished.
man you so like to write your own narrative and then put those words in other people’s mouths…LOL
what a joke
I simply said they had busted the TYX pattern for the time being and asked what’s next. Note I’ve post a number of charts indicative of what’s next.
Humans are unbelievable…
so Phil, you like the debt money system that hypothecates money into existing by pledging and leveraging the present value of all wages?
lol
American humans are the worst
Be nice BBE, you meet the same people on the way up as you do on the way down.
Yes BBE I for one LUUURVE your charts and comments. Just leave the ‘critiques’ behind and do your own thing. IGNORE!!
Good read from betafish from the geocosmic standpoint. Mars and Pluto will form a square to Uranus from Monday-Wednesday of this week, then the Sun will square Jupiter on Thursday. This week is one of the greatest geocosmic events of 2014. Either we will see a major blow off top or a major sell-off this week and early next week. imho
Mercury retrograde in 3 Air signs 2015, same as 2008.
What would the catalyst be for a drop in 2015 where statistically it should be a very good year ?
I’ll go for more Europe trouble and Draghi/Germany disagreements.
Good catch on the mercury in three air signs.
I know of one person who likes to use Armstrongs economic cycle to look at high/low to high/low times using fractions of 8.6 years.
Next month is 86 months from Oct 2007.
Nikkei peaked December 89 which is 25 years ago and 8.6 x 3 = 25.8 which perhaps gives a high/low in October 2015 though this is across asset classes but with ALL pundits i hear saying next year is a shoe-in perhaps the exception will rule.
With the Mercury retrogrades next year as well perhaps obscure TA will prevail.
http://stockcharts.com/h-sc/ui?s=VXZ:VXX&p=60&st=2014-10-22&en=today&id=t25023170698&a=372598734&r=1415729433714&cmd=print
Upcoming record cold temps will be perfect scapegoat for gdp slow down. Good for us bears.
Here’s a link to a colorcoded hourly GEM path for yesterday and today. I’ll post an updated one later tonight. https://twitter.com/mjmateer
rubber band starts snapping – $/Y – tomorrow will be interesting for equities post veterans
should be the pivot for precious metals and commodities as well
I disagree with John. I believe the economic forces overwhelm the solar cycle here. Japanese pension buying. Year-end buying. Tax gain aversion. These are all real buying forces. The SPX is up in the last 30 minutes for 12 days in a row or more. This is VWAP activity from institutions — and shows that whoever it is, has not finished buying.
In addition, geomagnetism supports a year-end rally. If the market keeps drifting up 10 basis points per day, all the overbought indicators will stay there without posting higher extremes. If the crash begins 12/2014 or 1/2015, it will still be within normal expectations vs the solar cycle. Moreover, the crash can start very very slowly and still respect the cycle. Therefore, there is little urgency to short right now. I am in cash. My two cents. I keep thinking now that I am in cash, it will crash, but so far, it hasn’t happened.
John, Andre and other great commentators: Been following since beginning of the year, thanks for all the work you have done. You all have inspired me to start posting my thoughts as well. Just started today. Totally agree with you on gold, sentiment and technicals point to a bounce – bought ST calls in GDX today, looking for gap fill up at 19.6. Not sure LT if it will take off for good – taking it one step at a time.
I keep thinking now that I am in cash, it will crash, but so far, it hasn’t happened.
The above is the last sentence from one of John Li’s posts. I know he doesn’t expect it to be used in the way that I’m about to and I don’t mean him any disrespect for doing so.
But it shows the ‘personal bias’ that WE ALL suffer from with our positions.
The difference I find with our host John H is that is is willing to ‘take himself’ out of the equation and still challenges us to come up with a contrarian position. I for one am NOT ABLE to.
Hence I have to stick with his theory but being short of cash I have to manage a very ‘TIGHT’ position. I just hope that the down draft doesn’t start overnight (UK time) because then I’ll be unable to react.
Lets hope (for my sake) that it happens during UK ‘awakening’ time.
Regards
Purvez
Not picking a fight, but what do you think my personal bias is?
I mentioned the S&P rallied due to VWAP buying for 12 days in a row. If each is a coin toss, it should happen every 16.25 years…surely a significant event that needs explaining.
“Ignoring cycles and extrapolating trends is one of the most dangerous things an investor can do.” -Howard Marks
they dragged $/Y back inside the megaphone on the daily – at least a partial victory – still at the line here
Hi John I meant no disrespect. Your last sentence said that because you had ‘not’ taken a position then you expected the market to crash. At least that’s the way I read it.
I have had similar feelings for a VERY LONG TIME. The market ALWAYS seems to do the OPPOSITE of my position. I was just using your post as an example.
I’m truly sorry if that offended you.
this is stretched like a face lift about to abort
the date range here cant extend much longer at all
No offense. I am probably just touchy since I just got stopped out of all my shorts for a loss. But hey, at least I am posting this for whatever it is worth. I read many that shorted since Oct 15th and have not heard from them. Perhaps they did better than me.
But I honestly do not feel the need to short until something changes. Today looks like the 13th day in a row where we rally in the final 30 minutes. (Even if it is not, it will take more than one day and more than basis points from all-time high to convince me.) Professionals trade the close. Something is up. Could we crash rapidly once they stop buying? Of course, although I have no idea what is the expected value of fading the rally right now. I am willing to give up 2% off the highs (whatever that will be) rather than trying to capture the entire crash.
Perhaps we will see a sunspot count of 200 for 2/2015 — and that would explain everything.
And re: stocks. The VIX points to at least a ST top in stocks as well after filling the gap down at 12.5% yesterday. Looking back you will see gap-fills in VIX have been turning points. Looking to add shorts today at the close with SPY puts.
But i’m in the camp we may not be ready for a “crash” or even “correction” (5+%) for that matter. I have some hesitation when looking at the megaphone, which has clearly broken on the DOW, and SPX only marginally. Any pullbacks likely find support in the 17400 area in the DOW. If we break back below, yes we are in for something serious, but i need proof before going big. Any thoughts welcome.
http://davinny.wordpress.com/2014/11/11/spx-dow-about-those-megaphone-patterns/
Another doji close in SPY. How many of those have we seen? We had tri-star doji few sessions ago and it proved to be the beginning of next squeeze. Anyway gonna take a stab at it with some weekly SPY 205 puts. Need 20c below 204 to breakeven. Looking for quick pullback into end of week. Staying nimble.
The dojis are always due to the last 30 minutes of VWAP buying (as opposed to say 2pm rally and then flat for the final 30 minutes).
VWAP buying you talking guys buying S&P futures? how do you know that’s institutional or just some algos solely try to squeeze price back to that VWAP?
Even if algos, they must represent some real demand. I don’t buy the conspiracy theories — I classify algos as institutional trading.
But even if it is manipulation, I don’t see the difference except for me to assign blame. I am stopped out, and I can blame myself or some other algo. I am still stopped out. I want to see that pattern broken before I consider shorting again. That, or 2% off the highs.
Catalyst for pullback in stocks and explosion in gold?
http://au.ibtimes.com/articles/572316/20141111/russia-military-weapons-ukraine-tensions-crisis-days.htm
I am feeling the same sentiment as John Li’s, purvez’s and others’ on this board. Shorting this markets is like going upstream, and cash management is a daily challenging task. While I value John’s analysis and think he is the best out of the batch, I don’t see any scenario for the market crash in 2014 (my major change of heart). A correction starting tomorrow is possible, and yes I think it could take out the Oct 15 low, but I believe there will be another leg up to close the year very strong.
From the cycle standpoint, the new intermediate cycle began on Oct 15. There are normally 17-23 days within this cycle before a correction, so that is where we are right now, 19 days into the cycle. If it is true that the new cycle began on Oct 15, the top shall not be in until at least 8 weeks after, which translates to either December 2014 as the earliest, or later in 2015.
The crash will come in 2015, The problem is that nobody has had any success of timing this market, not this stretched cycle criminally manipulated by the Fed and the mafia behind it. Sadly, the crash might happen when I am least prepared, short of cash, and out of short positions.
Thanks Erick. I thought I was the only one to be stopped out.
I am still hoping for a crash right now — I am not long, but the sooner the better! Just waiting for a good entry point. Since we made new highs, I do believe there will be a second chance rally again, or a pause to get short, as I have seen in every crash I studied since 1900.
John L. You are for sure not the only one on this board who got stopped out. I’ve been 100% short since Aug and got stopped out several times and as a result losing a big chunk of my fortune along the process.
I admire John H’s resiliency and persistence. He has built an overwhelmingly strong case for the crash, which I have no doubt that will play out in time. Timing the markets is a daunting task. Every single smart investor out there has been wrong on the timing of the crash. Casey, Hussman, Meriman…etc… just to name a few.
my thinking is to wait for at least some kind of confirmation.
Could be as simple as seeing lower lows and lower highs on an intraday chart. Pick an aggregation period, say a chart with 30 minute bars, and look at SPX. We’re still seeing higher highs and higher lows (if you look at the pivots) on that time frame. So as a minimum I want to see lower low pivots and lower high pivots on the 30 min chart. Probably also good to see price drop below a short period daily MA, say the 5 day SMA or 8 day or 9 day EMA. My plan is to wait for a lower low on the 30 min SPX chart, wait for a retrace back up, then you can try to pick a reversal point where the next high will be a lower high –OR– wait for the reversal back down and then short. Your stop would be the highest high of this runup. You can add to your position on a break below the lower low on the 30 min chart and add again on a break below one of the daily moving averages mentioned above.
Daily retest variation buys on gold and silver
Daily retest variation sell on Euro Stoxx – http://scharts.co/1B47gQo
Same setup on the DAX, with a slightly stronger retrace – http://scharts.co/1xJALkT
Oh, and SPX just hit the top of the old ML set that gave the high last time out:
http://stockcharts.com/h-sc/ui?s=$SPX&p=120&yr=0&mn=4&dy=14&id=t28259635302&a=352575491&r=1415745597348&cmd=print
Nice tnx for charts……….
Abe to dissolve parliament…anybody know what the heck is going on in Japan? This $/yen is really affecting everything, from gold, equities, Euro…are we still going to yen for safe haven? Really hard to figure when things are so fluid over there!
If he waits he will lose the next election. He needs to act now.
Isn’t he doing it so that he can get four more years — the opposition is not yet cohesive. If so, the market will see it as bullish as it is more QE (for now).
weaker yen then? i thought his approval ratings are not that great, getting lower everyday, i guess he needs to do it now before he loose all support.
Japan is becoming a total basket case. Everyone thought the European Union was a mess?………stand up and take a bow Japan!
How many elections and changes in Prime Ministers in the past decade?? Add to the mix a Central Bank that is hell bent on destroying the nations currency and what have you got?………….
FANTASY ISLAND!
looks to be topping here – like the comparison to the Aug 1998 top when the topping process took 10 calendar days and the ascent into the top was swift. By the end of the week should have a clearer picture. The $/Y is multi-facteted as it has strong correlations to precious metals (+), Treasuries (+) and stocks (-). Hence it can be a beast adhering to any of the 3 correlations at times. This bubble is truly a learning experience.
if one check the $/Y 30 min chart, there is a nice little wedge forming, may want to wait and see how it breaks and trade accordingly, short term.
I focus my attention on the megaphone (THE BFD) if it is going to play out. Number of 52 weeks high issues says short term top is near.
Leaving only 20% of profit of this V rally on the table just in case this time is different .
There is no reliable signal for taking a short position yet.
Old spot 2192 will be rotating into view soon, and is believed to still be quite active. This could send solar flux to cycle 24 high given that we are starting from a base that is higher than last rotation. If flux is source of market mania, than shorts should be on your toes for next few weeks.
Combo of Lunar Edge, Declination, Ap/Peri, and seasonals rest of the year:
Cash until 11/14 Friday.
Sell short at the close on 11/14 with 2 percent profit limit and no stop loss.
Go long on 11/24 at open with 2 percent limit and 4 percent stop loss.
(THANKSGIVING RALLY)
Go to cash on 12/4 at close.
Go short on 12/11 at close with 2 percent limit and no stop loss.
Go long on 12/17 at open with 2 percent limit and 4 percent stop loss.
(XMAS RALLY)
Go to cash on 1/3/15 at close.
This is for DJIA, SPY, or QQQ, though I will be trading the SPY.
The inverses can be any inverse 1x correlated etf.
Betafish,
Very nice! I know you have put a lot of work in to get to this level. Regardless of how exact your pivot dates are (everything is forever and always a work in progress), I’m sure you see how empowering trading time, rather than price, as the priority is.
SC
you need a blogspot to track this..interesting stuff
A lesson for Japan.
If something does not work the first time, the second time OR the third time. Doing it again only more so, the fourth time, AIN’T GONNA WORK EITHER!
Ya think they woulda got it by now?!
tomorrow’s GEM Spiral is too compressed to show clearly – I’m linking a chart of 11/13 midnight to 11/14 4 pm. The path starts on the right (11/13) and curls upward to @ midday, then down overnight 11/14. Then begins up again @ 3am to a high midday and then down in the afternoon on Friday to the close. https://twitter.com/mjmateer
Moved my 2 ftse long stops up to 6499 to bank a bit.
Added 4th SPX short under 2000 at 1994.
Hope I don’t get whipsawed.
Thanks everyone, new post is out
Today 11/12 the polarity of the Spiral flips which results in a negative trend into 11/24 (not the daily trend).