

Are we at a bear market bottom in equities? Take a look:
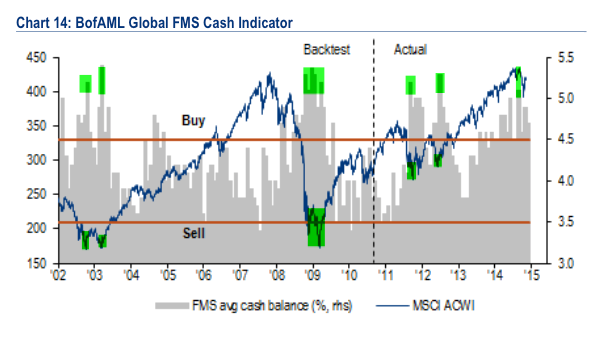
1. Cash holdings of fund managers like the major stocks lows.
 Source: U Karlewitz
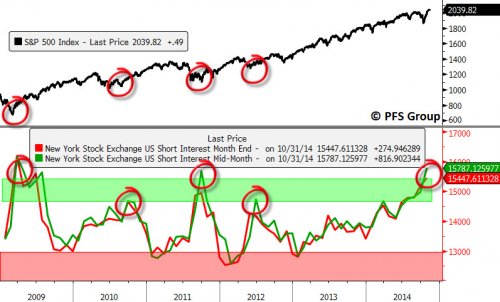
2. Short Interest like the major stocks lows.
 Source: PFS
3. Capitulative Breadth in mid-October like major stocks lows.
 (CBI by Rob Hannah)
4. Volatility drops like the major stocks lows in 2008, 2002, 1990 and 1987.

Source: Dana Lyons
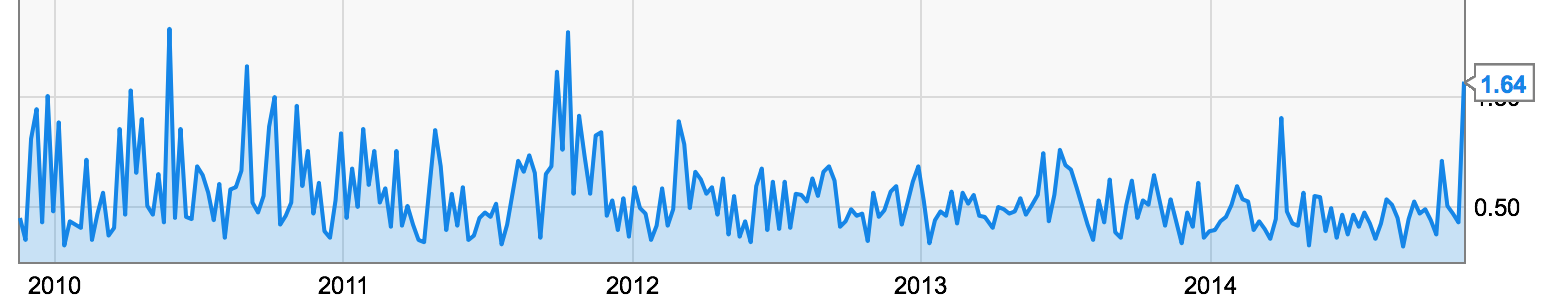
5. And yesterday the Vix put/call ratio reached the same level as the major lows in stocks in 2011 and 2010:
 Source: Ycharts
How could this occur as stocks reached all time highs yesterday? And how do we square all the above indicators with contrasting bull market topping readings in valuations, leverage, sentiment, allocations, dumb money flows, sector and asset rotation and others (all documented in detail on this site)?
One thing should be clear. We are not at a bear market bottom – we are at all-time highs, the very opposite. So in line with readings on some other indicators, we are in the realm of the unprecedented.
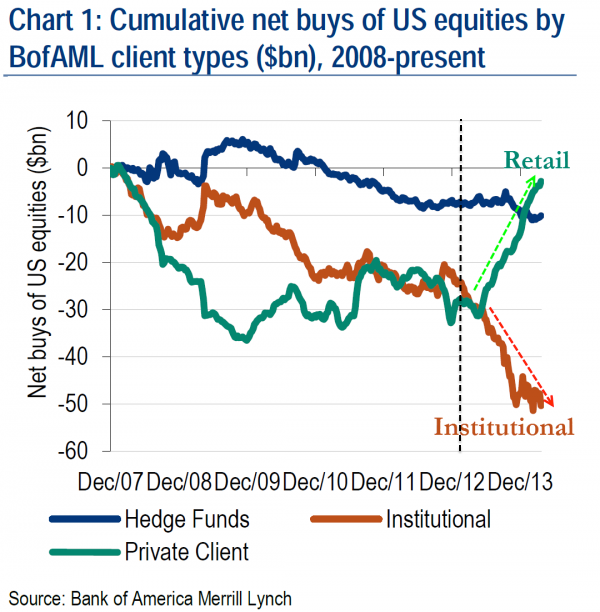
Look again at the first chart: fund manager cash. Note how it moved inversely to stocks until the start of 2013. After that, cash rose steadily as the stock market advanced. Same for the second chart of short interest: generally inverse to the market but not as of 2013. In that same period, institutions have been sellers whilst retail and buybacks have propelled prices higher, so maybe this accounts for what we are seeing.
Look, if you want to take a bullish view on the all the above, no-one can argue against you. In the realm of the unprecedented, the implications of these readings will only be clear with hindsight. But, drawing all market disciplines together, my take remains that the most likely outcome is that we are heading for a steep and swift crash. All the terrific imbalances in the market, both in levels and durations, I believe are most likely to be resolved with a major reset. It’s either that or we are now in a new normal in which many traditional indicators no longer have validity. I don’t buy that.
Yesterday was another painful day, but the clues that a reversal is close at hand remain. Small caps and junk bonds declined again, defensive sectors outperformed, negative divergences persist and gold miners advanced again. Recall gold miners popped out of the top of their topping megaphone formation in 2011, only to be swiftly reversed with a long tailed candle to the upside. So I am looking for something similar. Maybe we have to wait until the weekend’s new moon, we will see. But, the lop-sidedness in the markets is more extreme than ever, when we look at Vix, Rydex, II&AAII and ISEE p/c all combined.
Lastly, here is sentiment over allocations which reveals stock market mania, tying in with the sunspot maxima.


If this turn is really a significant one, this market behavior was to be expected.
Using Vuckevic’s formula for the Jupiter/Saturn cycle – what is really solar activity – it really seems that an 11 year cycle ended in 2013. This caused the 2007/2009 move to be short in terms of cycles, as the longer term was still up.
If we combine this with the apoperi cycle it really seems we are heading for a multi year decline.
As solar activity (electricity) is fundamentally an other force than gravity, both forces should confirm the turn.
This whole year the gravitational cycle was positive, while the solar cycles already had turned. I believe this causes all the divergences.
But time is running out. I now have January 30th 2015 – and a fwe weeks around this – as the most likely turn date.
We’ll see.
You posted what i was thinking, while i slept…
Thanks Andre
John, am I reading the ‘Cumulative Net Buys of US equities’ chart correctly? It is showing that since Dec’07 to Dec’13 adding up all 3 groups there were Net SALES in that period and yet the Stock Market went up by 200+%. Have I understood that correctly? If so then I’m checking myself into the nearest Looney Farm where I will be in ‘like company’.
BofA clients
Early AM dip in US futures,
if this follows the usual pattern it’s
a gradual improvement as the open nears.
I do not subscribe to the this time it’s different view,
as it never is.
What is unprecedented is the combination of ZIRP
with global rounds of QE which have elongated this cycle –
not abolished it as will become evident with the nest US
recession.
In altering the cycle it has thrown timing out
of the window, as a result a multitude of usually
reliable indicators are not working as they should.
The end result will be a bull market lasting well in to
2015, at least imv.
I totally agree that markets SHOULD reverse based on much compelling evidence, but let’s not underestimate the role of the the big three Central Banks (USA, Europe, Japan) and as long as the masses feel comfortable with their policies, markets will not reverse substantially any time soon.
agreed. Not only do we have CB’s actually BUYING the stock market, but we have the perception of traders/investors that CB’s have their back. That combination of actual buying and perception is going to be tough to beat.
Peter, you already have some countries entering the next
recession, global growth prospects are weakening.
The US business cycle will be about the last to tip over
and currently continues to churn out higher earnings and
dividends.
This is as textbook a sell setup as comes. Does that mean that you are guaranteed a multi-month down move? No. It means that the chance of a 1 or 2 R move down is very decent. Trade accordingly.
http://scharts.co/1xErxGr
Btw, of course, I should add that the trade is only triggered on a break of the low. I wait for the market to get me in and also to take me out….
” It’s either that or we are now in a new normal in which many traditional indicators no longer have validity. I don’t buy that”………
And I don’t buy it either. I heard very similar in 99/00. Remember Alan Greenspan’s famous quote at the time?
Hang Seng and All Ords had another down day. That makes three in a row for HSI and 4 for the ASX. The ASX has now broken back below its 50 and 200 dma only this time it has done it as the 50 recently crossed under the 200. Very bearish.
http://stockcharts.com/h-sc/ui?s=$HSI&p=D&b=5&g=0&id=p71428653615
http://stockcharts.com/h-sc/ui?s=$AORD&p=D&b=5&g=0&id=p32624840520
I suspect what is going on in Asia has more than a bit to do with Jaoan
Allan,
As an Aussie watching the ASX, I agree. We seem to be now driving our own destiny rather than following the big US of A stockmarket
“You can some of the people some of the time but not sll of the people all of the time”
Dr Copper beginning to look decidedly sick too
http://stockcharts.com/h-sc/ui?s=$COPPER&p=W&b=5&g=0&id=p31699677631
Lol that quote doesn’t quite make sense. I am sure you know what I meant.
“You can fool some of the people some of the time but not all of the people all of the time”
I think it goes like this: You can fool all of the people some of the time and some of the people all of the time. But you can’t fool all of the people all of the time.
Yes, the weekly MACD is pointing to a re-acceleration of Copper to the downside. But if you really want to see how “sick” Dr. Copper is then look at the monthly MACD and compare mid 2005 to now. Mid 2005 was when Copper did its famous and historical rally and now we could be seeing the exact opposite.
It’s not different this time in that the cycle
ultimately rolls over in to the next recession.
That never changes.
What FED action has done/is doing is elongating
that cycle.
You have to keep that in mind imv.
Today’s FED minutes may be more dovish than
some anticipate.
The FED will want to avoid a vertiginous rise in the $
index.
Not that the rise in the $ has prevented US equities
from powering ahead, however a more dovish tone
may propel a continuing move higher in to year end
providing another excuse to stay long.
Appreciate many see an imminent turn lower here,
so let’s see how this develops.
I am looking for three major key outside reversal bars: Monthly, Quarterly, and Yearly. Of course this points to the “top” being in early January. Should the monthly MACD not signal with the conclusion of November will raise the odds of a sell signal with the conclusion of December for the crash to start in January.
The Australian Dollar is considered a proxy for the Chinese economy so take a look at what happened today with the daily and monthly MACDs.
John–can you in any way highlight the excess in the SM compared to the 1920s–wasn’t Benron’s QE akin to The Fed’s coup de whisky the the late 1920s? Since the Fed has made this the Full Faith and Credit bubble, by buying up nearly EVERYTHING, wouldn’t cracks first appear in the bond market and even stoke the stock bubble more, before it ultimately collapses?
By demographics, economy, rates/yields, CB intervention and solar cycles I see us comparative to 1937 not mid-late 1920s.
The American Public’s craze in buying autos, phones, stocks, and putting Republicans in political offices mimics the roaring 1920s.
Yep–and they got booze this time, too-at least legally.
Gothic, this is a very nice analogue and very similar to how I am approaching the market presently. USA equities should be the last domino to fall after everything else collapses. So despite somewhat grim global macro conditions there will be an unprecedented and perverse manic euphoric buying of USA equities that continues to drive it skywards to levels no one ever imagined to be possible. And like all past bubbles the biggest gains will occur in the final six months as prices go parabolic.
John H will be proven correct and the market will eventually crash and probably lose like 60%-70%+ of its value. But IMHO this crash scenario does not occur until maybe two years or so later and from levels that could potentially be DOUBLE its price currently.
Hi Steve–no idea here–seems like sovereign bonds are the real bubble–any weakness there will just fuel stocks even more. And if the Fed buys ’em all– same deal. Too weird!
: Some thoughts from Jim Stack, a sober and reluctant bull who remains 83% invested:
“There are multiple scenarios or paths this current bull market might traverse, but there is only one outcome. Whether six months or a year or more from now, this bull market will end in a bear market. And judging from the fact that every bear market since 1933 except one has taken back approximately one-half or more of the previous bull market’s gain, the next bear is unlikely to be a mild one.”
Given that most bull markets last between 4 and 6 years (and we are well into year five), hopefully this will give some people the perspective necessary to deal with the current mania. There are no absolutes, but this would be the “benign” yet probable outcome that could give some of us (non-bulls) the perspective to stay strong in this mania phase…
An emergency vehicle in my township pulled out in front of me
yesterday… I had to chuckle… due to space considerations the
fire department’s logo had been abbreviated to a shorthand used
by modern traders…BTFD!
slater – That’s hillarious
You think that was unintended?
Remember…..”They Live”
What explains the high levels of shorts & puts is ‘timing’… Those traders that were ‘late’ placing hedges during the 2007-2009 collapse have been proactive this time around. So early to the party, sort-to-speak.
When the Japanese carry-trade collapses, so will the stock markets.
Ned Somers nedsomers@me.com mobile/text: 917-945-7667
>
We are not mid cycle, this is late cycle.
While there are never certainties in market
timing, I would find it jaw dropping if the
US business cycle can continue for another
couple of years.
This is the latest line from the uber bulls,
that we are merely mid cycle.
Plenty of LSE listed companies have cautioned
recently, warnings here over the last Q are at their
highest since 2008.
The ULVR and STAN updates in particular were
bearish stand outs for me.
The Far East is slowing and the foundations for the
next bear market are being built.
elvis,
you may think I am some flag waver for
the uber bulls, that is not the case.
My central view has been that a US bear market is
far more likely in the later half of 2015.
I think being short right now is fighting a number
of powerful factors pushing markets in the opposite
direction.
Would accept that we must be due at least a couple of
weaker days, but this market looks dangerous to me
on the short side.
Appreciate your comments, Phil…
I don’t agree with you at this moment, but reading your comments helps me to ~not~ get too excited in EITHER direction of the market…
Just following signals, and while right now they point down, your comments will help me (discipline-wise) get long when my signals flip….
And they will, I just have no idea from what level…
Higher? Lower? Just no clue…
Thanks again…
Something strange happened yesterday. Many bears began rationalizing why this could be the start of a long term bull market, whether or not they changed their minds. I read it on Yahoo Finance and then John Hampson tried the same here. I did the same — presidential cycle, year-end rally, rates only beginning to rise, 1959 solar cycle bull market. It is as if we are all in sync in thinking — are we all sheep or wolf?
Other than Hampson and Barry, is there anyone that is short? Raise your hands please!
I think I will join the shorts with Bradley tomorrow. I suspect there are many bears waiting with stop orders which is a great strategy too. Or bears in cash who will eventually turn short. Or bulls with trailing stops. That will add fuel to the downside.
If the market does not turn here and now, I am going back to my original plan of waiting until a more significant swing down before trying again short.
John Li, neither sheep nor wolf. Just conditioned through repetitive ‘therapy’!!
Could that be a vague definition of sheep?
I entered a very small scout short position last Thursday. The market will take the least number of traders along for a profitable ride. Short will be on the right side eventually and I am patient. Never easy since the market will not issue a “go short now for easy profits” signal.
Watching and waiting for price failure to add more shorts while taking profit on my remaining long positions to the extent I can.
To answer my question as to why we have to crash at all, I found myself thinking that the solar cycle failed in 1959. My answer was that there is something structurally wrong with the economy unlike 1959. The worst culprits would be Emerging Markets (Eg Brazil, China) from excess capacity and debt, and Europe from Euro experiment.
My model shows that EM (DFMGI/HSI/EWY/EWZ) are all post-second chance. And DAX is finishing up its THIRD chance right now at 200SMA. My discipline would say to short, even if SPY doesn’t yet pullback from peak.
I probe and test price.. No need to guess since my thinking (bias) kills profit…watch breadth and price failure.
I respect John’s work. A man is as good as his conviction. He is da’ man. We win some and lose some in life. it is OK. John is a winner. I can tell.
Dubai and Hong Kong are post-second chance, and that is where the bubble lives — look at real estate prices. If they waterfall, they might pull everything else down.
I said it the other day……We’re already in a bear market.
http://www.zentrader.ca/blog/?p=24494
I much agree, but how do we trade? EWZ high was on 5/2008, which was much later than the SPY high 7-10/2007.
BTW, are you the owner of zentrader? Interesting read.
Dominoes lining up. 1. Any kind of down day will give an $NYA McClelland Summation Index sell signal (NASDAQ already has). 2. That is usually good for at least a 4-6 wk correction. 3. That will turn the daily MACD down from a high level which will turn the weeky back down and continue its downtrend. 4. That will turn the monthly MACD down which indicates a crash in Dec or Jan (see Richard Isaacson’s comments today and previous post.) Joe Granville said all bear markets start with a short term sell signal. That first domino just needs a little flick and the rest will follow.
I am looking for the “top” in US major stock indexes to occur in the first half of January and for 2015 to be a key outside reversal bar of 2014. And, yes, there is such a thing as Quarterly and Yearly bar charts of stock indexes. Most Small Specs don’t have the view of Monthly bar charts let alone Quarterly and Yearly bar charts which is to their detriment.
I am both short and long as usual…..closed my Hang short way too early a couple of days ago though…..that’s life…
J
Elevated cash is likely due to ridiculously low interest rates. Perhaps being held in preparation of shorting market?
Barry, you have system and if that works
keep using it.
Is your system saying 100% short now
or still 50%?.
Apologies as you have probably already mentioned this.
No worries… 100% short signal as of 11/14…
And unless something huge happens, no change to signals any time soon…
The system is actually at -140% (minus 140%) right now, but for actual signals, it’s always on one of the following four: 50% long or short, or 100% long or short…
Thankfully, I’m a better trader today…
I got “schooled” yesterday…. 😉
What’s happening to gold? Suddenly beaten down AGAIN. Allan, any ideas?
I haven’t seen Trader Dan post on this blog in over a month but if you want a real eye opener about gold then go to his site as he has been posting heavily against Gold for weeks now and has been correct. His posts agree with the MONTHLY bar chart of Gold futures and the monthly MACD re-diverging to the downside in a very big way in both price and time.
Looks like markets trying to front-run a hawkish FOMC minutes. Major false-breakouts setting up in everything if prices hold here. someone knows something? no one knows except the Fed and the sharks. let’s see how we close the day.
Hi John,
I am ready to deploy all my saving in shorting stock index and buying gold. I am a plumber and I don’t know too much about stocks but I heard great things about shorting and buying gold.
Joe, if you are interested in gold and silver, I recommend watching youtube “Kitco” or “Cambridge House” where they have a lot of content from this industry. Some of the old timers are predicting another very lean years in the sector so timing can be a problem.
http://en.wikipedia.org/wiki/Joe_the_Plumber Hi Joe, I’m Doug and I’m a gay man and a gay journalist. https://www.youtube.com/watch?v=3mG-T9ocF_U You’re on the right track.
Trader Dan http://traderdannorcini.blogspot.co.uk/ just made another good post about Gold wherein he is comparing chart patterns of the Yen to chart patterns in Gold that indicate that Gold will drop hard again just like the Yen is doing. I recommend you go to his blog site and read all that he has posted for the past several weeks about Gold before you “bet the farm” on going long Gold or shorting US stocks.
Joe if you are a plumber then you SHOULD NOT get involved in the stock market other than through a financial consultant. Better still keep your CASH as that is the most undervalued asset at the moment but is rising fast.
Certainly DON’T deploy anything more than about 20% of your savings if you absolutely HAVE TO.
However I get the impression that this may just be a hoax comment. Sorry if my ‘impression’ turns out to be wrong….in which case just follow advice of paras 1 & 2.
Is that you Gordon?
Japan holding up nicely…presumably because of the strong economy…lol
J
1820 here we come
http://stockcharts.com/h-sc/ui?s=$MID&p=D&st=2014-04-30&en=today&id=t83349776642&a=374805050&r=1416410988358&cmd=print
stay long phil!
Be nice…
A bottom will be here before we know it, and hopefully, with Phil’s help, we’re ALL going to ride it higher…
why be nice? why be anything? why not just BEEEEEEEE?
Elvis, your prose reminds me of the poetry of E.E. Dummings.
BBE, I’m not getting excited here, until we can get through the 2030 area first….
But why 1820?? 1820 would pretty much make my year, though… 😉
GEM hourly forecast has last gasp high 13:00 hour today est. Then down until Friday. will update later
Hi Peggy, thank you for this update. Is the high an important one or will we have 3 days correction and then moving higher next week ? Please e-mail at giupepe28@gmail.com shoud you have further interesting study material.
GEM forecast looks for another high 11/25.
davinny, a more hawkish tone given the significant $
strength would surprise me, unless the FED deem the pace of asset price increases needs to be moderated.
Yellen has warned twice already on areas of excessive
risk in markets.
The market has chosen to focus on what appears to be her
central view that overall asset prices are not in bubble
territory.
The FED do not have a great recent record on excessive
risk taking, as Bernanke’s now infamous assessment on
the risks in sub prime pre 2008 show.
elvis,
thanks for the concern but I am 100% in cash,
as mentioned last week.
You appear to consider me some uber bull
which is not the case as my posts clearly show.
The shares I usually trade are at levels that I can not
justify buying, that does not mean markets
cannot continue higher.
1820 is a huge call to make,
see where we close today on US markets.
I dont consider you at all Phil except for comic relief
JSE ALSI, safex confirmed topping today into C-leg Primary IV, still in a SPX leading phase. No worry Primary V due in a few weeks, will bring new JSE highs not necessarily anywhere else.
Positive global economy recovery data will bring real fear from withdrawal of crazy QE & direct interventions (market manipulations). Fear of very real inflation after years of equity fantasy land. Reversion to norm gonna be real too, underthrow may be even more time consuming to rectify.
Stick this for next new norm, I buy what people want, I buy gold & silver. Now.
Its another BTFD? The 12M forward PE estimate for SPX is still at around 16X, if interest rate continue to go lower… I start to wonder where this market gonna stop… 2200 – 2300? 😰
Imagine a world where “real” investors are the majority. Where these figments of fiction look for proven and sustainable fundamentals.
OK go laugh, go roll on the carpet. But just imagine what it would be like.
Some old people say that they remember that is how it used be, a long time ago. Before financial weapons of mass destruction.
pretty funny
the ptb are trying hard to train the sheeple about gold
latest gold smash timed with headline about swiss gold referendum losing
they’ll have to come up with a new reason …. real fast
gold positive soon
Mirror image Symmetry ?
This month reminds me of January into opex and then a down move. On looking at the CAC take the high in June and a lot of time symmetry has occurred from the high to lows/highs after that date and going backwards from that date.
The Oct low was the end Jan low and the high now matches the high end of Dec. So we go down for approx 2 weeks though a bradley is 3 weeks time. Bearish candle today similar to January as well.
http://bigcharts.marketwatch.com/advchart/frames/frames.asp?show=&insttype=Index&symb=FR:PX1&time=9&startdate=1%2F4%2F1999&enddate=1%2F29%2F2014&freq=1&compidx=aaaaa%3A0&comptemptext=&comp=none&ma=4&maval=50%2C100%2C200&uf=8&lf=4&lf2=2&lf3=32&type=4&style=320&size=4&timeFrameToggle=false&compareToToggle=false&indicatorsToggle=false&chartStyleToggle=false&state=10&x=22&y=11
To answer John Li, I went short again at the market close yesterday. And 100% short I am. However, I do see the strong points made by Phil, Vinnie and others on this board and how much risk involved being short, going against the CBs.
I believe that we are almost finished with the market rounding top, and overdue for a reversal. Still don’t see a strong case for the crash in 2014. 2015 would be more likely by my count.
I was happy with IWM this morning, but not anymore. We need a -2% off highs to have a better certainty that the swing high is in. Otherwise, this could be 7/1929 instead of 9/1929.
You trap yourself by thinking too much. Simply trade the trend at hand. Dow was down 60 today, roared back, front month calls made a killing ATM. Now if you sold your shorts in this AM blip of selling, you did good.
It is hard to argue against you, vinnie. It is true that the BTFD mentality and this rally probably is beyond anything any of us have ever witnessed. But the fact hurts. I had gone short then got stopped out again today. While I agree that BTFD is a short term winning strategy, I simply don’t have the heart or the guts to buy this market. I would rather stay in cash and go all in short again when the reversal is clearly in place. I don’t think there is much money left to be made staying long this market. While the risk of shorting is quite high, the reward would be spectacular if the technical indicators pain the correct picture, that the correction is imminent.
barry – 1820 to be found here
http://stockcharts.com/h-sc/ui?s=$NYUD&p=D&st=2014-06-23&en=2014-11-19&id=p91327081220&a=367854604&r=1416421483432&cmd=print
and here (actually the pattern measures to somewhere off the page – near 1750
http://stockcharts.com/h-sc/ui?s=$SPX&p=D&st=2014-03-01&en=today&id=p75690417263&a=372609499&r=1416421819833&cmd=print
by end of the year maybe
The jaws of death. This is the most insane rally I have ever witnessed.
BBE,
Thanks for your charts. How quickly do you think your 1820 target will be achieved?
depends how much “topping” we continue to see – the bleeding is internal right now so we need to get blood in the water. a day or two at the most before this starts to look shabby to the faithful
“before this starts to look shabby to the faithful”
EXCELLENT phrase!!
I concur. I bought some more IWM puts on Monday. I think we are about to teach people what fear is. It has been absent from this market for way to long. The santa rally will likely be cancelled.
Fair enough….
Lets just get through that little shelf they built last week – the lows around 2030-2032 – first… Then we’ll see…
Rest assured, I hope it goes per your target, but we gotta get through 2030 before we get to 1820…..or 1750….
the ptb training of the sheeple continues
when V-A-A-L speaks, sheeple must listen
Stocks good, gold bad
What would Sean Connery do?
wear a toupee
LOL
A: Elvis Parsley. Q: What’s green and sings?
10 points if you can name the Connery movie Specie was referring to.
Zardoz (1974)
Peggy, I’m not for a minute going to pretend I have one iota of understanding of your GEM model…
But if it called in advance the high within an HOUR of the actual high, I’m on-board!
Thanks!
thanks Barry. be careful – you might start rotating to the Spiral!
last anchor for bears really 117.93 was the October high in 2007 or the onset of the last big bear party. Talking $/Y.
Have to respect the power of the BTFD mentality. Who is buying? The FED? They have bought the Dow all the way back, a 60 point swing. Short signal imho can’t be confirmed unless a decisive and clear reversal is in place, say 3% drop from the current high.
Close. It’s more likely BOJ buying the Dow. All they need to do is rotate between a few issues each week that are heaviest dollar weighted, and bingo, no drop possible. They’re buying with worthless paper, so they have unlimited resources.
This whole month feels like a CNBC pump and dump before expiration this Friday. Everyone completely ignoring glaring technical sell signals.
OK, so…..what’s it gonna be now? Another day, more consolidation before heading off the days lows and ending barely scratched. OPEX should generate a huge bullish ramp, not saying it will last, just the usual OPEX ramp. Being short keeps getting you burnt daily. If you day traded the AM drop today, kudos.
<>>
Might want to check RUT, Vinnie….
TZA – up 3.1% today… Not so “burnt”….
Thanks for noticing, Phil…
Rule of thumb – Buy the strong, Sell the weak…
Nothing wrong with having a small position in the RUT via IWM, the index is filled with high beta and suspect to swings. Play both sides.
1820 on the SPX will have to wait
for another day then.
A glimmer of light in the RUT price action
for those short.
you funny Phil – like I was calling for 1820 today
what a putz
Talked to a smart quant. he thinks the correction will be fast and deep. the amount of people short vol products is alarming. It will cause vol to spike severely once we get going.
There are equally large plays on VIX calls, your statement is without merit.
Look at Friday’s OPEX open interest on both sides, pretty equal.
Vinnie you are wrong. People are now net short vol through etfs for the first time in history.
Aware of that, it’s called irony which appears
to have passed you by.
The English(that’s me) do it so much better.
Less than 230 SPX points to go, just.
LOVE the British version of “Top Gear”!
The US version is just sad, compared to the Brits…. *big sigh*
The irony and sarcasm IS much, much better…
Yes, the actors in the British Top Gear are paid much more to have the opinions they flout. It is staged to hell and insults the intelligence of the viewer…..
imho
J
John what you said here was all you needed to say:
“So in line with readings on some other indicators, we are in the realm of the unprecedented.”
All the TA you’ve done for weeks, all the calls for a pullback, none of it matters when we are in uncharted territory. So you point the flashlight forward, and go in the direction the market gives you to trade.
today, that was down. So did you short?
On a Fed day? Are you kidding. Better to enjoy the day and do chores than play with fire. Down? The indexes barely got scratched.Tomorrow may be interesting.
2 Questions for gold miner longs here:
1. If SPX rallies into 2100+ territory, what stops gold stocks from falling deeper? Who needs gold when stocks make money and bring dividends?
2. If SPX crashes, with all that exposure and margin calls, what stops traders from throwing away everything, gold stocks included, and pushing this market lower?
Tuna, both those scenarios are potentially valid.
However, whilst we may still see a capitulation sellout from gold miners, there’ll be plenty of buyers nibbling too, so a quick rebound should ensue.
I’m long miners over the medium term, HUI to 1,000+ is my expectation, within a few years. Timing the exact bottom not a priority therefore.
Good luck.
Vinniesj
If you could be more condescending that would be great. Also, if you could be less specific in your put-downs that would be good. If you could impart less information when putting people down that would be the icing on the cake. No? Not possible right?
You said something a few days back which was something like “I just trade the trend, and move my stops up periodically”…….is that about right?
To me, that sounds like a hindsight-investor (e.g. “I bought the SPX ETF at 666 – didn’t you”) or someone that doesn’t make a living from this……and there is nothing wrong with either of those. The problem is in your unspecific, naive and arrogant posts. Be specific, impart something worthwhile, contribute…….but don’t just sit there and deride others. There are many on here that do not trade but they like to analyse and discuss cycles and academic/scientific possibilities potentially affecting human behaviour. You have to take their views with a pinch of salt if you are trading for a living – especially prop. If everything you read here makes you angry and derisive towards others, why spend time here?
Let me know when the batteries run out in your flashlight lmao. Or something useful like price levels you are watching to closeout your longs from 666.8……^^
imho
J
“If everything you read here makes you angry and derisive towards others, why spend time here?”
My conclusion would be that he likes being angry and derisive towards others.
Amen.
2 Questions for gold miner longs here:
1. If SPX rallies into 2100+ territory, what stops gold stocks from falling deeper? Who needs gold when stocks make money and bring dividends?
2. If SPX crashes, with all that exposure and margin calls, what stops traders from throwing away everything, gold stocks included, and pushing this market lower?
————————————————————-
I will give it a shot:
1. I am not sure I understand the question. Gold stocks and gold itself is quite a different thing. Gold is an inert useless metal that has historically been used as a store of “value” and arguably still is. A stock is a proxy for the sentiment or perception of value in a company – that is to say a company that issues a profit warning is suddenly worth say 30% less than it was at 4pm yesterday. How can this be? Either the market has overvalued the stock up until this instant, or it now undervalues the same company at this point in time versus a future outcome (say if the eventual reality of the profit warning was different to what was expected), The reason for being so simple, is that I am somewhat long gold miners now and over the past 3-4 months have been buying because I often play or bet on this *perception* of value that always swings between doom and euphoria. The gold mining sector is one of the absolute dogs of the universe, and it doesn’t take much for a spark to ignite in that environment. A few % movement due to phys gold price, oil price, interest rates, war – whatever it is will probably be powerful when all other sectors are bloated, overvalued etc. and this constantly erroneous perception of value changes. Who needs gold? I don’t know is the answer. I have never purchased physical gold other than in jewellery. It doesn’t make me feel safe. On my modest farm somewhere on the continent with access to all I need to survive I guess I feel safe even though this is not a theme I dwell on. gold has no use in a world where survival is everything, and I cannot use it as a currency today either. I am not criticising people with kilos of the stuff in their homes, everyone is different and who knows whether they are right or wrong or if that is even relevant. Whilst I see gold as useless in many ways, I also see *money* as a scam. It has no value unless everyone believes it has some. It can be (and currently is) devalued ferociously by the people that we thought were there to protect us and make us a cohesive society. We all know the loaf of bread cost 1 million DM etc….it’s just a scam.
2. No one can know whether gold stocks will or will not go down with other stocks at the current time. In my mind, I have seen examples of many different types of behaviour of gold stocks over the decades, and I do not try to interpret the “why” – because human perception is flawed. I will most likely think I “know” something and make a wrong decision in the future. I try to keep it simple. It comes back to point 1 and this constantly wrong perception or valuation of a stock, sector, commodity. Do you remember when Obama decided to release 60 million barrels of crude from reserves a few years back? WTI futures were down 8+% for a period of time…..all because 18 HOURS worth of crude oil usage was released into the market. 18 hours…..and the global supply of this material is suddenly worth almost 10% less than 5 minutes ago?
At the end of it all, we all have our own ways to see things, to make decisions – whether investing, debating, trading or believing in a god or evolution etc. . You have to take chances in life and take responsibility for your actions. Remember, prices go up because there is more buying interest than selling – i.e. that whatever the object is – it is still worth the asking price. As the price of one thing goes up and up and the other stays the same or falls…..you get closer to the point were the perception changes…usually fairly suddenly. If I see an Aventador at £100k and a Ford Focus at £15K I still want the former. If the price of the Aventador goes to £10 million and the price of the Ford goes to £8k, I will buy a Ford and so will many others. The price of the Ford goes up and the rest is what happens in every part of the market and world every day.
Apologies for the ramble.
J
Gold has been used as money for 1000s of years. It is a currency just like sea shells, large polished rocks, woven beads, carved sticks, or any other symbol of wealth that have societal belief. As a metal it is useful for its conductive properties, lack of corrosion, reflectivity (satellite coating). It also has value as jewelry and adornment in many cultures. Also, it has the appeal to the city investor who never gets to travel into the wild north or the Andes and gets some satisfaction from investing and studying about the miners (eg, viewership of reality TV shows about gold mining and people who never leave their apartment without a Louis Lamore novel; it is kind of a vicarious camping adventure).
It is worth as much per ounce as people are willing and able to afford and given mining costs which include capex, management, taxes, land management, environment and local land owner issues it could be argued that the current market price is about the sustainable price for ongoing supply being provided by existing and prospective mines (this could be untrue if a game changing tech like what fracking did to natural gas). Given the rapid and seemingly unprecedented tech advances in materials in the last decade it could well be that most non monetary, non jewelry uses for gold could decline much the way silver usage in photography was with electronic images.
My only interest in this sector is that historically it moves up dramatically every 10 to 20 years with 5 to 10 fold equity appreciation. This requires that the investor is an excellent trader and has a thorough knowledge of the sector so as to acquire the better miners. It has proved a good place for me to start investing because it has a lot of volatility and many commentators who apply tech analysis to it. It cost me dearly last year when it declined dramatically. Have learned from the experience and will only invest there with a proven strategy that has a “no loss greater that x percent” built into it. Thanks for all of the valuable posts on this site, and with a prudent combination of technical analysis and solunar/astro/gravitional/electromagnetic approach I am confident that success is guaranteed.
To reconcile the Vinnie side which says trade the market price as it is both up and down, the Elvis whip cream gas inspired technical swing trading, and the more long term approach I would say that each has value. My tech. right now is to trade short term moves in the market both up and down with the instrument chosen based upon the condition of the seasonals, solunar, and other useful indicators.
The U.S. dollar, the Euro, and the Yen, to name just three unbacked pieces of paper we use today on this planet to transact business, are NOT money. They are counterfeit. They are a fraud. Gold became money not because people think it’s pretty, and it has nothing in common with the other things you mentioned, such as seashells and woven beads. It did NOT become money because of “societal belief”.
Aristotle first described the five characteristics a good money should have: It must be 1) convenient, 2) consistent, 3) durable, 4) divisible, and 5) have value in and of itself (intrinsic value). Gold simply fits this correct definition of what a good money should be better than any other element on Earth, with silver being a close second, which is why gold and silver came to be used as money.
What most people regard as money today, things like the aforementioned U.S. dollar, Euro, and Yen, have no intrinsic value at all. That is why their value is continually falling, giving us something we should never have when we use a stable monetary unit (such as gold): inflation.
Inflation is the primary symptom of the destruction of the value of paper money. Inflation is NOT necessary for economic growth. In fact, it is anathema to economic growth. If we were still using gold as money today, the prices of goods and services would NOT be going up. The prices of goods and services go up because central banks are printing trillions of new currency units every year, thus massively devaluing each unit in existence. That can only occur when the monetary unit in question is fraudulent paper (or plastic) money, which is not backed by anything tangible and can thus being created at the whim of central bankers, in any amount they so desire. (98.5% of the currency we use today does not exist as physical bills or coins, so the trillions of new currency units they create each year do not even have to be printed. They are merely computer entries.)
The current monetary system is a Ponzi scheme, and as such its collapse is inevitable. I believe by 2022 everyone will be well aware of that fact, since a new monetary system will have already been established.
P.S. — Gold and silver are currently very, very cheap.
thanks for your thorough reply.
just because something is oversold (relative to what?) or noone wants something does not mean it absolutely has to go up. crashes happen from oversold conditions after all, also bear markets are healthy and can last long time especially after such fantastic gains that we enjoyed since late 90’s.
i get your point about everyone not wanting this asset, and it could be a good contrary play perhaps, with very limited amount of risk. But in the current environment, with the prevailing trend pointing we know where, i am just trying to understand what would stop #1 or #2 from playing out.
There is some history of gold stocks being a contra-play to general stocks–but history doesn’t offer guarantees.
You’re right, of course, that bear markets are healthy and can last a long time. The cyclical bear market (within the secular bull market) in the precious metals that we’ve seen since 2011 has been deep and cleansing. Now we’ve reached the point where sentiment in the sector is rock bottom, which is always a good time to be taking a hard look at the specific asset in question.
Believe me, I’m not married to any single asset class. I don’t for a second believe that gold is some kind of mystical talisman and everything else is crap. Gold became money because of its utility, simple as that, not because of some dubious magical relationship with the universe. But gold and silver are actual, real money, with no associated counterparty risk. In that way, they are unique in the world. Everything else we use as money today comes standard with built-in counterparty risks that few people understand. Do YOU want to own the currency of a bankrupt and corrupt government that enforces the use of that currency, essentially, at the barrel of a gun? I sure don’t. History shows that unbacked paper money always reaches its intrinsic value — zero. (Voltaire was the first I’m aware of to accurately describe this phenomenon, in 1729.)
Since 2001, for mathematical reasons, we have been in a secular precious metals bull market. That doesn’t mean that cyclical bear markets within secular bull markets can’t be deep and difficult to navigate, as I mentioned before, but we have to understand that we’re still in a secular precious metals bull. I know it may sound far-fetched, but the reason for that is the current financial system is reaching its mathematical endpoint. That is what Jeff at Greedometer.com is actually seeing when he talks about the exponential decay in the time between stock market crashes he discovered is occurring. Stock market crashes are symptoms of a much larger, underlying problem. They can be altered, warped out of their natural, fractal rhythm, but only for so long. We are now reaching the point where those who manipulate the system (and believe me, they do it very well) are losing their ability to continue to do so.
Part of what they do, to instill continued confidence in the stock market, the bond market, and unbacked paper money, is to continually suppress the prices of the precious metals, which are the only real money extant. People argue that they’re doing a lousy job of suppressing precious metals prices, since the price of gold, for example, has gone from $255 an ounce in 2001 to $1,200 an ounce today. But you can only manipulate the price of an asset in the direction it wishes to go, based on the underlying math, and that is what they’re doing.
I understand the price suppression mechanism very well, and a price rise from $255 an ounce to $1,200 an ounce over 13+ years is nothing. Yes, it’s the correct direction the gold prices want to be going, but the magnitude of the price rise is being powerfully managed, capped by some extremely creative sleight of hand. The price rise we’re going to see over the next 6-7 years, from $1,200 an ounce going forward, will absolutely dwarf the price rise we’ve seen over the past 13 years. And it’s quite possible that it doesn’t take that long for the price to normalize (meaning to reach the level where its price effectively balances worldwide debt levels). I find it likely that we have an exogenous event that causes the spectacular stock market crash that John has been predicting (he’s absolutely right, but the timing of these things is always tricky) and, concomitantly, an explosion in gold and silver prices that will make the uninitiated shake their heads in disbelief.
My specialty is monetary theory, so I understand very well what I’m talking about, but being a specialist in monetary theory only aids and abets what I do in the financial markets. In and of itself, it isn’t sufficient to make real money. My specific path has been calling market tops (I did so accurately with the financial stocks in late 2007, for example) and judiciously shorting the overvalued asset, and by being a specialist in the junior mining sector, specifically the gold and silver juniors. The precious metals juniors are the toughest, wildest sector you can possibly speculate in, but I’ve learned a lot over the years. My ability to navigate the sector allowed me to retire young, and I haven’t had a normal job in many years. Played properly, the sector can do the same for anyone.
All I can tell you is that I’ve never seen quality gold and silver mining companies selling at more depressed valuations than they were earlier this month. Could they get cheaper still? You bet they can. Am I waiting for that to occur? No way. The technicals and sentiment are looking more and more bullish for the precious metals and their related stocks and more and more bearish for the stock market, WHEN you know where to look. John does, and so do I.
Again thanks for the thorough reply.
Gold silver options are expiring soon (2 days). This bounce is very convenient to let the puts below 1180 to expire worthless. We shall see soon if the bear has any legs left.
IF miners are leading the way then they are at the 2008 bottom levels. gold and silver are not at those levels still. this tells me phys prices are about to catch up downstairs.
Stock market explodes to the upside while PM’s tank. Thats when i buy very small amount of quality miners for a speculative long term play.
last active upside pattern in $/Y completes around 118.3 (inclining triangle with base at 117). Else have a 2-4 wave elliott wave long term channel from the 2011 low putting the end of the fifth wave at around 118.
ES in keeping with its megaphone pattern since July has a major correction approx. every 2 months. 1 month down 1 month up. Rolling into that time window again.
GEM hourly forecast update – not as sure on the velocity times but the general pattern of up to 9:00 est hour (consolidation on either side of it) to down to close is expected. https://twitter.com/mjmateer/media
Whilst I agree with some of what D.J. writes, his reply relating to gold specifically is something that mirrors what economists and to a certain extent mainstream media is telling us. It is this “narrative” that I do not like which I feel stands in the way of keeping an open mind and reinforces certain misconceptions. Perhaps a point of discussion for another time.
To Big Tuna, the way that you ask your question suggests that you have already made up your mind as to what you feel will happen. I would like to see if you could provide some context as to why you are asking in that case because I think that my answer is too obtuse.
Are you looking to invest in gold miner equities? Or physical gold?
J
In fairness to you, J, I don’t watch television or read newspapers, so what the mainstream media says about this subject is something I wouldn’t know anything about, but I can tell you that most economists know absolutely nothing about monetary theory, so their opinion on things like gold is one I wouldn’t put much stock in. As far as I know, most economists view gold as an anachronism and far too “risky” to invest in (since they don’t understand it).
I hope my reply to Big Tuna sheds further light on how I view things.
i like to hear what others have to say during critical market moves. especially such as these that happen only once or twice per generation.
As I write this the Euro has fallen back to 125. On Daily charts this is not important but on Weekly charts this is important especially given the time of the Week. Last Week the Euro rallied and so far this week it has also rallied. Should the Euro find support at 125 this Thursday points to the potential for a significant two day rally that will end the second week of an ongoing weekly rally. Thus the next two days could see a strong rally in the Euro –and– a fall in US Stocks given the current intermarket relationships.
Yes no doubt in my mind John that major US indices are topping and that we have predominantly already entered a bear market for the majority of stocks.. Reminds me of that quote:
“Nobody rings a bell at the top”
The bad news out of Europe this morning has resulted in the Euro falling back to the 125 handle. That price looks to have held and the Euro is rallying. If so, then an intense Short Covering Rally in the Euro may be underway that lasts into late next week. This negative European news, with support at 125, points to an over sold Euro in this time frame. Given the current intermarket relationships means that an intense Profit Taking Decline in US stocks could also be underway. I do think that an Intermediate Swing lower in US stocks has begun that could be larger than normal given that the short covering rally in the Euro could be intense, but, that is all that I think is happening. I am still looking for “the top” in major US stock indexes to occur in the first half of January. However, I could be wrong and “the top” might be in….
You’re all over this, John. Many thanks for all that you do. I view your work is an invaluable asset.
Weaker HSBC China data, and Eurozone output
figures lower than expected (what a surprise, not).
Miners selling off hard.
The only longer term hope for much of the Eurozone
is a significantly weaker Euro.
At least the UK avoided that complete and utter fiasco
by not joining the single currency.
They don’t need hope.
The ECB will QE into gold.
Problems solved.
Sovereigns may default.
Economic activity will be lower. That’s reality.
Ordo liberalism.
It’s mankind’s best hope.
Allan, For Whom The Bell Tolls, is more poetic.
Hello for the beginners out there like me …
This guy has some nice fibs on the Dow and nice explanation ….
http://tinyurl.com/kfhtpc4
This was done Australian time yesterday..
important reversal day today?
stat of the day: SPY have not closed near/at the lows since Oct 22. will today be different? reminds me of roulette betting on red after black 20 times in a row.
USDJPY potentially shooting star candle in the making. blow off top?
that will weigh on risk sentiment.
It depends on what you define as a reversal.
There is a huge difference between a 2-4% pullback
before a strong run to year end, and the waterfall type falls
towards 1800 SPX as referenced by some.
Jegersmart and Betafish. A well articulated and eloquent narrative from each of you on the jist of a complicated subject. In the final analysis currency is not money.
http://blog.milesfranklin.com/gold-is-money-everything-else-is-credit-jp-morgan
Good article, eclectic. While I do believe that eventually we will have to have a new financial system, I’m no longer convinced the transition to that system will necessarily be a catastrophic one. I believe either one of two things will happen: a) those who control the central banks will continue to create unbacked paper currency units until we have worldwide hyperinflation, which would of course be horrific, or b) someone, possibly a group of countries including China and Russia, will have to back their paper currencies with something tangible, most likely gold. In that case, the U.S. dollar and dollar-based assets would suffer a massive drop in relative value, but we might not have a worldwide financial conflagration. The latter scenario is my preferred scenario, for obvious reasons.
Any thoughts that bitcoin is gov’t testing for a future new currency?
posting activity coming to a low here – sign of a top? everyone has given up!!!
megaphone hit and test in $/Y overnight – lower megaphone support 107.75 currently. Aligns with Elvis targets on ES.
after 10 days consecutively grinding higher on the day, i think we learned to wait for markets to trade for few hours or the close before coming to conclusions. huge support looms at 2028, and after a bounce we will form a H&S before the collapse finally comes. i don’t think there will be hard feelings to miss the top tick or few ES points
Instead of focusing on American Stocks being overbought it might be better in this time period to be focusing on the US Dollar being overbought and the currencies being oversold. Should an intense short covering rally break out in the currencies along with a profit taking decline in American stocks then a rally in Gold that “takes on a life of its own” may be starting as well. But none-the-less I don’t think that the top in US Stock indexes is in nor the bottom in Gold.
FX looks to be the key – 88 looks like a hard stop for $ index (multi year resistance) – gold and silver strong reversal day last Friday and $/Y today seem to confirm intermediate change in trend here
rising wedge reentry at 117.80 for $/Y – completes bearish overthrow – 75.6 to 119 move looks complete – expect ES to accelerate down upon re-entry.
Two news events should have sent the Euro to new lows but haven’t. The one news event was European and the other American (new claims). Both times the Euro was tested at 125 but held. This is rare but extremely important as it shows that the Euro is greatly over sold and the US Dollar is greatly over bought. This is a rare time for Small Specs to make some good but easy money for several days and end up being larger Small Specs at the end. Warning: Any Small Specs who are trying to use the highly leveraged futures markets to make their fortune should realize the most Small Specs fail because they have both eyes on the physical instead of one eye on the physical and the other eye on the US Dollar index futures.
wedge reentry around 117.53 – dividing line between bearish and bullish
Looks like you are correct. The daily December US Dollar index futures only closed above 88 twice in the past eleven days. Otherwise it has been trading sideways just beneath 88. Someone who has the capacity should post a chart of the US Dollar index showing that resistance along with over bought readings such as COT. I think the “action” is currently in the Currencies and secondarily in American stocks.
Pegasus, the answer to your question is price
action will confirm.
Anything before this is probabilities, estimation
and essentially guesswork.
Some prefer to term their methods as a system,
usually TA based, but it’s a bit like the Wizard of Oz,
there is nothing all powerful behind the curtain.
If there was you would amass wealth beyond your
wildest dreams within weeks.
We are all just estimating/guessing.
The difference being that some of us are aware of this.
crystal ball….
God knows for 20 days, you’ve been clambering about a pullback and you’re getting a small one so enjoy it. Here’s a bone for you. At 1:30PM EST Fed Pres Mester speaks and his is very hawkish, this will help your case, so be aware and trade the sudden drop if it happens. Don’t get too happy unless you close below SPX 2030.
appreciated
head and shoulders in $/Y on s-t – base 118 – targets 117 – bearish patterns mounting
Betafish and BBE
Thanks for your references to Zardoz. I was totally unaware of this movie. I will check it out.
I was referring to VAAL from the original Star Trek series.
The uninformed natives kept feeding a machine that controlled everything.
i liken it to the sheeple continuing to use fiat and feeding the ptb.
http://en.memory-alpha.org/wiki/Vaal
thought of that later – no vaal in Zardoz
but Connery wears a really great wig!
Why are you so intent on throwing shade on a film icon. Connery is the man!
BTFD!!! Easy peasy. Free money.
http://stockcharts.com/h-sc/ui?s=$NYUD&p=D&st=2014-06-23&en=today&id=t06652107982&a=367854604&r=1416496934473&cmd=print
Powerful reversal is that holds.
SPX above 2050 again atm.
Any dips being bought back continues.
calm before the tempest
Thats right Phil. ANY dips. No central bank will allow it to fall. How many times until you all accept this.
Peak belief in central banks by retail
Well… your pullback lasted 23 minutes. Philly Fed report was historic, and there goes any chance of a pullback now. When will you all give up?…..
I agree: If you just look large caps and nothing else, the price action is strong. Under the hood, things are really weak: http://goo.gl/b56jof
Maybe at SPX 2150, you will get a 2-3% pullback.
last week gold silver reversal, this week Yen reversal, stocks next hahahaha
stocks next? An you laugh? You’re getting slaughtered, another new high on the Dow today. Money pouring in crushing any dips.
vinnie, it continues, with some volatility,
until the perception that the US business cycle
is about to roll over.
Once it does and earnings begin to compress
no amount of FED intervention will prevent a rapid
equity de-rating.
Backend of Q2 2015 is most likely near the
peak, that’s how it looks to me atm, but staying
openminded is often the safest option.
I love that term, “equity de-rating”, BTW… 🙂
You might be right, but just curious… Why Q2 of next year?
Why not now? Or why not 2 years from now?
I have no idea either way, but just following my trading signals either way….
And for all I know, I could be in a losing trade here…
So far in this trade, just watching money slosh into my account one day, and sloshing out the next…
That said, it’s still on (and again, unless something drastic happens to the upside, it will be here for a bit) a sell signal, so that’s where I am…
As you said, trying to be open-minded about all possibilities here…
Thanks for your thoughts, Phil….
And just a thought….
I’m not a “fundamentals” guy, but…..
Assuming the US stock market actually reflects the US business cycle (debatable at this point), if the US business cycle is about to roll over – call it Q2 of 2015 – and the US stock market usually anticipates that by 4-6-8 months – which I believe makes sense, wouldn’t that be about………~now~??
Just thinking out-loud, and would appreciate your thoughts….
Thanks…
OK, mid 2015, I’ll buy that thesis. BUT…. this board since Nov 4th, calls for daily pullbacks, that NEVER happen. They REFUSE to accept that endless amounts of money control the rally.
http://stockcharts.com/h-sc/ui?s=XRT&p=D&yr=0&mn=5&dy=0&id=p59817489177&a=370502282&r=1416502392693&cmd=print
wow – someone wants a Santa breakout
bonds and retail cant both be right
and the cycles here are powerful and finishing up
http://stockcharts.com/h-sc/ui?s=$NYUD&p=D&st=2014-06-23&en=today&id=t99582887766&a=367854604&r=1416498453967&cmd=print
VO T ends today and the Money Flow T ends Monday
http://stockcharts.com/h-sc/ui?s=$SPX&p=D&yr=0&mn=4&dy=0&id=p78274573543&a=368144488&r=1416503132897&cmd=print
Wasn’t there a false retail break out in aug/sep as well? a day or two more just like you said Yesterday.
this is how I’ll answer BS (You might want to get new initials! LOL!!!):
STAY LONG PHIL!!!!!!!!!!!!!!!!!!!!!!!!!!!!!!!!!!!!!!!!!!!!
BBE,
I actually agree with you. I meant that retail tried to breakout in September. It was a false breakout. I think we should be close. I am not Phil.
I was just using irony – I know you agree with me BS! thanks
My answer to everything on this blog now is:
STAY LONG PHIL!!!!!!!!!!!!!!!!!!!!!!!!!!!!!!!!!!!!!!!!!!!!!!!!!!!!!!!!!!!!!!!!!!!!!!!!!!!!
DJ, I respect your ability to have made money in the markets and thank you for sharing your insight into the gold miner sector. The subject I would like to address is that “gold is a barbarous relic” and this time it is different. The reason sea shells, large polished rocks, carved sticks, woven beads had utility as currency in times past was that they were rare ( only certain sea shells, rocks, sticks or beads; prepared by skilled weavers or craftspeople ) and readily identifiable by all members of the society who respected them as money. In the age of tech when tech savvy youths around the world are enamored with virtual world as much or more as they are the other one, it seems like bitcoin or something similar will appeal to them a lot more than physical gold or silver. There are some youtube videos offering young people an ounce of gold or a bitcoin of equal value and most chose the virtual currency. Also, what if a game changing tech innov. such as fracking did to nat gas arises and makes the avail of AG and AU more than today. Combine under 40 people being mostly interested in all things tech and virtual (there is a reason the gold and silver dealers only advertise in media for people in their golden years-Smithsonian Magazine, Fox News, etc.), and the fact that with robotics, new energy applications, better methods of excavation, etc. the cost of mining may be drastically reduced. So this time it may be different.
Wanna bet when the truth is discovered about what really makes up those bond funds that average folks (whatever age) are heavily invested in, and then truth meets up with redemption requests in a mutual fund industry that embraces “liquidity”, there might be some more than passing interest in relics. Or maybe just cyber wheelbarrows?
Barry,
Why not now? – that’s easier the answer.
The latest US Q earnings were with some exceptions very solid,
mean earnings increased nicely.
Outlooks are too strong to suggest an immediate turn.
Why Q2/Q3 2015 may be the peak, or very close to it.
That view is based on growing global growth headwinds,
combined with a stronger $.
Much of the Euro area is near recession, Russia, Brazil,
much of the Far East slowing, this will ultimately begin to
impact, and that is my best estimation of when this begins
to hit mean earnings.
The uber bulls see the current US cycle lasting another
2/3 years, while that is possible it also looks unrealistic.
The miscalculation that many bears have made is not
paying more attention to earnings – even allowing for
reduced expectations and multiple expansion.
Multiple expansion has been hugely helped by ZIRP,
and although QE has ended, ZIRP has not.
You can still have significant sell offs while the cycle
remains supportive, John’s minimum target of an 18%
decline could still have happened within a bull market.
With seasonality and the year end looming large that
now looks increasingly unlikely in 2014.
But for a new bear market, the perception needs to be
that the earnings cycle is about to turn.
I gave KGF, the UK listed home improvement retailer
as an example of a bear market in microcosm
caused as earnings expectations turned decisively
lower, KGF has large Eurozone exposure.
If subsequent data suggests a different outcome
then my view changes, that’s how I see it atm.
As mentioned previously a rapid sell off here would
really benefit me with current cash holdings,
but you can’t always get what you want,
as the song goes.
earnings have been a complete fiction from start to finish since 2000
from how they have been reported and calculated to creating higher earnings through debt driven buybacks
Hussman has written well and extensively on this.
So I say again:
STAY LONG PHIL!!!!!!!!!!!!!!!!!!!!!!!!!!!!!!!!!!!!!!!!!!!!!!!!!!!!!!!!!!!!!!!!!!!!!!!!!!!!!!!!!!
BBE, Phil has repeated said he’s ~not~ long, he’s in cash….
Nothing wrong with that, and I would say that if shorting is not someone’s style, then being in cash right now makes complete sense….
STAY LONG PHIL!!!!!!!!!!!!!!!!!!!!!!!!!!!!!!!!!!!!!!!!!!!!!!!!!!!!!!!!!!!!!!!!!!!!!!!!!!
LOL!
Thank you for your response…
All good points, Phil, and I appreciate the time it took to write that….
FWIW (to anyone), I’m not looking for a crash, or bear market or anything like that… I’m short because the probabilities – to me – look like being short is the way to be in the immediate future…
No special insight or price targets, just short until my trading system says be long…
At some point it will – at either higher or lower prices – and then I will reverse and go long…
I’m ~not~ making a market call, I’m trading a system, that’s worked pretty well in the past, but it does NOT pick the exact top, or bottom, and it has losses along the way too…
For those expecting top tick calls, or bottom tick calls, good luck with that…
They won’t be coming from me, but I’m sure you’ll find plenty of people willing to tell you they can, for a price….
Just trying to be clear here….
elvis,
like the great man himself who’s name you use,
I imagine you a little like Elvis towards the end of his
career, in those final concerts.
I trade individual shares only and do not go long
an index.
There are currently all of 2 LSE listed UKX constituents
that I may consider buying following recent price falls,
RMG and CNA, that’s it.
Sentiment on those companies is dire, but longer term
I like the risk/reward ratio, currently I hold neither.
So then:
STAY LONG PHIL!!!!!!!!!!!!!!!!!!!!!!!!!!!!!!!!!!!!!!!!!!!!!!!!!!!!!!!!!!!!!!!!!!!!!!!!!!!!!!!!!!!
$/Y and E/Y nice reversal candles on daily
Elvis should invest in the US co. CAG which makes Reddi-Wip.
I’M Ready!
Try applying some reasoning, rational and logic to
your views.
My cat Gump, not know for his intellect,
could press a button to churn out a tirade
of charts, meaningless imv.
you funny and your views remain unsupported wind
STAY LONG PHIL!!!!!!!!!!!!!!!!!!!!!!!!!!!!!!!!!!!!!!!!!!!!!!!!!!!!!!!!!!!!!!!!!!!!!!!!!!!!!!!!!!
China growth slowing, European growth similar but moreso. US growth in a mirage, best to just look around there. eg todays existing home sales be a downsizing cascade due to invisible mirage? Who knows and he not telling.
Antifreeze passed to fallout land under counter (not Geiger) Who knew and made a cookie. Because no one is ever corrupt then easy to believe all can fly from this highest building by flapping arms. All together now, Jump! Flap! Come back this way. See Strawberry Field Forever.
spx today might be 24th straight day above 8dma with %R>88%
only 4 times in history
short term top 100% of the time
so far…..
statisticians would say that a sample size of 4 is far too small to derive any conclusions.
how do you define “short term top”? How much of a correction needs to follow in order for the “top” definition to apply?
Sample size is history of stock market/24 day segments.
the sample size if 4. There were 4 instances of this configuration. yes, they all turned out to be short term tops, but a sample size of 4 is too small to be statistically significant. Doesn’t matter that you looked at 50 years of data, or 50 days of data, you’re still dealing with a sample size of 4. You’re drawing conclusions based on the 4 times you found this particular configuration.
typo: sample size “is” 4.
I get it now:
http://moneyweek.com/hugh-hendry-interview-part-1/
http://wolfstreet.com/2014/11/17/1-6-trillion-in-defaults-coming-legend-says/
Defaults and rising rates in bondland.
http://stockcharts.com/h-sc/ui?s=$SPX&p=D&st=2007-02-21&en=2007-10-15&id=t62106636486&a=375321856&r=1416512724093&cmd=print
07
http://stockcharts.com/h-sc/ui?s=$SPX&p=D&st=2014-03-31&en=2014-11-20&id=t62106636486&a=375321856&r=1416512724093&cmd=print
today
looking familiar Phil?
virtually identical wave counts
Funny you bring this up – $/y also back at its October 2007 candle adding to the analog
XRT looking perky,
signalling impending doom a couple of days ago
apparently.
AAPL looking strong.
CAN YOU READ PHIL OR ARE YOU JUST STOOPING TO plagiarizing MY PREVIOUS POST! ROFLMAO
banned by elvis
November 20, 2014
http://stockcharts.com/h-sc/ui?s=XRT&p=D&yr=0&mn=5&dy=0&id=p59817489177&a=370502282&r=1416502392693&cmd=print
wow – someone wants a Santa breakout
Reply
STAY LONG PHIL!!!!!!!!!!!!!!!!!!!!!!!!!!!!!!!!!!!!!!!!!!!!!!!!!!!!!!!!!!!!!!!!!!!!!!!!!!!!!!!!!!!!!!!!!!!!!!!!!!!!!!!!!!!!!!!!!!!!!!!!!!!!!!!!!!!!!!!!!!!!!!!!!!!!!!!!!!!!!!!!!!!!!!!!!!!!!!!!!!!!!!!!!!!!!!!!!!!!!!!!!!!!!!!!!!!!!!!!!!!!!!!!!!!!!!!!!!!!!!!!!!!!!!!!!!!!!!!!!!!!!!!!!!!!!!!!!!!!!!!!!!!!!!!!!!!!!!!!!!!!!!!!!!!!!
some quote systems show AAPL taking out that spike high on monday
others don’t
seems nothing matters
BBE – breathe man
friends don’t let friends serial post
READY WHIP! me no care
ban me again ELVIS!
I’d rather be irrational than suffer 2D lifeless fools…
…anywhere
or should I say:
STAY LONG PHIL!!!!!!!!!!!!!!!!!!!!!!!!!!!!!!!!!!!!!!!!!!!!!!!!!!!!!!!!!!!!!!!!!!!!!!!!!!!!!!!!!!!!!!!!!!!!!!!!!!!!!!!!!!!!!!!!!!!!!!!!!!!!!!!!!!!!!!!!!!!!!!!!!!!!!!!!!!!!!!!!!!!!!!!!!!!!!!!!!!!!!!!!!!!
I hope today just ends your misery in thinking a pullback is even possible, it’s not, and will never happen for quite a long time. Even the RUT ramped higher, all indexes getting bought with both hands, piles of cash pouring in.
THIS IS A MUST READ FOR EVERONE:
http://finance.yahoo.com/news/after-two-years—relentless-rally–needs-a-new-story-to-keep-it-going-195633145.html
DOW, SPX record closes, DJT less than 0.5%
from a new ATM.
RUT up over 1%.
On a day when futures were nicely lower.
It does not look bearish to me.
Any dips bought back.
SPX 1820 has to wait another day,
getting further away.
Are you finally giving in to the tape and not dreams of a pullback?
John, I dont know about others, but I find Elvis tedious and boring. Not only has he no idea, he has no manners either.
He does your site no favors and brings the down both the enjoyment and credibility of coming here.
I now tend only to visit at weekends when he/she/it is back wherever they belong and isn’t posting.
Richard, not sure that is saying anything
particularly ground breaking.
This looks late cycle price action and
ZIRP is a dominate factor in forcing people
to risk assets, and remain there.
Even on the most bullish assessments further
multiple growth is limited.
Very few would take issue with any of that.
What it does not address are reasons for
the eventual break down of the bull market,
that’s the interesting bit imv.
It doesn’t direct any reason for a decline but that there are no more sound reasons for a continued rally. Its like today’s action in the Euro. Four times the Euro was smacked down to 125 but each time it failed to break through. This doesn’t mean an immediate rally in the Euro but it does mean that no further negative news is going to result in the Euro selling off. So all that is needed is some positive news such as an important person flapping his lips in the wind and up will go the Euro in an intense and parabolic short covering rally. Its the same for the DOW. All that is needed, when there is no good reason to rally, is some negative reason/news that will set off profit taking. None-the-less, I am still looking for “the top” in the DOW in January just like in 2007 and for many of the same reasons. I am also looking for more than an 18% correction and more like what happened from 2007 to 2009.
The article is showing all the fundamental reasons why American stocks have rallied so much over the past several years. The article is not looking for reasons to crash but for new fundamental reasons to continue the rally. If new fundamental reasons to rally further do not arise then what? Permanent sideways trading? Obviously, the article brings out the fact that a continued strong rally is not likely unless new powerful fundamental reason(s) surface.
the fundamental reason is the one fundamental reason that always drives prices up: Cash coming into the market. Can anyone predict how much money will flow INTO the US stock market tomorrow, next week, next month, next year? If you can do that, you would know how much longer this market will continue going up.
Except the top in 2007 was near 3/2007 not January, and then we rallied for another half year in 2007. Am I missing your point?
FWIW, this is exactly what I would expect — the market should have topped 3 days ago about 1M from the October bottom. Because of Bradley, we now make a double top. The next few days will determine if this is a Bradley high or low. If it is Bradley market low — indeed possible like in 7/1929, we can rally through December where we will revisit at the next two Bradleys. If it is a Bradley market high, it would surprise most in the forums as no one is really long term bear anymore. This means those in cash will begin shorting as we cascade downwards. We probably start slow and build up downward momentum in 2015 in this case.
Not knowing or caring about Bradley anything, I can readily say, how would you call it a bottom in any sense of the market? It’s ridiculous. All indexes are at RSI’s of 70 even closing in on 80. There is no time in market history where RSI’s have been so high without a massive snapback down move. BUT… there has never been BofJ having 1T in paper to buy US stocks daily. So it’s a Mexican Standoff, leaning towards the bulls, as evidenced by DAILY new highs. Bradley Turn Dates seem like another dose of hopium for you all here.
Kinda wishing there was an “Ignore” feature here….
Regardless, Bradley ~ain’t~ part of MY system, dude….
Please don’t make ill-informed generalities….
But one last quick question… Based on your last few posts, you seem to think we’re never going down, because CB’s will never let it go down…
Yet, you are exactly ~zero~ percent long this market, for both yourself and for your brother… Is that my understanding??
And if that’s right, why all the bold talk of the market never going down, because that seems to indicate exactly ~zero~ percent faith in your own statements??
Hmmmm, as I eat dinner. You don’t read well. I ran a call position for my brother closed only days ago and psoted that here, for the simple reason of not being a pig, and it’s not my money to risk any further. Large gains are only that, if you close a position. Till then they are nothing but risk. Your crew belly ached for a pullback since nov 1st, jesus man, the Dow has risen about 360 points since then. My brother caught most of it, as 17,350 was iron clad support, easy to put him front month ATM. You try to sound like you know shit,but you don’t.
Never mind…. I won’t bother you any more…
I think the Dow and SPX can go up in paltry amounts that equal about 1% more. No reason to play with fire anymore for now, just enjoy a huge gain on an easy trade for him. I would be short when all the indexes are screaming 80, as they almost are, on the RSI, seems like a low risk money maker. Feel better now?
Let the market rally to crazy highs till year end, then the week of Jan 5th, 2015, Obama tells Yellen to stop the intervention to make the incoming republicans look bad with a huge market slide. Think that’s political fairytale? Then you’re naive.
This is an excellent forum… thanks to John and a number of other posters. However, please spare us the theatrics. Imagine if everyone acted that way.
yeah, and we all used CAPITAL LETTERS and LOTS of EXCLAMATION POINTS!!!!!!!
I agree, let’s stick to talking about the markets, the economy, the world, but leave the screaming and shouting out of it.
Good summary of the insanity right now John Li. I myself don’t know what direction this market is heading. At this point I am playing not to lose money by staying on the sidelines. No technical indicators or any EW counts can possibly explain the current bubble phase right now.
A quick note to myself… I think what vinnie, daveg, Phil and others are saying is correct. I’ve found it extremely hard to argue against your strong point, that this market potentially has no precedence, that it keeps chugging higher, that every dip has been bought back and the buying is real. The truth hurts bad though, and that might have explained the frustration on this board.
and so the statistics continue for another day. patience is king. 2050 continues to be a magnet in the ES, chances are we chop around tomorrow and then ramp higher into the close ahead of the New Moon on Saturday.
DV…….you know better. We ramp EVERY day near the close like clockwork.
Since 11/3 to today, a closing buying spree by Yellen and BofJ.
Moons mean squat. Astrology is for hippies not traders. I admitted several times here with RSI’s nearing 80 on indexes, you could break down like an elevator with a snapped cable. Not far though, money makes a nice safety net, BofJ has tons.
Hippies are people who think outside the box. That is a valuable intellectual trait. Left brain analysis is important but so it right brain creative thinking. If astro trading doesn’t work why did so many famous stock investors in the last hundred years use it. If you want to see if the moon works print a years chart of any equity market draw a line each month from full plus four to new plus four, you will observe that most of the gains happen during these 14 days, all time frames. Not every month but in total most of the gains. Vinnie, you are a valuable contributor to this board because you have a point of view and are articulate in your posts. Try the moon cycle not as a single strategy, but in conjunction with tech analysis you may find it useful.
vinniesj, i value all your posts and all the others. everyone has opinion which i respect. you are a pragmatic person, and you are voicing your opinion with that approach and try to keep us sanguine in our expectations, stay alive and make $ in this market in the face of CB interventions. as such i always appreciate your thoughts, i encourage you to keep you posting. i constantly remind myself as a trader i need to be cognizant of all those factors as well.
as for moon cycles, i take a statistical approach just like i do with technicals. one day i will get all moon cycle dates and cross reference with returns in SPX and other asset classes and show the results in tabular form with stats. but visually, we do see a high probability of a turn in new moons. John posted that chart before. it lacks explanation, but it’s just the way it is, and for the purpose of trading, i only care what are the factors that increase my likelihood of positive returns. and the factors i look at technicals, statistics, economic data releases, fed speaks, moon cycles, etc.. i look back historically given certain conditions, what is my expected profitability if i put a trade on.
Vinniesj,
“Moons mean squat.” And your view of planetary angles and speeds is what?
SC
actually the lunar cycle has an historical record that is something way beyond chance or coincidence. Just look at the historical record. It’s very easy to do. Before you dismiss something with your usual derisive condescending tone, it might make sense to find out whether what you’re dismissing is true or not. Just because you think it can’t be true or because you don’t know WHY it could be true doesn’t make it false.
Wall St firms would use it if it were legitimate, its just voodoo. BTW, good luck being short this morning.
Vinster, they could but would never tell cause it might seem silly or is it because it is good info. they don’t want to share?
minor correction coming….then onto new highs!
sorry john….u r wrong about a crash happening now….just look at the XRT…vertical rise coming!
lets see how Japanese retail takes to the reversal candles in the Yen – on the margin this will be driving ES
Another BTFD today. Since I have converted to this new religion, I am a happy person, no need to find reasons to justify a top is in, indeed as I start practicing BTFD around late Oct, I make back all the losses on my shorts…. Hail the Fed and all CBs around the world who is going to QE us to global collapse. I’ll be long and gone by then. (This is a joke!)
I have no intention of discussing politics unless it effects the markets. I am of the opinion that a similar “class” of people who bought autos, phones, stocks, and put the Republicans in offices in the 1920s are the similar “class” who caused the recent and rare V market in stocks that caught John Hampson off guard and put the greatest number of Republicans in office since the 1920s recently afterwards. That same “class” of people may now seek to punish Obama by taking profits in their stocks that results in another V market sell off and rally back up. In other words, Obama just made that “class” of people FEARFULL and FEAR results in stock selling.
the tempest begins – Japanese retail starts to panic
I just took a look at Yen futures and it appears that the Yen just took off with the end of Obama’s speech. This implies that the Japanese understand what I have been posting about concerning a “class” of people better than most on this blog do. While many on this blog continue to moan and groan about the rally in stocks I have sought for a reason why that “fits” with the recent American election results.
great analysis
That “class” of People may be more groupish then they were when they bid stocks up in that rare V market rally. Because their “group” won the elections they are extremely hopeful which is “why” no major sell off has yet to occur. But, Obama may have just made them more groupish (defensive) then ever before and FEARFUL which means that a more unified “class” could sell off stocks about as hard as they recently bid those stocks up. Obama just attacked and insulted that “class” of People which may cause them to turn inward and act more groupish than they have done so far. This may result in a stock sell off that is not expected at this time especially if the US Dollar declines due to historical resistance and extreme over bought sentiments.
The Japanese, who are very, very groupish, may quickly understand these particular facts and acted immediately on them in the currency markets as Obama’s insulting speech ended.
Gold rhymes with old, mold, cold, bold, scold, sold.
Fiat rhymes with nothing I can think of. Therefore,
fiat wins because of the lack of negative rhyming
adjectives.
Let’s put it this way: As it concerns US Stocks due to Obama’s speech; the Manure just hit the Fan.
great insights – thanks!
I just took the plunge. I just put my money where my mouth is. As of this evening I am short DOW futures.
I have positioned for an intermediate swing lower that could be larger then normal and it is possible, though I don’t hold it to be so, that “the top” is in.
I am looking for, and trading for, yet another V pattern bottom that will rally back up to new all time highs by early January though it is possible that “the top” is in.
Just read the GMO letter, and it seems you have a point regarding 2006-2007, being presidential year 3 and all. Again, the short term peak was 3/2007. not 1/2007.
Har, har, har; I doze off and who would have thunk that not one but two CBs would have flapped their lips in the wind while a third unexpectedly acted. Looks to me like they all had a meeting and decided to act to try to control the American “class” that will most likely act severely to Obama’s speech. I am now looking for a Key Outside Reversal day bar and possible a down weekly bar for major US stock indexes. The CBs have just given that American “class” an unexpected opportunity to sell out at higher prices. Today will be a most interesting day in stock trading in America as the close may see heavy selling instead of buying.
Spiral forecast for tomorrow. A low is expected during the weekend – either Friday close or Sunday open. https://twitter.com/mjmateer/media
I guess the million dollar question is if the GEM forecast low (for that time on that day) has any indication of it being a higher or lower low than the previous day? Because a Sunday open “low” is useless if it is a big gap up open unless you try to day trade it for a few points up.
yes agree. that’s where trading decisions based on whatever tools you use come into play. The Spiral has a longer term ebb and flow as well. Here’s a link https://www.facebook.com/186938551317676/photos/pb.186938551317676.-2207520000.1416583345./830730510271807/?type=3&theater
Here’s one way of looking at the 7442 Analytics Spiral data – boxing the 45* corners and the horizons. https://twitter.com/mjmateer/media
Richard,
in terms of the article
surely then the salient point is that SPX
mean earnings are still rising,
that is what is happening.
Given that is the case,
I am looking for analysis of
when and how the US business
cycle ultimately rolls over.
That is the key to unlocking the next
bear market.
No, you have to analyse the perception/sentiment of the market. The market is always wrong in terms of true valuation – it has nothing to do with fundamentals or “reality”. We swing from over to undervaluation every day, week and year.
The narrative that media gives us – Bloomberg : “stock market gains on strong earnings” – as an example – is just an unceasing barrage of misinformation that hits us every day until we star to believe it. Bloomberg is not doing this deliberately you understand, at least not in my view, but the human need to narrate is very strong – especially in this culture. The headline should read “Stocks gain on more buyers than sellers” or something to that effect, but journalists feel the need to provide a narrative. It is these types of narratives along with fear and greed and many other emotions that cause these over and undervaluations all the time.
If you look at earnings in detail, yes they are quite strong and so they should be in a ZIRP environment. If you look at investment in most companies it is at a multi-year low. Buy backs are at more or less ATH. If you were rational, you would temper your enthusiasm because you know there is probably very big trouble coming in the next few years. But the market is not rational, we see that every day.
Instead of analysing numbers, earnings and so on, have a look at the market reaction instead. Japan GDP down 1.6% despite massive QE, very short sharp drop, but after that it was like everyone just forgot. That is bull market sentiment. Horrendous news, no one gives a sh*t.
As per earlier posts though, this sentiment/perception can change very quickly.
J
John, thank you for your hard work.
1) PRO major stock market low: GOLD to SILVER ratio:
http://stockcharts.com/h-sc/ui?s=$GOLD:$SILVER&p=D&yr=20&mn=11&dy=30&id=p73145336618&a=272811819
2) CONTRA major stock market low: CRB/SPX500 ratio:
http://stockcharts.com/h-sc/ui?s=$CRB:$SPX&p=W&yr=20&mn=1&dy=0&id=p05265261746&a=260582884
John your view supports that one of the last unmanipulated stock market (e.g. no central bank interventions) is already in a bear market:
https://www.tradingview.com/v/g632PENV/
29 October 2014: “And I also make SPX 2065 the natural top of a Fibonacci sequence (666-996-1201-1366-1531-1736-2065). The penultimate level, 1736, was perfectly backtested during early February 2014”.
Now we’re almost there, the question is what happens now? A correction is a distinct possibility, to give the bears enough hope to cling on, before this US stocks bubble really goes parabolic (probably above SPX 3000 in the next 9 to 18 months). Fuelled by scared money moving out of bank accounts.
I’m not shure whether bears need a correction to cling on. Judging from the comments on this site a shallow pullback should do the job very nicely.
For the lunatics only:
Wednesday the node turned retrograde and the moon was conjunct the node. This created an inversion and turned the trend up.
This must be another cycle. Retro conjunctions are a special breed of events.
Cheers,
André
Duly noded.
jegersmart, I agree with a lot of that.
I have made the point that you
can have rapid sentiment swings within a
supportive cycle – John’s waterfall decline
minimum target of 18% can still occur within
a bull market.
Where I disagree is that for a new bear market
(a 20% plus decline lasting a minimum of 3 months)
you need mean earnings to roll over, or the perception
that this will happen.
Draghi jawboning again. Day still young but megaphone under threat in ES. Pegasus, thoughts? Wondering if we should fade this during US hours
Possibly, although in my experience the market doesn’t reflect reality or even a consistent view of foresight or hindsight either necessarily.
jegersmart, so how does the above statement inform
your trading/investing?.
Closed out of dow longs with a nice profit. Waiting cash now. Don’t care if I miss another 10% rise but I expect a small pullback before I can go back long.
China cuts rates.
Looks like they are gearing up for big
stimulus, taking the baton from the FED.
With these sort of moves the bull market can continue well into 2015. This money printing experiment will end horribly but there are still some bazookas the central banks haven’t used yet so may be some time.
Dear John,
Again compliments to the creator, great analysis and website and intriguing blog & contributions.
All the noise and debates aside, the markets appear to be sort of “meandering sideways/marginally higher….potential exhaustion if you will. I still concur with your bear case.
Kind regards
Al
Phil
The above views affect my investing (i.e. longer term positions) more than short term trading but is for me also useful in both. In trading I use TA mainly, with a twist of sentiment check on the side. The need to take profits regularly for a living means I trade a mixture of long and short positions across multiple markets. Over time, I realised that whilst it dilutes my exposure to any one thing in terms of risk it also benefits me psychologically to pretty much always have some positions in the black, whether the overall positions are up or down……a weird character trait possibly?
J
Appreciate the reply.
In my own trading/investing I look for stocks
where sentiment has become so dire that risk/reward
looks favourable – providing there is a fundamentally
sound business still.
FCF is my favoured valuation metric.
“we would step up the pressure and broaden even more the channels through which we INTERVENE” ……..Mario Draghi
So there you have it. Admission from from a Central Banker that they don’t provide stimulus per se, but that they directly intervene to MANIUPLATE markets higher.
Let’s be quite clear of the difference here. Stimulus is providing liquidity, intervention is using that liquidity to DIRECTLY move a market in a particular direction, in this case obviously UP!
There are no free markets anymore. This has become nothing but a rigged illusion of free markets and it is comletely illegal.
I have said it many times on here……THE MARKETS ARE BROKEN!!! They no longer reflect true risk, they no longer reflect true value and most of all they are no longer a function of a healthy functioning and free market economy..
And that is one reason why I ceased trading futures in 2011 following the MF Global collapse.
The whole scheme sickens me and whilst it was never perfect it has now detioriated into nothing but a cess pool of greed and corruption where so long as you are maing money it’s OK to turn a blind eye to it all.
Unless a major “class” turns against them and, thus, exposes the fact that they have no cloths. It was the best of times and the worst of times….
Allan
Totally agree, the question is why manipulate stocks higher for example? This only benefits banks and a very small minority of people…..
Could it be because banks are allowed to post their own stock as Tier 1 capital? I know that several banks are technically insolvent in Europe and UK from contacts within those banks….
J
jegersmart, stocks are the only game left, there is nothing more. The stock market has been used by Central Bankers to create the illusion that the economy is n the mend, even though this has been the worst post recession recovery in living memory. Wages have not grown, organic growth has not returned. Businesses are not investing and deflation is taking hold.
The stock market is all they have left and so they use it to maintain confidence and buy time in hope that the things I mentioned above will return.
Unfortunately they forgot to factor in one very important human trait……….GREED!
All those points mentioned above have taken a second place to greed. Central bank policy has removed the need for entrepreneurial skills or hard work or imaginative thinking.
Easy money has made the majority of us lazy non-thinking slobs. It is as simple as that!
Wait until it falls apart and the majority won’t have the skills to deal with a crisis.
Har, har, har; the CBs are now “three sheets to the wind” (falling down drunk with their power).
The smartest money on this earth are going to take advantage of this and unload. I have raise the odds that “the top” has come in to it coming in early January to 50/50. I had been looking for the smartest money to change their positions in early January due to their outlook on Quartly and Yearly bar charts like they did in 2007 but all that has changed with the CBs acting in concert behind Obama’s speech. Game Over.
I really do not see how this can be considered
sideways action.
Unless something alters dramatically in the next 3 hrs,
US markets are going to make multiple new highs.
Allan
I find it hard to believe that CB’s would only use taxpayers money to pump up stock markets which only benefits the top 10% at best with their own tax money……there must be more to it than that…..which is why I mention that many banks are screwed…..
J
Mate there is no doubt that the banks are screwed. Liquidity post 2008 has not recovered to pre 2008 levels and many banks are battling to stay solvent.
And that is why the stock market has become so crucial. If it tanks major parts of the banking system will be shown up as being insolvent.
Off to bed mate, I can’t watch this tonight even though I am not short. I think the chances are increasing of a post Thanksgiving crash with this push higher.
Pretty much 100% of investors are now convinced of the Decennial and Presidential cycle effects which increases the risk of it failing, especially if we blow off from here in the next week or so.
Cheers.
Do not underestimate what is going on: Two sides have mustered their Armies and have drawn a line in the sand. Obama’s allies have heard the bells ring and have responded by coming to his aid. Later today the other side’s representatives will be calling for their side to stand firm and defend the line in the sand to the death. A major battle is about to begin….
Hi Richard
What are you referring to specifically? Why word it like you are narrating the start of a film?
J
What is the prize in this battle is the prestige of the world’s CBs:
http://finance.yahoo.com/news/markets-just-got-double-dose-114200474.html
Goodness Richard you do like the dramatic.
These are ongoing events, nothing special here.
For the first time in a generation one side has organized itself and successfully fought and won a battle. Last night the leader of the other side disrespected that side. The next battle will be a “street battle” as in Wall Street. The prize of this battle will be the prestige of the world’s CBs (or lack thereof).
As mentioned earlier this week I thought Tuesday
was the last day for a 2014 sharp sell off,
with the year end coming rapidly in to view it
just looked increasingly as if this was not underway
by then, it just wound not happen.
Given that we have been in a melt up lasting
more than a month, we could get a couple
of weaker days, perhaps giving back 2-4%.
However in terms of 2014 waterfall declines taking
the SPX towards 1800, well this looks remote, at best.
I also think those looking for a January top, as in the
bull market top may also be disappointed.
We look to be now approaching the stage where any
retail resistance will crumble and they will buy heavily,
towards the ultimate top as per usual.
The world’s CBs are “three sheets to the wind” (falling down drunk) with their Power. They are off-balanced. Do you have the courage of your convictions to expose them as fraudsters and emperors with no cloths?
Good night all from downunder. Watch the VIX closely today it could be very interesting to see its response.
Cheers
Oh just before I retire I meant to post this. The bulls and thete is no shortage of them, have become so convinced the last few weeks that there is only one direction
http://finance.yahoo.com/news/dow-20-000-and-how-we-ll-get-there-205733692.html
Richard, I disagree with the assessment,
tat least the first part.
CB’s lack omnipotence and will ultimately
not prevent the next recession and the ending
of this business cycle.
If you want market proof that this is “the top” or at least a major top then while you have one eye on stocks put the other eye on the Yen. If you don’t know about the Yen “carry trade” then maybe you shouldn’t be managing your own account.
In the past 24 hours many CBs flapped their lips in the wind in unison behind Obama’s battle cry except one. Do you know which one that was and what he said about the Yen? Do you know what the Yen “carry trade” is and what it would mean for stocks should it reverse or unwind?
Btw, did you read what I posted last night about the Japanese People and their reaction to Obama’s –disrespect– of a new emerging “class” in the ole US of A? Do you know what “face” means in the Asian World?
Here is more food for thought: Shouldn’t US Treasuries be selling off so that money is being rotated out of bonds and into stocks while at the same time the Yen is selling off so that the Yen “carry trade” is alive and well as it further supports stocks too? But since they are not; what does it mean for the rally in stocks?
It’s official: CBs go ALL IN. PBOC cuts interest rate. ES + 17 . Megaphone breakout or blowoff top?
Richard I am not on the wrong side of equity markets
currently.
Neither do I combine or confuse
emotion with trading.
This has developed as outlined here
months ago.
The only area I underestimated was the
% fall, as I thought this unlikely to exceed 8%.
I read John’s blog to hear different views and I
do not get defensive when someone has a different take.
Too many on this blog are on a high hill inside an observatory with one eye on a telescope staring at a far distant planet accelerating around another far distance planet. They ought to use their one clear eye and take a look at what a new group of towns people in the valley below are doing. That newly organized group of people are out for the blood of some CBs.
Finally a voice of reason! Great insight.
Well, this may not be a bear market bottom, but it certainly keeps refusing to be a bull market top. Central Bank intervention has us in a Brave New World. I know the most dangerous words an investors can subscribe to are “This time it’s different”, but I am beginning to wonder… Have world markets ever been thru a time when there was so much CB intervention?
After Obama issued his battle cry most of the world’s CBs let it be known that they are his allies except for one. That one CB has is finger on the –weapon of market mass destruction– known as the “Yen Carry Trade”. That lone but very powerful CB has let it be known that he is the ally of the newly organized Class of People who swept into political power in America recently.
And that’s relevant to market timing, how?.
If upside gap does not close immediately today it may signal 3rd wave acceleration for indexes. VIX must hold its trendline from July lows otherwise SPX 2150 is at short hand and top will be postponed to January-March.
Gold has bottomed however and this works against stock now, the missing piece is USDJPY. This pair gave few fake signals of reversal in last 2 weeks. If the top in USDJPY is already in then today may be exhaustion day for stocks. Let’s watch..
euro yen breaking down hard from reversal candles 2 days ago. Uptrend broken. $/y won’t be far behind. Euro making a retest of lows which is positive for commodities. Treaury bonds poised. Let’s see how long the equity retail standoff lasts. Could be an interesting day.
can’t wait for treasury bonds to take off. it’s been stuck for in that range for too long.
So all of you short will be fried this morning, have finally seen the light?
Don’t fight the tape….or central banks 🙂
you know vinniesj, just because we post here does not necessarily mean that we’re short. Some of us are long, some have long positions but are hedged with shorts and/or long VIX positions. We can talk about an impending top but still continue riding the trend higher.
Not by the vast majority of posts I’ve read, all but the very few were adamant and proud to post they were short.
Bunell, Gold I called incorrectly,
expected sub $1100 as major support
had been cut through so easily higher up.
I’m Curious vinniesj.
How did you make out over the Sept – Oct fall when essentially “an entire year’s DOW / SP 500 gains” where completely wiped in all of 18 – 20 days?
Would getting short then ( as I did ) have been fighting the tape? How did the CB’s efforts help you out there?
It’s total naive to consider that The CB’s will keep this afloat forever, and it’s “all too always easy” to look / sound like the big shot “sticking long” while markets are going up.
I don’t imagine we’d have heard much out of you back in Sept – Oct though….and you’d have to imagine how many permabulls got completely cleaned out in a matter of days…after slugging thru this market for an entire year.
Consider contributing something constructive to the forum maybe.
Current positions in your demo account?
I don’t usually concern myself with daily price bars anymore but I do know what a daily “key outside reversal” bar is and its importance. The first part of a potential daily “key outside reversal” bar has been met with a gap opening on the cash market. I am looking for a rally in the Yen during the American day session of stock trading to give a powerful clue that American stocks will sell off in the final hour thereby resulting in today’s daily bar being a rare but power “key outside reversal”.
Shorted the QQQ at 104.6. No crash, only looking for a sell-the-news dip to fill the gap.

“Gaps” usually do get filled which is why Gap Openings tend to end up as Key Outside Reversals. Neither Treasuries nor the Yen are agreeing with the rally in US stocks this morning. In fact, both point towards money leaving US stocks instead of flowing to them. Both are pointing to not only this morning’s Gap being filled but for today being a Key Outside Reversal to the downside in US Stock indexes.
Hi Richard – Youre looking for a close lower than 2040?
Early this morning I took good profits in longs and went short December DOW futures. I am looking or a close beneath yesterday’s close and preferable beneath yesterday’s lows.
This little rally in the DOW this morning doesn’t bother me as I am flush with cash/profits. I have posted about what can happen should CBs or others flap their lips in the wind but I wasn’t expecting such a chorus. December Yen futures are about to take out last night’s highs that were a reaction by the Japanese People to Obama’s disrespectful speech. The Yen did not break to new lows over go lower then when Obama was issuing his Battle Cry like the Euro did when the leading European CB flapped his lips in the wind. All this is very, very interesting.
Many claim that Chinese officials fudge their numbers meaning that China does not have the second largest economy on earth but that the Japanese still do. The Japanese view themselves as the “lead duck” of Asia. After the Japanese People showed what they think about Obama, by the currency markets, a Japanese CB announced that he is in agreement with the Japanese People who are clearly supporting the new American Class that swept into political power like hasn’t been down since the roaring 1920s (City, County, and State, beside National). The Japanese People and that Japanese CB know that they have the “market weapon of mass destruction” which is the Yen Carry Trade and that they are not afraid to use it. Not only will they use it to back the newly organized Class in America that they support but they will also use it to let all Asians know that China is not the lead duck.
I have one eye on US stocks and the other on US Treasuries AND THE YEN.
I agree to be short at the open, which I did. But gaps don’t usually get filled. This is the 5th gap up in slightly more than 1 month — it likely will be filled but those counting on it have lost 4 times since Oct bottom.
This one had to be filled because of few other technical conditions. Risk reward was finally right to put shorts on this morning, and actually would add on the close for medium term.
European qe is coming. You’ve been warned.
Same as engulfing yes?
Nice follow through in $ Yen
Mario all talk no action, but keep building those gallows we are waiting underneath.
Sounds like something from a Dickens novel. The best of times to become the inverse?
Research Notes:
For reasons I do not understand; market reversals seem to also occur at the mid-point dates between the perigee and apogee. This is not exactly the same as what astrologers refer to as a ‘midpoint’ where a third planet is involved in an aspect; so I am curious as to any explanation?
Even more predictive of wild rides is when moon crosses equator from N – S and S – N.
Eclectic,
Perhaps it is that the moon has 4 major speed changes in the Apogee Cycle = at apogee, at perigee, and each midway (+/-) between each apogee & perigee. So the moon goes from a speed of 0 up to 6,500 km per day, and then just as quickly back to 0 kpd.
Also, as Betafish likes to use, Declination, although I believe it is also useful to look at the extremes in orbit. The importance of these extremes are proposed by Hans Hannula’s Lunar Chaos Model.
SC
Richard,
Good to hear you are .. flush with cash/profits
and you closed your longs this morning.
It’s good to hear people doing well, well done.
Consider this: This morning’s statement by a Japanese CB that the Yen has fallen too far and too fast could actually be the “shot across the bow” that the Bank of Japan is going to reverse policies and adopt the Austrian School of Economics that the newly organized Class that swept into political power in America favors. This is not unreasonable as it would make them -as of one- with their own People and that newly organized American Class. Should that happen then an incredible amount of money would leave markets throughout the world and head back to Japan. That is because the Yen Carry Trade has been in effect for decades and Japan does have the second largest economy on earth. Of course that would greatly point to “the top” having come in for US Stocks.
E/Y supports what you are saying – Japanese capital leaving Europe already
E/Y high from 12/13 at 145.71 – current 145.84 – as long as we close inside the December candle and confirm a double top the carry trade should have suffered a major blow these past 3 days
translated into ES megaphone lows and highs since July would see support 14.5% lower from current levels or approx. 300 points
Here is another consideration: Americans have learned from the British to conduct economic warfare before any other type of war. This is done internally in America when the government gains the support of the media to economically destroy a person or group before attempts are made to destroy them by imprisonment. With the newly organized Class having just won a major political victory (that hasn’t occurred on that scale since the 1920s) points toward them conducting an economic war against Obama and his supporters before acting in any other capacity. Should they do this and gain the support of the Japanese then the BOJ may let it be known that the Yen Carry Trade will be reversed which would result in massive selling of markets all across the globe. It is not at all unreasonable that these People will crash the economy/markets to lower than in 2009 over the next couple of years before trying to act in a non-economical way against Obama and his group. This is “War” and make no mistake about it.
I closed my scout short position for a small loss. No bragging right for now. Lol. Still focusing on buying cheap assets that are trading below the 25/200 SMA per the Paul Tudor Jones rule.
The posters who quoted safehaven and zerohedge need to read more bearish articles to get inspired again for the next battle.
A reversal today will place the market in a similar position as the reversal on 9/1/2000.
I was trading then. I remember a lot of bears thinking that the Nasdaq will finally crash on 7/28/2000 and they all got stopped out over one month plus a few days.
We are now at the same one month plus a few days from the mid-October bottom. But I know markets never repeat exactly. The other option is a 2.5 month rally like in 1929 bringing us to 1/2015. Today would be key to decide which option.
IWM today might look like EWZ on 5/29/2008, i.e. top already in place with failed attempt to make another swing up by close…which means we are post-second chance, with waterfall to come.
In terms of timing, we *should* be about 1Y into the crash, depending on which solar max/polar inversion metric you use. Therefore, 5/29/2008 analog makes sense — the real peak was on 7/2007 but we make newer highs for another 10 months, as we have on SPY this year.
John Li – Nice catch, just maybe
Thanks.
Everyone just got this solar maximum and maximum wrong. They were calling a 2011/2012 solar max peak! And I really really hope we don’t get some crazy sunspot count in the next few months, moving the peak out even further.
Let’s go from the solar minimum. In the last 100 years, the latest market peak was 1929 which was 6Y1M from the solar minimum. In the last 200 years, the latest market peak was 1873 which was 6Y2M from the solar minimum.
Scientists say the solar minimum is 1/2008 — and so we are currently 6Y10M.
I calculate the minimum at 1/2008 — and so we are at 5Y10M.
In any case, if we don’t peak now but in 2015, we will be making a new 200 year record.
Perhaps Hampson can comment on this.
Sorry I meant to say I calculate the minimum at 1/2009 — what do you think?
Suppose that you were one who has taken advantage of the Yen Carry Trade for decades and that you owe incredible amounts of money to Japanese banks. Do you think that you might have caught a chill? Do you think that you might now have cold feet? Do you think that you might be turning fearful? Why not? Hasn’t the Japanese Parliament been dissolved? Doesn’t the Japanese support the new Class that swept to power in America and that Class is against the economic policies that the BOJ is for? Didn’t a Japanese CB just fire an early warning that the BOJ is going to reverse policies?
With all that is going on in Japan there is the real risk that the Yen will rally which will catch all those of the Carry Trade with their pants down. It seems more reasonable that those people are turning fearful and are lightening up on their investments financed by borrowed Yen and are selling assets around the world to raise cash to pay back those loans.
What is this “Class”? Republicans?
The risk is growing that there is going to be a world wide liquidity crisis of a size that has never been seen before. At the same time that the enormous Yen Carry trade reverses the American winter is going to cause a greater slowdown in the velocity of money that what occurred last winter.
Durring this time Cash may literally be King.
I think the real crisis is that the stock AND bond market goes down say 20%, and every pension fund that has left hedge funds find themselves unfunded. Imaging the outrage in Japan and Norway. This is public savings wiped out. Now they protest on the streets, and the pension funds eventually decide to reduce equities, selling in a down market. CB want to buy to be the last resort, but find themselves unable to — with new majorities in congress in every country refusing to print anymore money. The only solution is for retail to buy, but giving the current state, it will take very very depressed prices for the general public to have any interest at all.
Good, I see that you do not have one eye stuck to a telescope watching Pluto accelerating around Jupiter.
The Fed is an independent entity. Yes, it certainly responds to political winds, but if the world economy is crashing, they will print, regardless of how much Congress yells at them.
Banks are independent entities too, but when they are in front of congress, they are under tremendous pressure and have to tamper their views.
The Fed helped Nixon win the election as Arthur Burns kept rates low, so not always so independent. Obama is on his last term, and I suspect the presidential cycle need not apply as he is not up for reelection.
Come on muppets buy the dip
It is almost a foregone conclusion this will happen yet again. You might see one or possibly two days of weakness early next week and IMHO all due to the Bradley Nov 21 helio turn date today. But markets are at ATH and now entering the bullish seasonal patterns. Take out shorts for a quick flip but the risk is not worth it at this point even if you “know” the markets will decline 20, 30 or maybe 40 points because the rip back up will be in the 60, 80, 100+ point range and will occur on surprise gap up open days where shorts get trapped with position trades.
Richard, I thoroughly enjoy your macro economic and market sentiment perspective. Please continue to post more of this when you come across anything interesting or reach those moments of enlightenment.
http://stg.do/mfuh
If we don’t fill the gap and get a gap down on Monday we get an “island reversal”. Even more bearish than a “outside teversal.”
Sp 2070 projected reached. I doing forex and always watching SP500. Carry traders carry a big stick in forex. Recently EUR goes correlates to Gold and against Yen. Today this is reversed. EUR departs from gold. Seasonals EUR could be bullish but this time EUR weaker than its seasonal so EUR will go much lower than expected.
Richard Isaacson. Really enjoy your comments. Shorting the open today reminds me of Edwin Lefever’s Reminisces of a Stock Operator. He used (manufactured) good news to sell into strength and bad news to buy (cover shorts) into weakness.
The biggest trend in the world today is the $ bull, which is essentially a reverse proxy for the world wide carry trade which is being squeezed big time. There will be corrections, but it is better to ignore sell signals in a bull mkt. Your thought of a Jan outside day reminded of how many time the mkt tops in late Dec early Jan. Earlier devaluations seemed like shots across the bow. Today, fire at will!
Allan, this is highly unlikely to be a top imv.
I think Steve T is on the money with his outlook FWIW.
May be some very minor dip, I thought 2-4% but
even the 4% looks unlikely.
A small dip to shake out a few weaker longs out and
then rip higher to year end.
I can not see how this is stage 6 as in the
link you posted earlier this week, stage 5 may be.
Kent, Richard Smitten’s biography of the great man
is a good read.
The end is difficult, the suicide note he left particularly
poignant.
Here is a new thought: The FED ended QE only because it knew what was going to happen in the elections and wanted to be on the winning side to keep their heads. If so, then should another liquidity crisis hit they will be much less likely to act to restore liquidity but let the markets work it out as best as they can. That means a “crash” to below the 2009 lows in US stocks is possible.
This could be what is also driving major changes and turmoil in Japan. Japanese CBs may be in the process of coming to grips with the unseen but profound changes at the American CB. The American CB may be using its former policy of transparence as a “cover” for its changes in policy. The Japanese CBs might be starting to see through that “cover” to the truth and are acting in their own best interest instead of the best interest of all others. The truth is that it may be every CB for themselves as all hell starts to break loose.
OK, I read a lot of posts here for weeks. Be honest now. Raise your hands, how many of you got scorched today bcz you were so sure of a pullback since Nov 1st?
I lot a few bucks but my system points to a low on next Tuesday.
Not being a wise ass, I’m asking bluntly:
Has your system also told you to be short since Nov 4th?
After you answer that honestly, I’ll add this.
I don’t like seeing people lose money, but I also don’t believe in the tooth fairy. Now today’s close on OPEX did what they needed, a close above Dow 17,800. Come Monday with RSI’s at all time extreme’s, even I would call for a pullback over Monday-Wednesday sessions, as much as 2%. If there was a time for a pullback, now seems very likely. They threw the kitchen sink at the market with ECB QE, China rate drop, BofJ QE. There’s nothing left to cheer about.
Someone will take profits, and this will start a bit of selling, a bit mind you, not a bout. Fair assessment?
I am long on Tuesday until 12/2, seasonals too favorable.
BetaFish,
You just said your system points to a low on Tuesday, then you post you are long Tuesday until 12/2. Make up your mind BetaFish. Long after OPEX? Now you may be the ultimate contrarian indicator. You waited 3 weeks to finally give in.
Vinster, a low on Tuesday, going long on Tuesday, buy low, sell high. Capisce?
Capisce Signore. I’m doing a little after dinner reading. Nothing has gone the way people expect, and next week they expect more upside. Hmmm. Even I find that hard to believe, and you know how fervent I am about CB intervention and endless liquidity. Market may need to come back in to lure more big money.
Grazie, buona notte Vinster.
CBOE shows all of todays top ten put action was all SPY related. From 204 to 193, quite a spread. Now you research if they were hedges or opening positions.
Not easy to discern, but dig hard, you may find out.
Hope that helps you. Also I did look at the 4 major indexes and all were above 70 RSI, almost 80. Even a Central Banker will take notice of that now that OPEX is done for November. Bona Fortuna
I was actually long SPY, long several individual stocks by owning shares on some and being short puts on others. I have a small IWM short and own some VIX calls as a hedge against my longs, but those positions are very small compared to the long positions. I took profit this morning on the SPY shares and calls, and then repurchased part of the SPY long position this afternoon at lower prices. So me personally, it was great to wake up to SPX futures being up 16 points overnight!
You did great, I love to see people make money. Now share your trade ideas in advance with your fellow solar flares so they are not one sided/short sighted. They seem to appreciate help, especially such a precise strategy that made you very good coin. Gotta go, Friday night is calling, time for fun, not stock talk.
Beautiful reversal candle in qqq – as stated before metals had a strong reversal a week ago, yen 2 days ago and stocks have done it today in the market leadership areas – biotech and nas. Finally the market seems to start confirmation with price as well.
mind posting some charts? new to candlestick charting. thanks.
Kept my qqq shorts. And added tlt longs, looking for a big move next week in bonds into month end. Not so sure if stocks will be down much next week because its thanksgiving, but imho the 3-4% dip begins in December and lasts 2 weeks
Also added slv longs on confirmed trendline breakout.
DV, see my post reply to BetaFish. Today was another bonfire!
agree with Richard’s very good comments that capital flows are about to change the deck chairs on the Titanic. Something which has been missing in the 11 month topping process but maybe falling in place now.
davinny – nice add on silver
SLV doesn’t show it but silver cash and futures had some real nice candles at the bottom
Be honest all I could see today is pressure selling right from the US open to close.
Do they not have faith in Mario? I don’t think Mario will want upset the Germans or risk his job like Abe has.. Abe will be kicked out next month along with his suicide QE programme.
Ps nope not not scorched, not even a scratch my first short don’t kick in till 2011 on the SPX.
All time Highs and you see selling. Denial x 10 for you.
vinnies, mate if you were in Oz and carried on like you are on here you wouldn’t last 5 minutes before somebody brought you back down to earth.
For all your loud mouthing and posturing the fact is you have no more idea than anyone else where the top is.
On top of that you are no different to any of the “chumps” in the later stages of the dot com bubble who thought that they knew it all and carried on chest beating and telling everyone else that voiced reservations about valuations that they knew nothing.
Do everyone a favour and take your comments elsewhere!
and on a 10 min chart – boxing the Spiral using 7442 prograde and retrograde phase data for today. https://twitter.com/mjmateer
olive green boxes = prograde and retrograde phases.
Gap was closed only in NDX, in SPX and DJI it was just penetrated.
That is not enough for key reversal day. It was at hand but VIX was again crushed to allow recovery into the close.
For Monday, bears can hope for USDJPY to continue its downtrend.
If it gathers momentum overnight then we may even see kind of bear porn with island reversals in S&P and Dow. That would be strong indication of trend change.
Bears must not allow VIX to break its trendline and get below 12. That would mean further levitation, possibly to SPX 2150-2170 level in January.
I count this advance from October lows as fifth wave of bull market that began in Oct’2011 with advance of 218 points. Wave 5 = 1.618 x Wave 1 would give 2170 as target.
Let’s watch Yen closely, especially EURJPY looks now promising for the bears.
Don’t count it from 2011 lows. That was still bear market complex correction.
Perhaps the Sun does not exist, anybody been there and seen it first hand?
Sunspots on the down leg
doesn’t look on the down leg to me. I see higher highs and higher lows. I also see the PROJECTED path, but that’s just someone’s idea of what should happen. Until we start to see lower highs and lower lows, the sunspots trend is up. 😉
At least with sunspots we know that they will decline eventually. Unlike the markets.
🙂
actually, I stand corrected. There is one lower high and one lower low on the chart, so maybe the trend has turned down.
vinnies, I don’t have to justify my trading positions to anyone, least of all an arrogant twat like yourself.
You do win in one respect though because whilst you are here I am gone.
Good luck to everyone else that has the decency to treat people with respect when they post a response to them.
You’re all class vinnie and obviously a very small man.
You stay, he’s blocked. His kind of bitterness isn’t welcome.
Hi John I apologise for not ignoring him but I couldn’t take his arrogant stance and disrespecful responses to other posters any longer, but also I felt he was being grossly disrespectful toward your research using the tone that he did.
Let’s move on. Thank you.
PS Divergences continue and if there is one thing the last few weeks has reminded me it is just how long the markets can take to eek out a top, but the signs are there. No need of course to convince you of that.
AAPL put in a convincing reversal on Monday, which I am certain would have under normal circumstances been a clear top, but these are not normal times and Central Bank announcements have thwarted the bears yet again.
Their time is fast runnng out. The signs of deflation are everywhere. Copper, Fe prices collapsing to 2009 lows and looking to head lower. The BDI looks like it may have topped. The Chinese are obviously in trouble and I have it from good contacts that their shadow banking industry is facing a looming crisis and may be behind the PBOC’s recent cut.
All in all this recovery has been the worst post recession recovery on record and we keep hearing how well corporations are doing but the fact is that capital investment has not emerged, wages have not increased anywhere near past recoveries, share buybacks are at phenomenal records which raises the question why are they using capital to buy back shares and not investing if the outlook is improving? And we know the answer to that is because it isn’t.
Add to the above, Corporate debt to cash levels are at extremes and Board compensation is through the roof.
No doubt in my mind we are already in a bear market. Over the next few weeks the US majors will make it obvious.
Cheers
http://stockcharts.com/h-sc/ui?s=AAPL&p=D&b=5&g=0&id=p43366412420
Thank you for that, John. His posts were very disrespectful and were getting more obnoxious by the day.
Next high is expected in the 2-5 December timeframe, but hey who am i to say so, my last time cycle did not play out as expected. Bull is on.
http://tradingtweets.wordpress.com/
A reversal/exhaustion candle yesterday right at the new moon. Looks promising for next week.
I agree, major indexes made promising gap up and failed to hold the highs. Skew also elevated again. Two days > 135 which historically has market reversal (but not this year). Breath still weak: http://goo.gl/LAqjsn
Due to Trader’s Almanac and the fact that many Big Boys use Quarterly Bar Charts to readjust at the end of every Quarter and the beginning of a new Quarter along with some super-Rich who use Yearly Bar Charts I was looking for “the top” to happen in early January. If the Monthly MACD “signaled” with the completion of December’s month bar I was still expecting “the top” (on daily bars) to be in early January. But that has changed. I now expect “the top” to be in on Weekly Bars which was how I position for November to be the bar that “signaled” the Monthly MACD. I was expecting last week to close lower if not also be a reversal Week. Wow was I surprised.
I took profits on longs and went short DOW futures early Friday morning and dozed off. When I woke up I was surprised that DOW futures were 120 points against me. (No problem financially). But when I discovered that just about ever CBer in the world had spoke, or acted, I knew the odds were high that its all over and Friday would be an historical blow off top.
Small Specs should note the Daily DOW MACD is on the verge of a sell signal that agrees with the high potential of a sell signal of the Monthly MACD. A November Monthly sell signal, with no other cause against it, such as Quarterly or Yearly adjustments, points to high odds of December being a “crash month”.
– Heliocentric Venus crosses the north/south barrier on Saturday
– the mercury/Jupiter cycle turns again on Monday (cit)
– Solunar force extreme on Saturday
– lunar declination south and turning on Monday
– moon enters perigee period (Strong and stable force) on Sunday.
– Tidal extreme on Sunday and double inversion on Monday.
– Chiron turns direct Sunday.
Solunar force gave an extreme low on Tuesday. This low will not reappear again this year. Wednesday we had the moon conjunct the retrograde node. This created an inversion to push the high towards the new moon. With all the inversions this weekend a pull back into next weekend seems likely.
André
Additional observation
Lunar force and the mercury/jupiter cycle are really two separate things. Solunar = gravity, M/J=solar activity.
The solunar force gave an extreme low (= market high) on Tuesday. The mercury/Jupiter cycle will give an extreme high (=market high) on Monday.
If you realize where these calculations come from, this synchronicity can’t be coincidental. Both indicators won’t see these extreme readings again this year.
My theory is that if both forces work together, you get a smooth trend. When they are out of phase we are making a round turn; W3 top Tuesday, W5 top Monday.
Next turn in sync Saturday 29.
John
Hope you are well. Been a while since i contributed – just been busy.
I see the number of comments have significantly increased since I was here a few months back.
Interesting post about bear market bottom. Have to say that the October decline was shallower than I had anticipated and since then this has been one heck of a rally up. Out of 27 days only one real down day. Unfortnately, that October low could have been the washout that was needed. Seasonality would suggest that being the case and so would the presidential cycle.
Perhaps the mania is set to continue? All the Central Banks appear to have their foot to the QE pedal. It is my belief that this whole bull market was driven by QE so perhaps now we are entering the final stages of CBs ‘going-all-in’ of retail participation as is always the case at a major top.
In my opinion the crash window passed and im not aware of November marking a significant peak in the past. Im beginning to wonder if we should be watching the Nasdaq for clues of a top? We are closing in on the high from 2000 so perhaps that is the target?
Just some ideas whirling about in my head at the moment.
Duncan
If anyone can update on market breath indicators
it would be interesting to view the last week in
some more perspective.
I continue to see this as a dangerous market,
sentiment for me is beginning to echo 2000.
Ultimately the US earnings cycle will turn
and no amount of FED support will support
valuations.
Unless the uber bulls are correct, I see the
most likely time period as second half 2015.
Foundations of ‘ZIRP’ with walls of ‘broader range Interventions’
The roof is made of bubbles which helps when walls get higher
I remember when you could not fight the FED
Now its no different except its the central banks of the entire planet.
Their only enemy is themselves, and the remote chance that they will somehow succeed
If they get those things right so that there is synergy with no hope of change then perpetual motion can become a reality.
Buy dips looks like here to stay. Just the size and timing of the dip that confounds.
nice skew spike yesterday setting us up for the reversal expected 3 weeks post end of QE. i think the bankers know this is the period stocks have crashed before, which is why they tried to nip it in the bud this week. why else would they do it at all time highs and not save it for a dip unless that dip is going to be more of a crash? if draghi wanted to shock, he could have waited a week until the december meeting.
with the new moon, bonds maintaining a strong bid, credit not being bought since october, reversal candles, skew, buyers all in, vix holding, dax right at the point where it would make a lower low, iwm not confirming/dojis, nymo trend very similar to september pre-dip, among many other indicators that hopefully john can put in chart form for us (my comp skills are limited), i am sticking with my thesis that the next 4 weeks (through december opex) are strongly down. granted, i did not expect this up move to be as strong, but i did say it would continue through this week.
we also have some interesting events that could potentially move markets. gold referendum, abe election could be huge. movement could really pick up when draghi just jawbones more at the december meeting and doesnt deliver. i believe the boj action isnt enough and the market will force his hand come january.
http://news.goldseek.com/GoldSeek/1416507082.php
Notice on the third chart how strongly the S&P 500 bounced off the 52-week moving average. Everyone can see the “trampoline bounce” in hindsight. Big Money stepped in to buy and the speculative yen carry trade continues. Japanese QE, positive U.S. company earnings, and now potential EU QE have all been recent positive catalysts to propel equity markets higher. Are there many more good news surprises out there? I suspect not. If/when the yen carry trade reverses, that will be exciting to watch. Expecting a reversal soon.
Gavin, the FED under Bernanke’s tenure did succeed,
although perhaps it depends on your definition of success.
I have no doubt the FED succeeded in preventing another
great depression (rather than great recession) with a
resulting deflationary spiral.
This has come at a price and with consequences.
The ECB is far less likely to fight deflation and Japan
looks like being even less effective.
CB’s can alter the business cycle, they can
not abolish it.
This is the mistake many uber bulls make in assuming
the cycle will last years in to the future, it’s a seductive
illusion.
The US cycle will ultimately roll over as global growth
slows combined with a stronger $ index.
I disagree. I think that this is not 1937 but 1929. Therefor, Bernanke was the wrong man. A major difference of the Class of Americans that acted in the 1920s to put large numbers of Republicans in political offices and now is that they are against the existence of the Federal Reserve Bank of New York (a private corporation with stock held by others). All that Bernanke did was inflame them. In 1929 the FED simple made a mistake of sucking liquidity out of the system which exasperated the Depression. This time it will be intentional with full knowledge that a Depression will result. The reason is that the FED is no longer in –savior mode– but in –survival mode–. The FED is going to appease those who have backed the Republicans in to power so as to outlast them and not be dissolved by them and if that means adopting the Austrian School of Economic model that will cause a Depression then so be it.
To but it differently the FED is now looking at Decade Price Bars and no more cares about two Decade Bars than a Pro cares about two Daily Bars. Because the FED is in survival mode it could care less if a Depression comes and goes along as it out lasts those who want it done away with.
Yesterday showed that it is every CB for itself and the Japanese seem to be the only ones with a clue of that fact.
The reason why some have suggested 1937 is due to the zero interest rate policy.
How do you know this about the Fed? Do you have inside information? Do you know any of the Fed Governors and if so, have you talked to them about this issue? Fed in survival mode–sounds pretty extreme. Maybe it’s true, but I would like to understand what were the pieces of the puzzle that you put together to arrive at that conclusion.
I never thought I’d see anyone suggest the Fed is turning Austrian!!
Well, I suggest we watch how the Fed reacts and what it does in the years ahead before jumping to conclusions based on 2014 mid-terms.
Odds are the puppet-Fed will keep on printing, in one way or another.
Hi Phil;
Not sure I can give you quite what you’re looking for, but I do go over quite a number of charts every night, to both update my composite system – kept on a spreadsheet – and to get an overall sense of what the daily charts look like…
A couple of my favorites are looking at money flow and a self-adjusting RSI that I use….
And after looking at my charts last night, I was kind-of surprised by how UN-impressive yesterday was for the vast majority of charts I viewed, from a bull’s perspective…
Money flow keeps heading down, RSI is tagging points usually associated with tops, and yet price continues to chug on up a little higher…
And on the charts I look at, that’s what pretty much happens at every top (and the reverse for bottoms)
I’d say that BBE’s Wile E. Coyote pictures are not far off from what the US stock market is going to experience at some point soon….
As far as my own system, still at 100% short, although after Friday the actual reading was a little less bearish than it was earlier in the week…
This was pretty much due to the bounce in junk bonds Friday…
Not much change to other indicators, and again, it’s not likely to indicate a “buy” any time soon…
The bottom line for me is, I’m still short, and Friday’s action did nothing to indicate to me that that needs to change…
Wasn’t happy to wake up to see the Futures where they were, but seeing RUT go (temporarily, anyway) red mid-afternoon just confirmed to me that this market is an accident waiting to happen…
Wish I could time tops and bottoms with a finer point, but, oh well….
Thanks…
Hi John,
Are you adding to your shorts anytime soon?
Barry,
Appreciate the detailed reply, many thanks.
Wanted to compliment the quality of posts as of late. The original ideas and trading ideas presented here are really worth the time and special thanks to those working on unique ideas such as Peggy’s GEM and Andre’s Astro Lunar Gravity work. While it may be unclear if the bearish or CB induced perma bullish scenario will play out, it is always useful to be aware of extra market factors like the Lunar Edge, Solar Effects, Apo/Peri, Declinations, etc. as time tested supplemental indicators to assist in decision making. For example, if Lunar Edge is positive and other tech indicators are favorable a more aggressive positioning may be indicated. Or if the LE is negative and technical indicators are unfavorable a more aggressive downside positioning may be useful. I am close to understanding Andre’s work and it makes sense based upon the LE and declinations. However, with Peggy’s GEM while I intuit it will be a profit maker, I don’t understand the phenomenon which it tracks and how what effects it has on the market. Hope that during the next few weeks, to study it more closely to find out it’s moving parts and because it is a daily indicator to use it for trading, esp. futures trading which is trading around the clock, and with leverage it may be a way to earn a daily premium vs. buy and hold or swing trading which is more subject to chop from news or economic data. Last, thanks to RI for his lengthy, sophisticated, breezy posts which contain a refreshing amount of new ideas such as monthly MACD as a trend maker, and the CB dilemmas which may/may not be of true significance. You all are the best, and especially our moderator who makes all of this possible.
This chart from Econocasts trading models supports your case , and btw, thankyou for your excellent analysis and “share the Knowledge” approach , it is much appreciated .
http://econocasts.blogspot.com/2014/11/20141121-vix-cycle-model-chart.html
Jonny, Paolo’s DOW chart began diverging in early 2013 and it appears that his gold model chart and the VIX chart now appear to be doing the same.
Paolo himself has posted on this recently and stated that he has no real explanation to explain why this is happening. Especially in the DOW case the model worked so well going back decades up until recent years and now it is completely wrong.
He has hypothesised that market intervention has now disrupted normal cycle behaviour but he isn’t exactly sure.
Over 400 responses. Is it useful to add anything? I wonder.
Anyway; for my friends on this blog I want to say what I am working on.
First to the skeptics: you can’t predict the market with gravity! Or I should say : not with gravity alone.
Using the Saturn/Jupiter cycle I can calculate solar activity for any date you like. This is a major breakthrough for me as now I fully understand why tides are nice but not perfect.
Always knew there are multiple natural forces active at any time, affecting the market. But for forecasting you must be able to forecast these forces. Just using one force for your analysis is not going to work. So now I found how to use solar activity on a day to day basis, it is as powerful as the tides. And the combination is mind boggling.
All the things I have said about cycles was true; there are lunar cycles. But they are only a sub set of what you’ll find in the market. So now I’m working on a new cycle structure. The good new is : a lot stays the same. Consider this : 20 heliocentric mercury cycles=4 heliocentric venus cyles=3 heliocentric mars cycles=6,4 years.
3 times 6,4=19,2. This is close to the 18,65 year apogee cycle. So there is order in the universe. The 11 year solar cycle (what is really a Jupiter cycle!) times 5 = 55.
3 times 19,2 gives 57,6. This explains the 56 year cycle on average.
This is the structure I am working from. The 19/56 year structure (K-wave!) is directly linked to the heavens. I separate between astronomy and astrology. Scientific research has confirmed the impact of Saturn,Jupiter,Mercury,Venus and Mars on the sun. So these cycles should be viewed strictly heliocentric. Inferior conjunctions are powerful timers as now earth supports any of these planets.
As I now simply have the cycles on a daily basis I don’t need to know if there is a 27,29 or 33 day cycle; I can simply see when it will turn. This gives me a new foundation for forecasting : when both forces work together there is nothing left to stop this. When tides are off it is because solar activity is at work. And visa versa.
This concept can be applied on any level; yearly,monthly and daily. The yearly analysis on solar activity gives 2002,2008,2013 and 2018. I think this is what John is telling us and he’s right: solar activity peaked in 2013. But the gravitational cycles are still up. And this explains the market this year.
Time is running out. The sun conjunct the retrograde Mercury gives January 30th.
The apogee cycle gives an inversion in December and likely will push this cycle into February. The heliocentric Venus declination gave a high in august, supported the October decline but turns up on December 5th.
So it really seems we will see a last desperate attempt to support this market into next year. But after a few weeks into the new year the party ends and we should start a bearmarket, as long term gravity and solar activity will join forces for some years to come
Always thought I was a lunatic. Turns out I am just a solunatic.
Have a nice SUNday.
André
New post is out. Thanks all.