

Got internet this morning so time for a post.
The chart below reveals that pro-risk (proxied by MSCI World Equities, Euro-USD, CCI equally weighted commodities index and 30 year treasury yields) made a correction throughout the month of March. Today Euro-USD and commodities have popped up – not captured yet in that chart – so I suggest the correction in pro-risk may now be over. Equities remain the leading class, and various indicies have broken out to new highs in the last two days, which cements the idea of the correction is done.
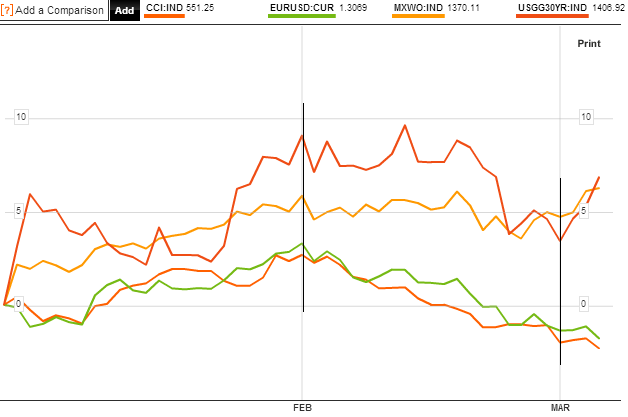 Source: Bloomberg
If you recall the 5 models in alignment, they projected a January swing top and a March swing bottom. If this is playing out, then the next and final top should be around June. With history as our guide, the stocks cyclical bull should end with a frothy overthrow, so the kind of sentiment and buying levels we are reading about should be expected. However, I am not sure whether stocks can keep pushing on from here until June. I originally targeted around 1600 for the SP500 to top out, and this was echoed in work by Laslo Birinyi and Barry Bannister. We are currently less than 4% away from that.
Again with history as our guide, we should see a topping process with weakening internals and negative divergences in leading indicators. In terms of leading indicators we don’t yet see this. The latest global PMI reading for combined services and manufacturing looks like this, still in expansion:
 Source: Markit / JP Morgan
Citigroup economic surprises are back in the positive for the US. ECRI US leading indicators have weakend a little but remain in a strong positive uptrend. The last missing update in CB leading indicators was for Euroland which came in a positive and improved +1.0. So, right now, we have a backdrop for pro-risk to advance, but I am watching for evidence of trend changes in these indicators.
In terms of market internals, stock market breadth has overall been good and confirming. We need to see those internals weaken for greater likelihood of a top. It does not mean we cannot see a deeper pullback before a renewed attempt at a high – which then displays the weaker internals – in fact that would be the historic norm. So, I am not sure about the push on until June from here, without another correction. Supporting this we see a spike in the bullish percent over call/put indicator, which has been missing, which suggests US stocks should top out soon (Tom Demark predicts at 1567). We also see daily sentiment for the Nikkei index over 90 (out of 100) and it stands on that one precarious steep leg. Plus, Monday is the new moon, which has the potential to be a swing top. So, with this in mind, I have taken profits on my Nikkei positions this morning (NZ time) and left my other stock indices positions in tact. Back in October 2012 I wrote about how cheap the Nikkei was and bought for an average of around 8700 (see here). That trade has returned 40%:

I believe the Nikkei has entered a new secular bull, after a 19 year cycle from nominal top to nominal low, but that this steep single leg up needs to become a more stable ‘W’ with a retracement, a higher low and then a push on again.
Commodities, as a whole, are in a different place, with sugar, coffee, precious metals, wheat, orange juice and others suffering bearish sentiment and low buying interest. However, most of those are now back to important support levels, which combined with the contrarian sentiment readings, provide a good base to rally. And so we return to the guide of solar/secular history, which suggests commodities should now take over as the outperforming class, and while equities process a top, commodities go make their secular finale. This, as you know, is subject to the solar peak timing being correct, and we still do not have decisive evidence on this, so I continue to watch sunspots.
Danny pointed out the change in IPA solar peak forecast. I now understand they are using the SIDC methodology, so it doesn’t amount to a different forecast. Here is a summary then of the solar peak projections:
NASA: Fall/Autmun 2013
NOAA: May 2013
SIBET: Sept/Oct 2013
SIDC: Either Fall/Autumn 2013 or it occurred already in Jan/Feb 2012
Polar reversal method: Q1 2013
The consensus therefore remains that it should be taking place ahead this year – and so it remains that a daily sunspot count over 200 would help sure up that likelihood. Therefore, that scenario remains my favoured and I am positioned for it, but until the alternative secnario is weakened, I am not taking on further commodities positions, despite some very attractive current plays.
TheDarkLord referred to the possibility of a twin peak, based on the similarity to solar cycle 14. I covered this last year, when the parallel was already being floated – see here. You can see in the charts on that link that SC14 was essentially a flat top as well as a twin peak, but note that the smoothed solar peak and the secular asset peak both occurred at the front peak – in fact they happened both dead on Feb 1906. So, it is the smoothed peak forecasts, as compiled above, that are key. That said, I have previously shown that there should be an echo commodities peak (a lower peak) a couple of years later, which could tie in with a second solar peak. However, I have also previously shown that by that point, being in equities is the place to be, returning better than commodities. Therefore, it does not change my strategy: assuming the consensus solar peak is correct and ahead, commodities should make their secular peak in the months following it, then I wish to exit commodities and target equities.
I have not been able to update the models this week, but will do so next week. The key points are that the new moon takes place on Monday, the geomagnetism model has weakened slightly (geomagnetism should start to seasonally worsen here) and sunspots are back up around the 100 zone.

Just a quick question on the Nikkei.
How did you buy it ie. was it through options or an etf or another vehicle?
A lot of indices seem to have started a correction and others appear to be in blow-off mode. Looking at past history, this late stage in the secular bear would imply a shallow cyclical bear to finish the secular bear, though it depends on what ‘Spinning Plates’ Ben/his successor can achieve on extracting themselves from the endless money printing.
Regards.
KF
Thanks for your thoughts. I bought the Nikkei through spreadbetting, which is tax free in the UK.
Hi John,
I think IPS only partially uses the SIDC method.
If you go to the very bottom of their page at http://www.ips.gov.au/Solar/1/6, you can see their updated forecast now puts the cycle maximum in Dec 2012, with a max SSN of 70.
That differs from the other sources you mention.
Maybe these institutions are just picking another month in their forecasts, in the hope of becoming the only ones who picked the correct peak… i don’t know.
Danny
Cheers – the first set is smoothed sunspot, the second solar flux.
Yes, that’s their tables they update every months.
But I actually mean much lower on that page, where you see their forecast for the cycle
“FORECAST SOLAR CYCLE 24”
Max Mth: Dec 2102
Max SSN: 70
And Goldman agrees with you on commodities:
http://finance.yahoo.com/news/goldman-raises-3-month-forecast-104425580.html
Wrong clue, indeed
Having worked at those type of places my advice to you is not to listen to anyone. If many iBanks, brokers and analysts say something it is most likely wrong. It is not that they are evil or some conspiracy or whatever. It is just that working in a group finance environment under pressure such as Goldman etc produces suboptimal financial advice 8 times out of 10. Or even better the value of their advice over long term is probably 50/50 so totally useless for your long success.
Thanks, John, when are you back to the UK?
Cheers – last week of March
John,
Your milestone always seem to change. Wasn’t May 2013 your previous predicted TOP ?
Jacob
Can you clarify – is that stocks peak, commodities peak, or solar peak? And point me to when I was saying May? Then I can say what changed. But generally speaking, my method is to keep crunching the evidence as it comes to light and tweak accordingly – better than being wedded to a view.
92 percent correlation between 1952 S&P and 2013 S&P according to this website http://www.mrci.com/special/dspi52.php
If correlation holds then expect top around April 1, bottom around April 30, and another top around early August. I do not know how long this correlation will hold because I have been hearing lots of gloom and doom from investors like Faber, Nenner, and others who predict market will start a large correction in 2013.
Recently both Faber and Nenner were on CNBC. Nenner thinks S&P will start correcting in 2013 and trend down to 5000 around 2017 or 2018 before a new long term bull market starts. Nenner’s prediction fits in nicely with the 17.6 year stock market cycle. If one assumes that the year 2000 was the start of a 17.6 year bearish stock market cycle then around 2017 or 2018 the next bullish cycle should start which is what Nenner is predicting. See explanation of 17.6 year cycle and chart at this website http://www.tradersnarrative.com/the-18-year-stock-market-commodity-cycle-2760.html
Jack,
That is a very broad chart that doesn’t pick up 1987, 2007, 2013. The Balenthiran Cycle describe in my book (and the Investors Chronicle video) picks up these turning points and thus is much more useful than just waiting 17.6 years.
Regards,
Kerry
Hi Kerry,
Yup, I agree. It’s a very broad chart of the stock market that may indicate a reoccurring average 17.6 year cycle that could reoccur around the 2017 or 2018 time frame or not. But for someone like myself who likes to ride out the ups and downs in a long trend, I find it interesting enough to keep on eye on it.
A 17.6 year cycle does not show up on the Dow Jones spectrogram, nor does a 2.2 year cycle. Kerry if you are suggesting these are fixed, precise cycles then they should show strongly on the spectrogram, rather than not at all. There should also be a compelling scientific or logical reason for such precise cycles (don’t know if you’ve offered one in your book). If on the other hand, these are general averages to act as a guide (per Tradersnarrative), then that’s a reasonable starting point for any trader or investor. But there are inaccuracies in the calculation of those averages, not least because people tend to misunderstand the 1929 episode, and I have a lot of info on my site to show how it is in fact the solar cycle at work and how we can predict more precisely accordingly, and how all secular peaks occur close to solar peaks. The problem is with averages is that they aren’t a good predictor, only a loose guide – but I think Kerry is suggesting it is a fixed cycle rather than an average.
Hi john,
Yes I am talking about a fixed cycle. This link shows a DJIA spectrogram with a cycle of around 17.something years
Click to access index.pdf
2.2 and 4.4 years are less pronounced and 9 is clearly significant, but 17 is there as well.
Regards,
Kerry
That´s right Kerry, but didn´t you expect the Us markets picked in summer of 2012, not in 2013, in these levels? I consider The Dow Jones about 9.000 points or less in the next big move down.
Hi Antonio,
The Balenthiran Cycle had a high for the Dow in 2011 (i.e. exit longs) and a low in 2013 (buy back in). So yes I have been surprised by this Q1 2013 spurt but it doesn’t change my view of a 20% to 30% correction down to Dow 10,000 – 11,500, not dissimilar to you.
Regards,
Kerry
That´s rigth, in 2011, but considering Bovespa, wich model has been after The Dow Jones, I expected the same way in 2012, looking for the 13.000 points, but after summer i was disapointed with the up-movement.
Regards, Kerry. Is it any way to contect with you? Thanks
Hi Antonio,
You can send me a private message on seeking alpha:
http://seekingalpha.com/author/kerry-balenthiran
or on twitter:
https://twitter.com/17_6YrStockCyc
If you provide me with an e-mail address I can then e-mail you.
Regards,
Kerry
Kerry,
Does the last chart on page 9 of the PDF file link you provided indicate that the market will peak beginning the third quarter of 2013, go down to end of 2014, then pop up through 2015 and into 2016? If so, popping up in beginning of 2015 fits in with the Decennial Pattern. The theory is that years ending in the number 5 like 2015 are up years for the stock market. The year 2015 would also be the third year of the presidential cycle which is generally good for the market.
Jack
Hi Jack,
I don’t think you should be too precise with these things. I interpret the last chart on the pdf as a peak mid 2013, a low end of 2014/early 2015 and a rally into 2016-18. That is consistent with the Balenthiran Cycle documented in my book. That would also fit with the decennial/presidential cycles as you say.
Regards,
Kerry
Any thoughts?
The calm before the solar storm? NASA warns ‘something unexpected is happening to the Sun’
Read more: http://www.dailymail.co.uk/sciencetech/article-2290289/NASA-warns-unexpected-happening-Sun-year-supposed-peak-sunspot-cycle.html#ixzz2MzmFn4cv
Follow us: @MailOnline on Twitter | DailyMail on Facebook
Thanks. Yup, it’s a messy unclear sunspot cycle at the moment. This chart shows how the cycle took off in 2011, but has since not had much of a clear trend. Hence SIDC are running with two opposing scenarios. https://solarcycles.files.wordpress.com/2012/02/a274.png?w=547&h=153
John,
I know you meant to say February when you said “made a correction throughout the month of March” in your lead-off sentence. That’s what a complete disconnect while traveling in far-off places can do to you. 😉
But there’s still time for more correcting to better fit the 5 model forecast – even if I don’t think we’ll see it . . . but it could be some more sideways consolidation . . .
Thanks High Rev. Yes, more correction would fit better, and I have my eye on today’s new moon as a potential swing top. But decisive breakouts in certain key indices post the recent correction.
Good stuff to you all. I still think the markets will break out violently due to the Fed scaring people with hyperinflation – you gota buy something. We are in a wedge that is breaking out and traders are still shorting. The Fed needs to get us into a new bull market – it knows this – any discussion about the effects of operations etc is just to calm the bull move so that we do not get a parabola. When markets break out of the consolidation from 1999 and the current wedge in S&P500 and unemployment in the US hits 6.5% we get the retrace and cyclical bear or some type of short term crash which John is talking about but longer term we are in a bull market as Jessie Livermore would say and one should be more afraid of the right tail than the left. Few people/traders are truly feeling bullish and thinking the “economy” is good. When most people think it is good I will be afraid but as long as there are doubters, there is room to move higher (Oscillators are just squiggly lines that at times get stuck and the trend followers get their bonanza). Sunspots a longer period 100-200 will most likely correlate with the retrace if history is a guide (weakness in summer and autumn (geomag) – yes). The danger with sunspots when going through the historical data myself is that the drops in the markets are not always that long lived so as long as you are holding value without leverage it may not be truly optimal to sell out… I just rather hold value long term, protect myself with some options and trade systematic high frequency intraday and sleep well at night.
Chose one system. Stick to it. Do not be a Yale student. Be a trader.
http://www.streettalklive.com/daily-x-change/1560-there-is-no-asset-bubble.html
The most interesting thing is that in 1929 there were no articles talking about a bubble. Now you have fear all over still. I think all markets are a big bubble and prices rise until the last buyer has bought then it will fall until the last seller has sold.
Hi Robert,
That kind of retraces/drops in the stock happen every so often, regardless of the sunspot numbers. If we take a long term stock market chart, then we find very few years without some kind of noticeable retrace/drop (can be 10% – 20%).
2010, 2011 and 2012 all had that kind of drop along the way.
So, if we get another one this year, then does it make sense to credit(or blame) the sunspots for it?
I agree that from long term investor perspective it is better not to worry about these corrections. To sell just before a drop and then get back in at lower prices is not always as easy as it looks. Not rarely one is simply left behind, or forced to buy back in at higher prices..
Market has gone up almost 20% since November. So a lot of people are calling for an imminent correction. We will get one eventually. But I think there are still a lot of investors who have missed out on the stock market rally completely, and feel increasingly stupid holding bonds that yield 2 or 3%. That’s the new buying that comes in every time we have a few days drop. That may not change anytime soon.
Danny, it is not sunspots per say but geomag that is the result of increased sunspot activity, the way I see it. Yes, it makes sense given the studies that even the Fed has done on geomag. It creates an edge. It makes more sense than any analyst on Wallstreet giving you a reason for this or that. Why do you think Renaissance Technologies focus on hiring Astrophysicists? Chose one strategy with an edge. Follow it. Do not change. The reason is irrelevant. Stop looking for a reason.
Thanks guys. I sense we are getting there at last towards a growthflationary finale – money pouring into stocks, yields starting to rise, the weak growth sticking and then the last piece should be commodities accelerating. Historically we need to see the froth and the tightening of yields to end the cyclical bull in stocks.
Robert,
I know that Atlanta Fed study and a link to their paper has been on my site for years.
But let’s not forget that the geomagnetic storm season typically peaks 2 years after the sunspot cycle peak.
Geomagnetic storms are only partially correlated to sunspots. Yearly geomagnetic storms have a 0.4 correlation to yearly sunspot number, and an even weaker 0.1 correlation between daily sunspots and daily geomag.
So, if you want to trade based on geomag, then it is better to watch the Ap index than the sunspot numbers.
Also, the “edge” that was found in that Fed study was very small. At the most it can be useful in combination with other factors.
Fun stuff: http://www.youtube.com/watch?v=tCcxr-fyF4Q
John,
Your timing of a June stock market top and Marc Faber’s timing are almost in agreement. Marc sees two scenarios. In one scenario the market corrects now then goes up further. In the second scenario the market goes straight up into a high in July-August then crashes. But if the market goes down, Marc would not necessarily buy into a rebound. http://marcfaberchannel.blogspot.com/2013/03/marc-faber-either-correction-now-or.html
Thanks Jack.
I have updated all the models today. The news is sunspots remain trendless and I continue to watch, whilst geomagnetism remains unseasonally tame, i.e. a positive, and so the geomagnetic lunar models remain in an uptrend, looking out to early April.
Excellent stuff John.
Thanks Danny. I more a value guy long term and statistical arbitrage trader short term and I have a lot to learn about the astro stuff but I like it ;).
Danny, just to add, that both what you and John are doing with your sites are admirable and I enjoy reading it. Originally, I come from a fundamental background (http://www.thegadgetmasters.com/2013/02/15/why-its-only-a-matter-of-time-before-the-blackberry-bulls-defeat-the-bears/ – I do this type of stuff – buy and suffer then win ;)) and then put computers to work to look at statistics and found short term stuff that worked for me intraday. I am going to do more research myself on the Ap values etc. as you suggested. What do you find the most useful?
Robert, it is always good to try to confirm ideas with some own research. Excel (or free gnumeric) are more than sufficient for this purpose. Ap index is the best source for geomagnetic data, and are available going back to 1932 on the Noaa site.
It is useful to have a fundamental background. As we know, fundamentals matter more for the long term, while for the short and medium term moves we have to study mood swings. Natural cycles like moon phases, geomagnetism, amount of sunlight (=seasons) , temperatures,… are candidate contributors to mood swings for which some evidence was already found in various studies. There is probably more to be uncovered in this line of work.
Hedge funds are long the least in commodities since 2009. That indicates a big rally which I havenot been expecting. But in a real bear market, even hedge fund bears can be right however unlikely.
Nasa has found water and habitability on Mars ;).