

Four years of the cyclical stocks bull (in certain indices) gives me four years of the lunar geomagnetic model. If I remove the lunar phase oscillation (up and down alternate pressure between new and full moons) I can show you the chart showing purely geomagnetism. To be clear this is daily geomagnetism made into a cumulative trend line, with a 6 day lag as per Robotti/Krivelyova research, and nothing else added.
First is the model versus the SP500. The waves in the two lines align well, with the exception of the period mid-year last year, which appears to be inverted, similar to the inversions phenomenon we see elsewhere, such as in lunar phasing. The tail on the geomagnetic line is the NOAA forecast covering up to 3 weeks into the future. Click to view in more detail:

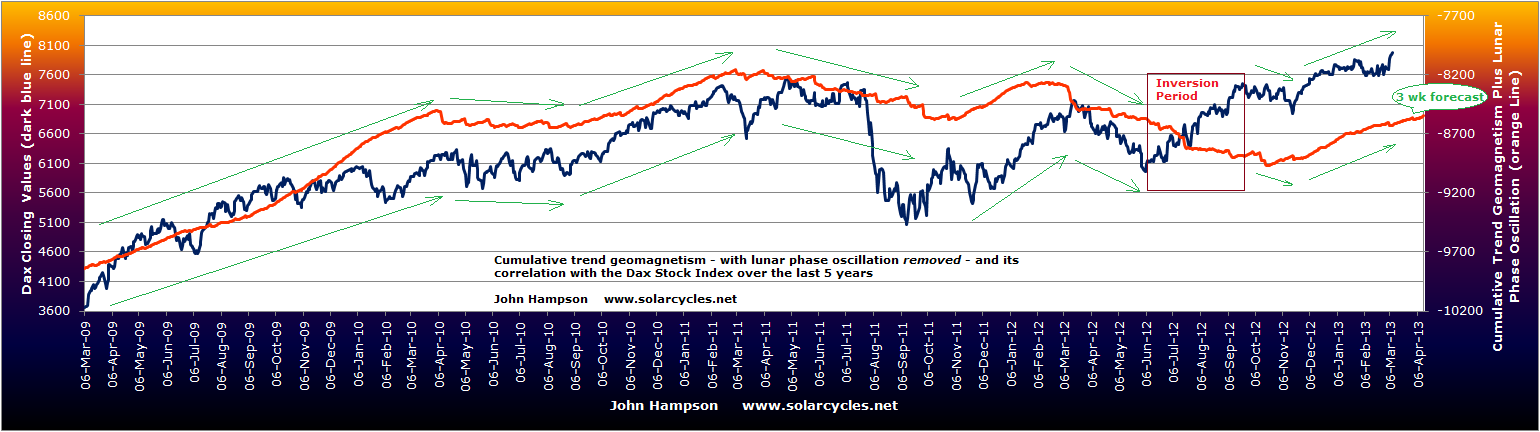
The second chart show the Dax versus geomagnetism, and whilst the Dax and SP500 have on occasions peformed differently, there is the same overall close alignment of the waves, with the same inversion exception last year.
The third chart shows the Reuters Jefferies commodities index, which again has gone its own way at times compared to the stock indices, but nevertheless the waves align well again, and the single exception period is the same.

Levels of geomagnetic disturbance in the atmosphere has been shown to impact human mood. If changes in mood subtly affect the collective behaviour of market participants then we might expect to see some correlation between risk assets and geomagnetism. I believe the above charts are good evidence that this is the case. Yet, I know of no-one else who runs a geomagnetism model and I can count on one hand the number of analysts/sites out there that track geomagnetism to use in their trading toolkit. Maybe this is more widely followed than I imagine, but it is not promoted as it would not sell to clients – I don’t know.
If the model fails badly going forward, then I will not be defending it. But looking back at the chart from the Peak v Peak page, showing geomagnetism versus the SP500 around the last secular peak, there appears to be more historical evidence that it is influential. I again have removed the lunar oscillation and show you the alignment of the waves. Once again there is a single period where the model inverts with the market, and in this case lasted around a year.

So how might we use this as traders and investors? I don’t see a way to parcel this up into a repetitive trade. I suggested in my Trading The Sun pdf that trades would present themselves when the market moved away from the model. But there are times when they don’t come back together for some time. I therefore suggest that it is better to follow the general path of geomagnetism, and use it as a guide. Occasionally there may be a period of inversion – for reasons unknown – but largely it should be a useful guide. To this end we can use the 3 week forecast to look ahead, and the seasonal model of geomagnetism that shows us how historically geomagnetism tends to flare at certain times of the year more than others (whilst understanding that occasionally we may see unseasonal behaviour). I therefore rate geomagnetism as an important tool to use along side other market disciplines.
To the markets. I am staying put at the moment, still expecting commodities to start to outperform stocks, and weighted accordingly. CB leading indicators for Japan and Spain came in strong. OECD leading indicators for OECD countries came in strong bar China and India. Leading indicators as a whole do not show degredation, which I would expect for a cyclical bull top. Breadth remains supportive in equities. The SP500 is within a few points of the 2007 high and I expect a touch. This is roughly where Tom De Mark expects a swing top. If we can push up to there this week I may take off some equities profits. I have hope at this point that we are headed for yields rising, inflation rising and commodities making a belated push to help tip the world into a mild recession into 2014. These are all features of how previous cyclical bulls have ended, and until now (since 2009) we have not had enough sustained growth to get us to that point. If global growth can persist a little longer, then more money should pour out of treasuries and into pro-risk. We need froth and excess and growthflation to end the cyclical bull if we are to align with history. Before reaching the cyclical bull top, a pullback in equities would be normal, followed by a higher high with divergences. Should such a pullback occur, we should see commodities becoming the target of the money flow and advancing despite equities. This is all as per history – anomalies can occur – but that is my primary scenario.

As you mentioned now and then Stocks and Commodities are not running the same track. From 1996 – 1999 Stocks outperformed Commodities. 1999 – 2003 Commodities outperformed Stocks. 2003 – 2012 was running almost identical track. Now Stocks outperform Commodities again:
http://stockcharts.com/h-sc/ui?s=%24SPX&p=M&b=5&g=0&id=p10885789118&a=251788917&r=1362775213137&cmd=print
Thanks Niels. It is historically normal for commodities to peak after stocks, so the reversal in performance should come – unless we are in for an anomaly this time. Hurst is a source for this, plus it can be seen this happened in 2007/8 and 2000.
It would be interesting to have a discussion on both lunar inversion and geoinversion. Any correlation with something?
Personally, I think the term “phase inversion” has become overused in cyclical stock market work. It has become a convenient euphemism for saying: “our cycle didn’t work out here”.
I think it is perfectly OK for any system to fail from time to time. As long as something works more often than not it is useful.
Do we need to call it an inversion every it doesn’t work? I don’t think so.
I have covered inversions on this site before -https://solarcycles.net/2012/05/22/cycle-inversion/.
A few potential reasons were circulated in the discussion, but just speculation.
I hear what you are saying Danny, and I would have been happy to just say it didn’t work in those boxed periods – after all this is just one sentiment influencer and I would expect other factors and other sentiment drivers to sometimes dominate it. However, the 2001 box appears to be a clear ‘opposite’, suggesting it was more than just driven out of the picture, and 2012 looks too.
Btw great work.
Thanks Robert
Thanks John – a really great post! Superb research.
I’m wondering if the inversions on the S&P and DAX could have anything to do with the equinoxes, as the inversion period roughly correlates with the period between the summer and autumn equinox in 2012: Jun 21 – Sept 22? It doesn’t explain it, but it may be part of the solution.
Thanks Rob. Interesting idea, but 2001 lasted the full year.
An Enigma, the inversion periods. I asked you, John, about that some time ago, is rare, may be something special that occurs against the natural forces, like the 11-sept-01 or de FED in last summer?
Is possible to see the chart from 2002 to 2009, John?
Thanks and nice return to the UK, you can have a break in St. Sebastian, is 1 hour flying from London City.
Thanks Antonio. I would repeat my above comment that I would expect it to fail sometimes, because it is just one influencer of sentiment. I need to expand my data sheet on my return.
I think there are more market participants who use some “natural” ingredients than we imagine.
Larry Berg has been selling a system that shorts the market whenever geomagnetism goes above a certain level. You can find it here, bottom half the page, The Berg Blaster: http://www.justgoodtiming.com/id53_blaster_1.htm
And I think Al Larson (http://moneytide.com) is also using it, since he has written an entire ebook on the effects of magnetism on the human body.
While your 4 year chart looks promising, I would test the formula on a much longer period of 60 years or more. That would give the long term correlation.
Also, the chart says you have removed lunar oscillation, but more important would be to remove the known seasonal variations to make visible what is the effect of the geomagnetic storms themselves.
Thanks for those links Danny. Yes, it’s just a tentative model at the moment, more work to be done. Regarding seasonals, if I understand you correctly, you are suggesting removing seasonality because the seasonality of geomagnetism closely aligns with the seasonality of the market (I suggest the former is the reason for the latter – page 11 of my PDF). However, of the last 4 years only 2011 was a particularly seasonally-normal year. The others didn’t fit the seasonal model particularly well – yet the geomag and market waves still match well.
I doubt that seasonality is driven by geomagnetism. That would call for a bi-annual period of weakness around the equinoxes.
While the weakness in autumn has been observed in many markets, similar weakness in March-April is much more rare.
The Nasdaq seasonal chart actually shows some weakness in spring, but if you go to the source you mention, seasonalcharts.com, then such weakness in March-April is completely absent from the seasonal charts for most countries.
See: http://seasonalcharts.com/indices_laender.html
In fact, in a lot of countries the March-April are the strongest months of the year.
In the Dow Jones and S&P 500 seasonal charts, no weakness in March-April is seen either.
I think Kamstra is right in identifying weather/hours of light as the main driver of mass mood. That can be found in another Fed study: http://www.frbatlanta.org/filelegacydocs/wp0213.pdf
I would say that geomagnetic storms in spring are quickly forgotten, because the hours of light and thus general mood are on the up. While when there are geomagnetic storms in autumn, then people may get more depressed from them, because sunlight and mood are on the way down already.
Does anyone have a link to stats current and historical about funds flow to various asset classes? Would be interesting to look at in conjunction with the model.
I don’t, but it’s a nice idea.
Danny, what is the threshold Mr Berg uses? I have been playing around with those ideas for a while i.e. what I meant about the Fed study. Cheers
I don’t know what parameters Berg is using for going short based on Ap index. Maybe it can be derived from the chart he posts.
He refers to the Fed study paper, and that paper they use Ap > 29 as the threshold.
I had another thought after reading some of the stuff Danny posted and some Gann stuff and that is that Gann would monitor his own psyche each day. All edges aside, I think this is something to start doing. The question is just how to do it. Any ideas?
Since I became a convert to both geomag and lunar sentiment influence, it’s something I am careful to monitor. Following a geomag storm, or around the full moon, it’s possible you may feel more pessimistic or negative, and vice versa, so by tracking both you can at least have it mind as a personal check.