
…I will be in a motorhome, touring NZ North Island, so internet access is going to be occasional and fleeting. So an update and roundup on the markets below, and I will post in the comments beneath it anything important in that period. After New Zealand it’s Abu Dhabi for a week, the last stop on the trip, before returning to Europe.
Let’s start with gold. Major extreme readings were reached last week in oversold and overbearish measures, in both gold and gold miners, many more extreme than in the 2008 sharp falls. I won’t reproduce them here, as many blogs and sites have shown them, but it was sufficiently extreme for me to add to both gold and miners last week as declared. Gold has since rallied away from those extremes and therefore in price, and whilst I don’t know how it will shape technically from here, the key question is whether its secular bull is over and ended in 2011 with silver’s parabolic rise and fall. So here is gold since the start of its secular bull in 2000, measured in all the major currencies. It should be clear that gold has tracked sideways since 2011 and has consolidated up high, whichever currency it is measured in.
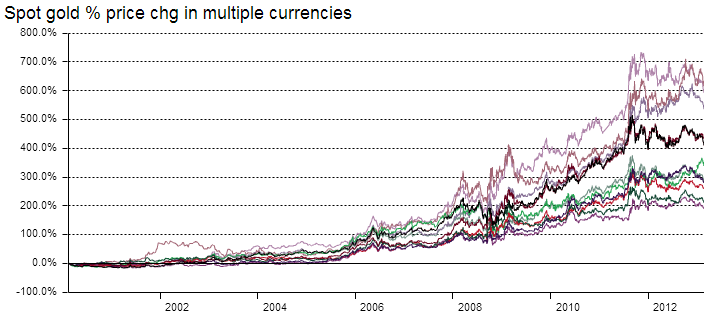
Source: Gold.org
As a parabolic excessive-greed finale is the norm as a conclusion to an asset secular bull, and as gold is the leading asset in a Kondratieff winter (which we are concluding), I would give good odds to gold finishing with a blow-off parabolic. A comparison with gold’s last secular bull, below, shows that blow-off parabolic clearly and how gold’s secular bull this time has been fairly measured to date.

Source: Nowandfutures
I am not suggesting that gold has to shoot as high as the comparison suggests – only rather that some kind of excessive exuberance would be a normal end. So, the lack of parabolic ending move in gold yet, together with the high sideways consolidation when the whole secular bull from 2000 is viewed, give me a couple of reasons why I believe we have been seeing a final washout of weak hands before gold breaks higher. However, I await supporting evidence such as from sunspots breaking higher (to confirm the solar peak is ahead), commodities starting to outperform equities, and inflation picking up. This is how sunspots look:
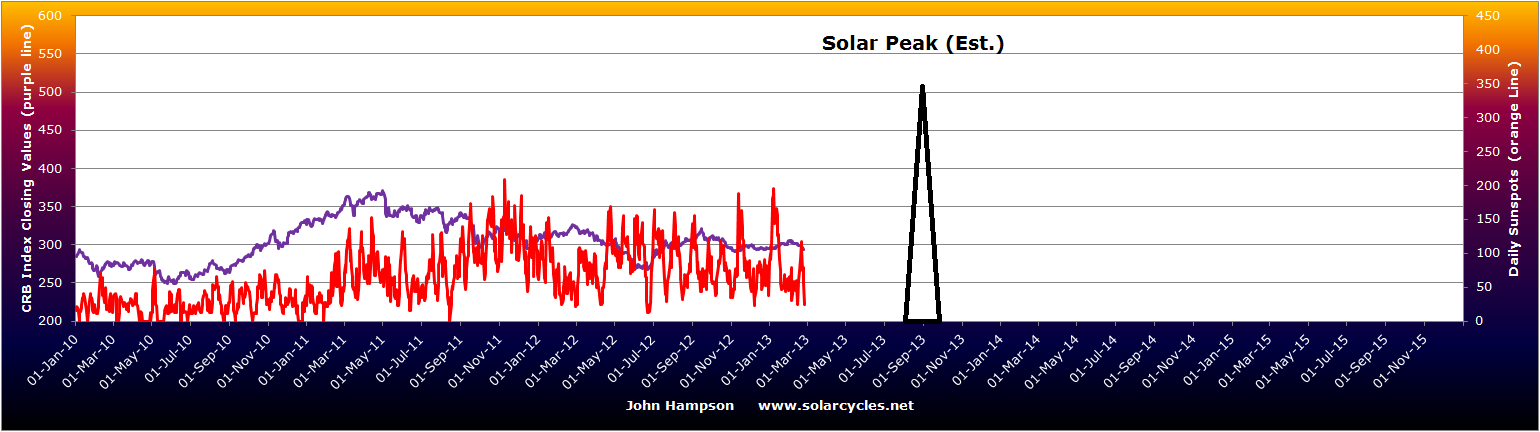
There is a mess, rather than a trend. If the solar peak is ahead this year, which remains the most common forecast, then we need to see daily sunspots register over 200 to make the uptrend clearer. So I am looking out for that.
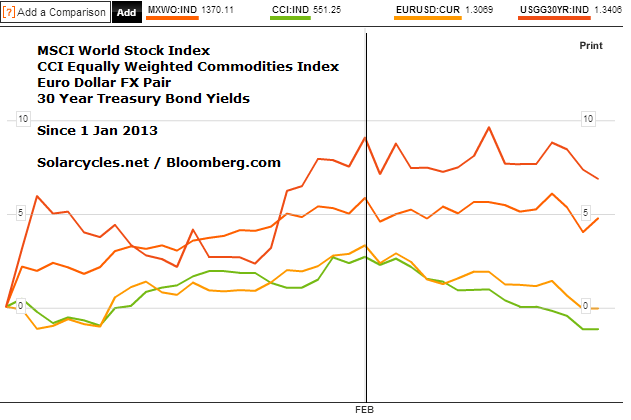
Since my last post on the markets it has become clearer that pro-risk did begin a correction at the turn of January into February. The chart below combines proxies for stocks, commodities, risk-safehaven FX and treasury bond yields.

I suggest there are two paths forward, both of which eventually will see equities return to their highs, in order to deliver a negative divergence top (price advances but internals weaken). The first is the five-models-in-alignment path, which suggests pro-risk may pull back into March before advancing again. The second is that pro-risk is only making a normal lunar pullback, into yesterday’s full moon, and will continue upwards over the next few weeks, for a Spring swing top. This option is supported by cyclicals as a leading indicator, and my geomagnetism model shown:

The tail on the model stretches out into the end of March and remains in an uptrend due to unseasonally tame geomagnetism (actual and forecast). The oscillations within that are the lunar phase pressures.
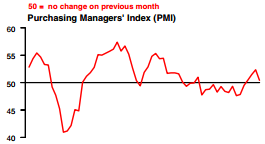
There also remains a fairly benign macro-economic environment, which should support pro-risk, although we should always be alert for early warning signs of a change, and we could potentially have this in the latest PMIs.
China PMI, US PMI and Europe PMI in order below:

 Source: Markit
A droop in the latest data, but still positive in China and the US.
Meanwhile, economic surprises show unclear developments in both Europe and the US, but using oil prices as a leading indicator for the latter, a topping out in this measure may occur in Spring.
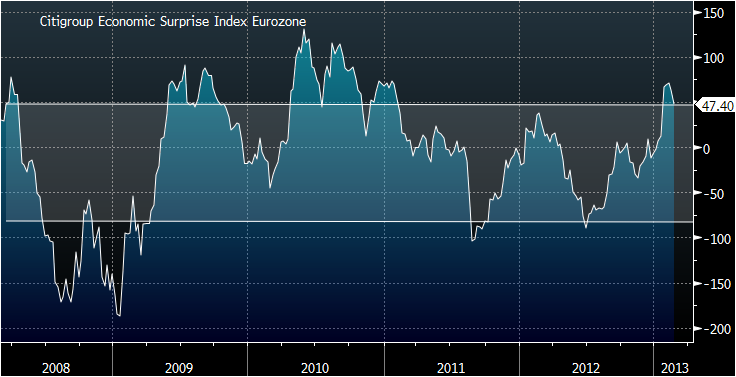
 Source: BrokenMarkets / Citigroup
US earnings season is pretty much over, and the final results in both earnings and revenues were good, and supportive for equities.

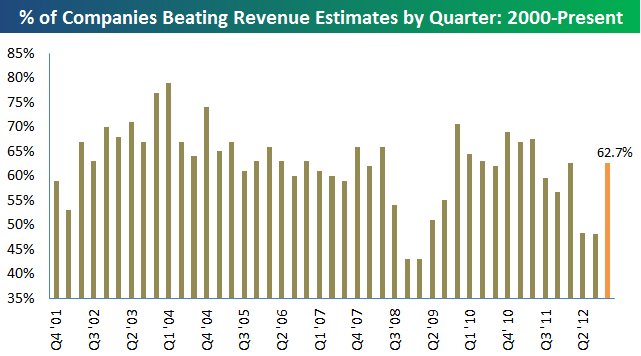 Source: Bespoke
The latest Conference Board leading indicator data table looks like this:
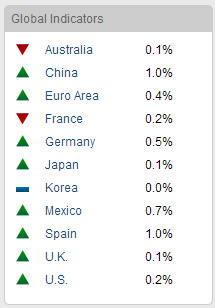
Source: Conference Board
Since my last market post, readings for China, Germany, US and Mexico all came in positive. The table is healthy, for now.
In summary, the picture between leading indicators and economic/earnings data is fairly supportive for pro-risk for now, unless that droop in PMI readings becomes wider weakness ahead.
There is bearish sentiment towards sugar, coffee, wheat, corn and cattle currently, as well as the precious metals, and I would add to commodity positions if we saw improved evidence of a secular commodities peak ahead, namely those developments listed above. Until that becomes clearer however, I am playing it safe and sticking largely with what I have, as both the primary (secular commodities and solar peak ahead) and alternative (secular and solar peak passed) scenarios remain in play.

I must say one more time: THANK YOU.
I’ve read Gavin who predicted this fall on Gold in August ’11, but I heard also a Peter Schieff which is genius for me or I should say very reasonable man, also predicted based on his experience that Gold will fly away to 1800 and more. What I think is veeeery possible.
grzegorz314 who is Gavin
In my opinion there is a big chance that we’ve seen the secular peak in commodities already, and we’ll break last year’s minimums for gold and silver.
I live in Abu Dhabi if you need something.
Good day John, I live in New Zealand, in Mangawhai Heads, which is about 1.25 hrs north of Auckland, on the East coast. I have an excellent Internet connection at my home office and shall you need Internet access it is here for you. Or if you have any travel / things-to-do questions I may be able to help. I have been following your blog for a long time and have found your writings to be inspiring and educational. Would be great to meet you if you’re up this way. Cheers, Cesar. PS. For information on my area: http://magicalmangawhai.co.nz
We will see if the theory works. Holding gold and silver exposure out of the money options. Somewhat concerned that Soros is cutting his gold holdings. He is often spot on. For equities I believe we will retrace some more but then we continue until summer peak. Keep the crash hat on.
It’s always tempting to try to catch a falling knife. In the case of gold, I am not convinced the bottom is in until we see a close above $1630, which was a major support level. If it gets back above $1670, then I will buy. That’s only some 5% above the current level. And that 5% is not work the risk of a further drop to $1400 in my opinion.
If gold stalls just below $1630 in the coming weeks then I will probably buy some gold put options.
Apologies if the image in the link below appears tiny. I’ve indicated a price pattern with the two red rings. The first image shows the DJIA in the midst of its 1982 rally, whilst the second shows the recent price action the FTSE 100 has been going through since 2010. Does the repeated pattern indicate a sharp surge upwards soon?
http://twitpic.com/c7b0bg/full
John, I thought this might be of interest…solar cycle 24 to double peak, like solar cycle 14 (turn of the 20th century!), in late 2013 and then 2015.
Solar cycle 14 preceded WW1…am I reading too much into this?
TDL
That’s what I was trying to say last month in my comment on the “alternative scenario” topic. This solar cycle will remain confusing until well into 2015. That’s what you get in these very weak cycles, a number of sunspot peaks, any of which may turn out to be the actual peak in SSN.
So interestingly, NASA is now also putting the year 2015 on the map already. Their complete article is here: http://science.nasa.gov/science-news/science-at-nasa/2013/01mar_twinpeaks/
Typically NASA is one of the last to update their forecasts (because they rely on votes from a panel), just like the Fed is always the last to announce that there is a recession.
By the way, several measures of solar activity continue to behave as if the peak is behind us already. See: http://wattsupwiththat.com/2013/01/09/december-solar-activity-in-a-big-slump/
The “science” on this isn’t going to be settled anytime soon.
I wouldn’t read too much in SC14 preceding WW1. That war actually came in SC15.
If you want to compare with SC14, then you can perhaps look into the great earthquake in San Francisco 1906, and the banker’s panic of 1907
http://www.technologyreview.com/view/423417/sunspot-cycle-is-double-peaked-say-astronomers/
A bit more info on the “double peak” phenomenon
TDL
Hi darklord,
Very interesting.
That means traders will become irrational twice.
An all time high and a test of that high .Makes sense.
Regards
bob
http://www.solarham.net/planetk.htm
Solar activity picks up right on cue…beware the Ides of March?.
Stock market correction probability increases this month IMHO. But, likely the coming correction sets us up for a final high Q3/4?
Will gold catch a bid here?
http://kingworldnews.com/kingworldnews/KWN_DailyWeb/Entries/2013/3/1_Hathaway_-_The_Most_Important_Gold_Chart_You_Will_Ever_See.html
The second chart showing the COT speculative short contracts caught my attention.
TDL
Hi all, it’s been wild camping on the whole, hence no internet, so accordingly been having a break from the markets. Motorhoming concludes on Saturday, so will do a proper update next week from UAE. For now, just a quick note as I get an hour’s internet.
I’m making no trade changes currently. Dow Trans has made a new all time high. Breadth remains positive for NYSE. The Nikkei is still in a steep uptrend, a precarious trajectory but as yet no technical break. Various commodities remain at bearish sentiment levels, due an up move. An updated geomagnetic lunar model would have weakened slightly looking ahead, but still is suggesting pro-risk ought to hold up into the start of next week (new moon). The global PMI reading shows expansion for the second month in a row, though not as strong as last month. Sunspots back over 100 currently.
Interesting comments and links above, thanks, will address next week.
http://moneymorning.com/2013/02/28/the-looming-gold-production-cliff-that-will-drive-prices-higher/
Hi wxguru
And how are we going to earn a living between now and 2017?
Buy and hold?
Bob
Hi All,
Looking at the markets today you’d be forgiven for thinking that we are not even in a bear market! But as investors focus on stock markets making new highs, Dominic Picarda (from the Financial Times and Investors Chronicle) discusses with me why it pays to keep an eye on longer term stock market cycles and why the bear market is about to make a comeback in 2013.
http://www.investorschronicle.co.uk/2013/03/04/comment/the-trader/video-stocks-next-mega-bull-market-Egf2ZdBaH06W71SKoPsHTN/article.html
Regards,
Kerry
Nice to hear from you, Kerry, you studies the Cycle in the same way than me, I expected the highs for the Dow Jones in 2012 and the starting downtrend into 2013, but the Cycle is lagging by the FED.
Hi Antonio Pérez Algás,
Good to hear that we are aligned. I should have mentioned that my book is available from amazon:
http://www.amazon.co.uk/17-6-Year-Stock-Market-Cycle/dp/0857192736
(Ignore the description is is wrong and is being fixed.)
Regards,
Kerry
Seemes very interesting, indeed. I saw your interview and i concur with all the ideas you mentioned. Did you expect the peak of the US markets last summer? For me is a suprise the uptrend from agoust-sept.
Hi Antonio,
I expected a peak in early 2011. The rally from Aug 2012 was indeed a surprise but I am execting a low in 2013 and it looks promising.
Regards,
Kerry
IPS Australia just sent out their updated forecast for solar cycle 24 and they now suggest that the cycle already peaked: http://www.ips.gov.au/Solar/1/6