
Gold, silver and gold miners are at extremes of oversold and overbearish readings, with possible high volume capitulation candles on the last day of last week. Mean reversion should now follow in the form or either a relief rally to work off these conditions or the start of a new upleg, but first we need to see a turnaround and some buying interest.
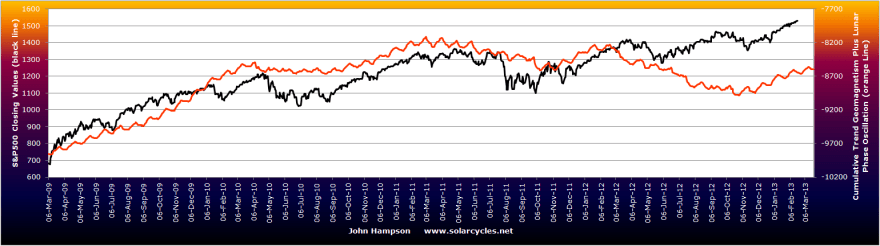
The majority of other stock sectors, aside gold miners, are overly bullish, and warning flags persist in equities, but without any technical break yet. Is the narrowing number of global stock indices making new highs a sign of a gradual top taking place since the end of January, or was that meagre correction only a blip in a continued advance into March? It’s not clear at this point, but here are two reasons why equities could potentially advance into March: cyclicals as a leading indicator and actual/forecast geomagnetism. So far this year actual geomagnetism has been tame and it is forecast to remain so into early March at this point – here is the latest model with the tail three weeks into the future:

Only in June-September last year did US stocks diverge particularly from the cumulative geomagnetism model and whilst that divergence gap has not been repaired, the market direction has since been following the model direction again.
If equities are instead in a correction that began in late January, with a couple of laggards about to turn and join (e.g. US indices), then I can refer you back to five models in alignment, and would also point to the current narrowing wedge in treasury yields which could suggest a switch to safety and away from pro-risk is coming, if yields break down:
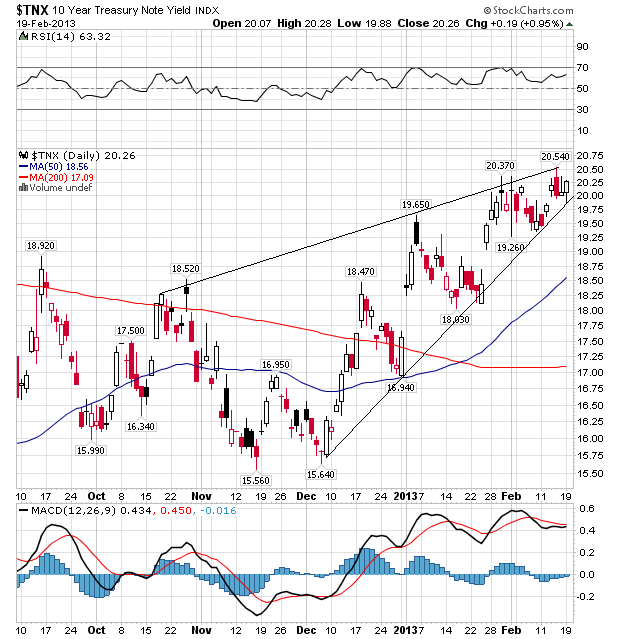 Source: Stockcharts
The latest leading indicator releases from CB came in flat for Korea, +1.0 for Spain (improvement on last month) and -0.1 for Australia (also). Commercial loan data for China showed quite a jump in January. US earnings beat rate for this quarter came in at an impressive 64% beat rate both in earnings and revenues. Citigroup economic surprises have turned up again in the US:

All in all, a continued positive environment persists for pro-risk assets and any pullback at this point should be as a result of excessive bullishness rather than a deterioration in the macro picture – at least until that changes.
I have no further evidence at this point to validate or invalidate the primary scenario (secular commodities peak and solar peak ahead) or the alternative scenario (secular commodities peak and solar peak in the past), but I expect we will see decisive evidence one way or the other within the next couple of months.
I am leaving Australia on Saturday and coming to Auckland NZ for 3 nights, before motorhoming around the rest of the North Island for 10 days.

I’m always surprised (despite of my knowledge) when I see that we are just a small tiny part of a BIG Picture and if You want to see the bigger picture You must look at the sky :)) THank You for reminding me what is REALLY important !!
Thanks grzegorz
hello John, gold from the technical side supporting 1557-1585 in the zone has, however for silver it is appropriately 27.15-28.35.
http://www.13ausum.blogspot.com/2013/02/gold_13.html
Thanks Jarek, we are pretty much there now.
Hi, John, Is There any expalantion for the last summer divergence btw Us markets and the Geo+lunar phase? Can the Federal Reserve make a distortion in the markets forcing Indices? Thanks and nice end travel.
Hi Antonio, geomagnetism affects human sentiment, and it seems plays a key role in the markets, but other things influence human behaviour in relation to the markets too obviously, and like any other valid influence I guess it may sometimes be overruled by other factors. So what was special about that Q3 last year? My best guess is it fits with when the euro bond yield and cds accute crisis was finally deflated, in that the ECB finally did enough to satisfy the markets, and so stocks got a siginificant relief rally.
OK, I have added to gold around 1561 and have added to the gold miners ETF position too. Gold has hit a daily sentiment of just 6 (out of 100), and a daily RSI at the time of writing of 19 (not got so low in its entire secular bull), and gold miners have likewise hit an RSI not seen even in 2008. If only for a relief rally, I see this as a good opportunity here. But I suspect this is pushing to extreme as a final flush out of weak hands before its secular finale.
There are two short-term headwinds for gold. Monday is Comex OpEx and as of the 20th the max pain of open interest was 1545-1550. The second hindrance is the LTRO on Friday March 1. This is when LTRO2 paybacks will first be accepted. If the paybacks are significant, as were those the first week of LTRO1 paybacks, then liquidity for everything, including gold, will be diminished. Plus there are banks who bought gold with LTRO2 cash who may sell the gold upon repayment. Also $173 billion in Treasuries settle on Feb 28 which diminshes overall liquidity.
I’m long gold and North American miners but will probably sell some before the 28th and look to rebuy plus add starting the week of March 4.
HI, John,
The important low in gold and silver is likely to come in April/May, as we entered unfovourable period in a 13.5 month cycle…May be we will make a low very soon, but corrective phase is likely to continue till late April/ Early May.
MCLellan financial and Charles Nenner Research centre all agree on that…
What is your “line in the sand” John that you will use to decide between the two scenarios ? I understand it won’t be as cut and dried as that but would like to be looking at the parameters on which you will base your decison.
Are you also visiting the South Island? I found it more scenic and less frenetic when I did what you plan a few years back.
Sunspots to reach a new high if we are heading to the peak still; Gold to break out upwards; Commodities to start to outperform stocks; Climate data to continue to come in as extreme in H1 2013; Inflation to start to advance; Or the opposite of all those.
Would love to visit south island but think the big nature and wide open spaces are better suited to an adults only trip – so another time.
Hello John,
North Island NZ is beautiful but don’t miss out on the South Island!
Thank you for you continued updates and great work
Rufus
Interesting news article about upcoming solar storms.
http://ca.news.yahoo.com/nasa-sees-monster-sunspot-growing-fast-solar-storms-003249636.html
Keep up the good work John. And safe travels.
You can easily monitor it here at # 02 (new spots come in from right side): http://spaceweather.inf.brad.ac.uk/fm/
Because of this the sunspot number is ramping up. Late last week there was a very low 25 sunspots, now we are well above 100.
Hi, again, John, is there any strom in your daily Geomagnetism model for this week, or following dates? Thanks
Nothing significant forecast for the next couple of weeks
The Italian election is on the 24th-25th Feb, with the coalition of centre left parties expected to beat Mario Monti and Silvio Berlusconi. The Italian stock market has already started getting jittery about it all, and Italian bond yields have begun turning up again. The next week will probably see USD strengthening, just like May 2012. Stocks will probably see a mild correction and precious metals may continue to correct sharply, with Gold possibly taking out the 2012 lows. It may be a catalyst which is enough to push Gold into bear market territory (20% below the 2011 peak).
Hi John Here is an interesting article and blog comments…… http://blogs.telegraph.co.uk/finance/ambroseevans-pritchard/100022953/golds-death-cross-is-a-buy-signal-for-china/#disqus_thread
http://www.mcoscillator.com/learning_center/weekly_chart/golds_triangle_objectives_met/?utm_source=McClellan+Chart+In+Focus+-&utm_campaign=0e6763d642-CIF_Gold_s_Triangle_Objectives_Met2_21_2013&utm_medium=email
Nice, but the question is: why did they forget to draw the larger triangle, which would point to a much lower objective (~1400) : http://lunatictrader.wordpress.com/2013/02/20/gold-on-the-brink-part-2/
The apex of the larger triangle comes at the end of March, which could be the bottom, or could be a rebound high followed by a longer decline.
If we make new lows after March 1st, then a longer decline would become quite probable imo.
In regards to LTRO paybacks, from ZH today: http://www.zerohedge.com/news/2013-02-22/euro-slides-first-ltro-2-repayment-less-half-expected
Thank you all for your comments and input.
John,
Have you looked at the profile of various solar cycles trough (or start) to SSN peak? Most run 3 – 4 years on average from start to SSN peak. If Dec 2008 was the start of solar cycle #24, then we are well past the 4 year mark as we entered 2013. Here is a comparison of the last three versus the current one.
http://www.solen.info/solar/cyclcomp.html
This site provides a profile of all solar cycles 1 – 20 as well.
http://www.solen.info/solar/cycl1_20.html
This site is interesting and suggests, without more solar activity soon, we’ve already seen the peak.
http://www.solen.info/solar/index.html
(scroll down to see the Monthly solar cycle data)
The caveat is this. Many of the cycles with weak sunspot activity, as we are seeing now, tend to run closer to 4 – 5 years from start to SSN peak. See solar cycles 1,5,6,7,12, and 16 as examples. Also noteworthy was the fact that I could only find one strong cycle that exceeded 4 years (from trough to SSN peak).
Of the past cycles #12 resembles the current cycle (#24) the best IMO.
It ran 5 years from trough to SSN peak. There is no doubt in my mind that whatever peak we see here for the solar cycle will match a peak in precious metals. With that I turn to gold.
Gold bounced precisely where it needed to on my Gann charts. The $1550 level comes up on this daily chart where the Gann fann held (price not updated). I’m still not 100% sure about what comes next for the remainder of the year. I am expecting a bear rally and a sharp bounce that ends in March or April. Cycles are looking bearish but we are right in the zone for 4 year cycle lows for everything in the PM sector. And sentiment is pretty much dire enough to match up with such a major cycle low.
What gives me pause is the chart below. I have kept this chart to myself for a long time. What is shown below is a Gold Fib expansion based on a yearly count. With the exception of the first year, every other turn has literally been to the month. So I have two Gann charts (daily and yearly counts) with a Fib count and turn date for Jan. 2014. The odds are much better for it to be a high. Based on cycles, I know full well that things can go quite wrong with that view. But it is something to be mindful of.
If we were to see a solar cycle peak say 5 years from trough to SSN peak, that would project to the same time frame ~ Jan 2014.
What I am thinking is that if gold puts in a “C” wave (price spike up) to finish this consolidation off the 2011 highs, it could setup a top for the turn projected in Jan. 2014. My guess is that it would be an unorthodox top, not a 5th wave blowoff. Worth watching.
cheers,
john
P.S. It would likely mean a bear rally for the gold miners, but no new highs.
I came across this article today. It adds more thought to the speculation of my last post. I look forward to hearing your thoughts John.
cheers,
john
http://science.nasa.gov/science-news/science-at-nasa/2013/01mar_twinpeaks/