History In The Making

1. Crestmont P/E valuation only exceeded at 1929 peak and in 2000:

18fe1

2. CAPE / Shiller PE / PE10 valuation only exceeded in 1901, 1929 and 2000:

18fe2

3. Compound annual growth rate since 2009 bull start only exceeded into 1929, 1937, 1987 and 2000 peaks:

18fe10

4. Q ratio valuation at major historic peak levels, barring 2000 outlier:

18fe4

5. Stock market capitalisation to GDP from Fed data second highest in history:

18fe5

6. Stock market capitalisation to GDP based on Wiltshire 5000 (the broadest and most comprehensive US index) equal highest in history with 2000:

18fe6

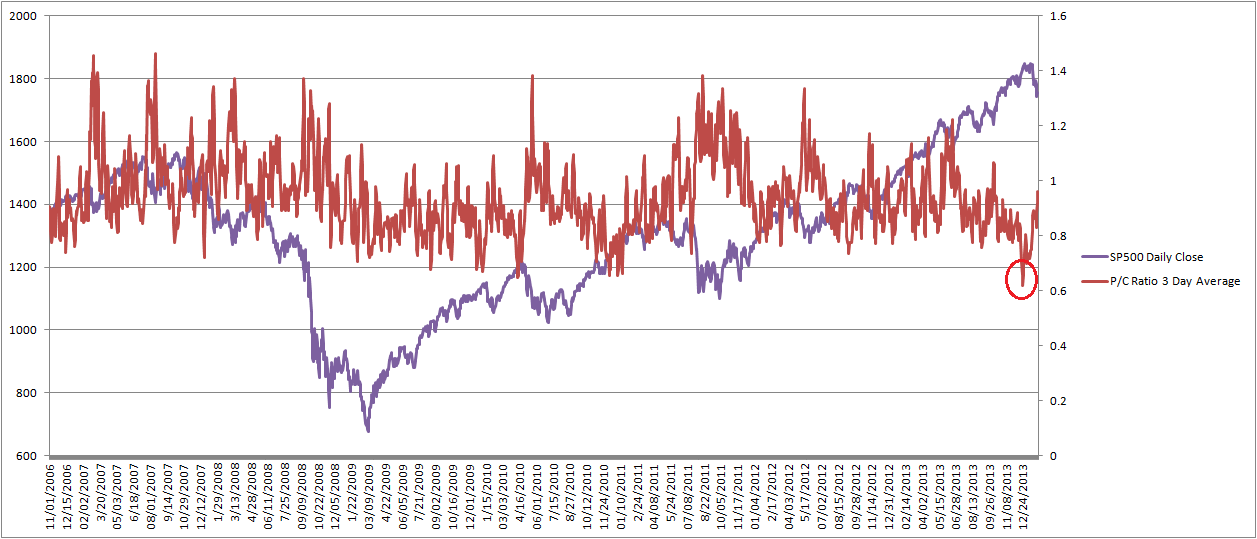
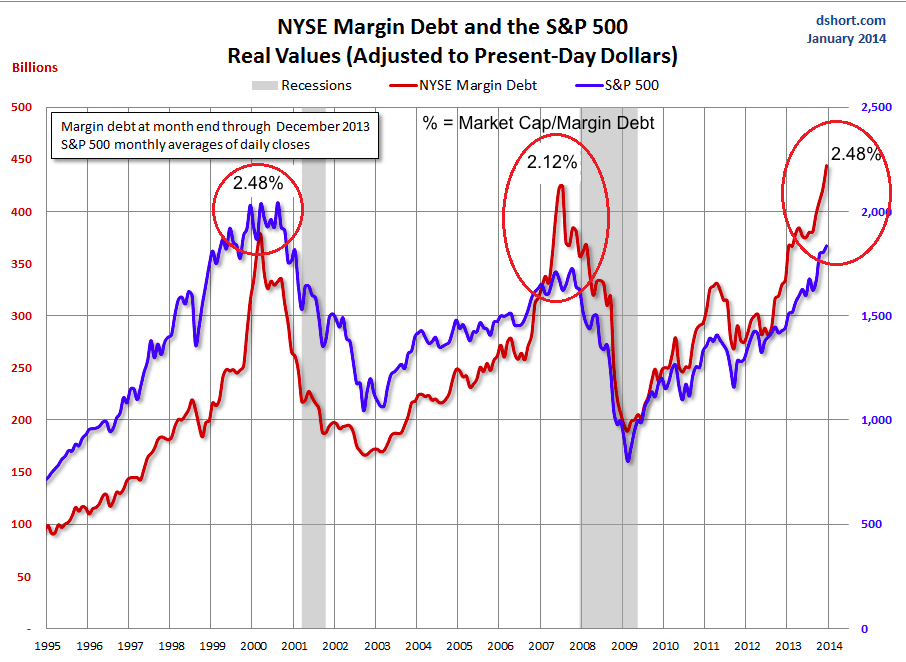
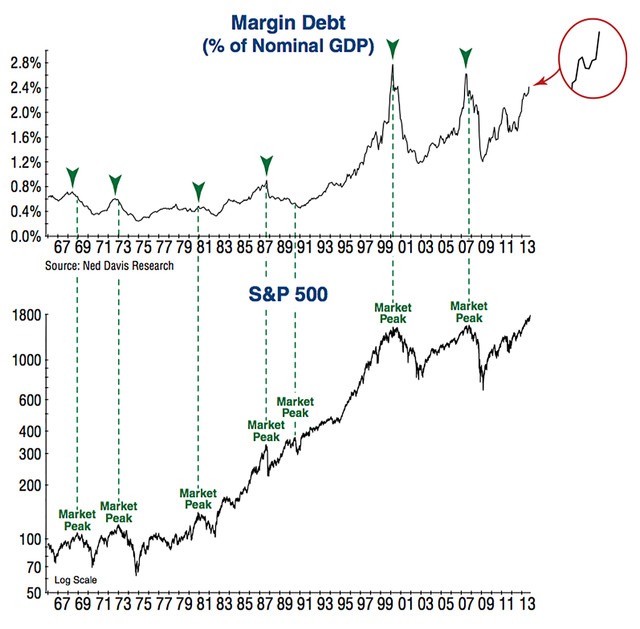
7. Margin debt as a percentage of GDP joint highest in history with 2000 (and net investor credit at all time low):

18fe8 18fe7

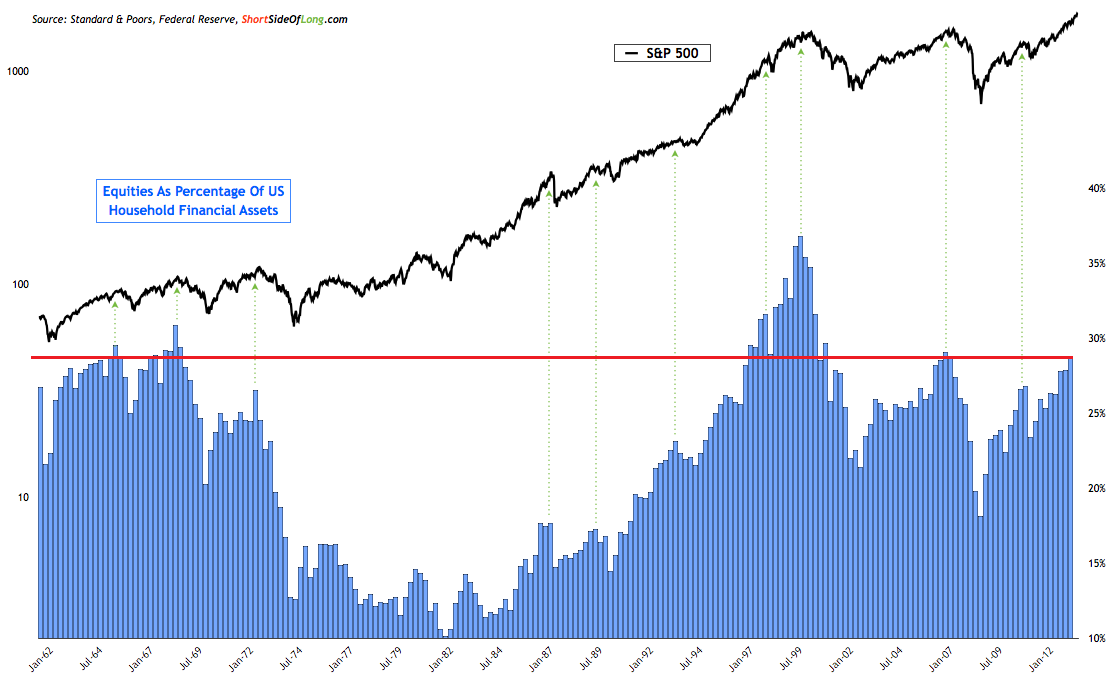
8. US household equities exposure at level of previous major peaks, barring 2000 outlier:

18fe139. Skew readings cluster highest ever:

18fe26

10. Panic/Euphoria second highest ever euphoria after 2000:

18fe12
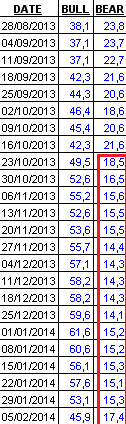
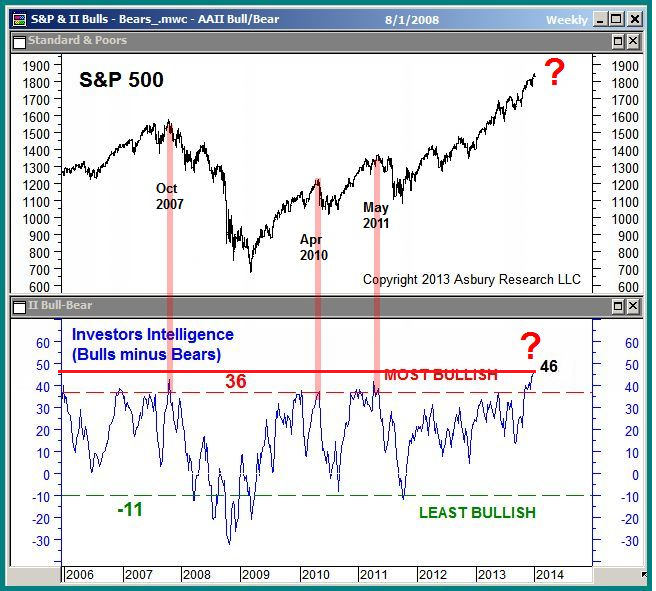
11. Highest ever Investors Intelligence bull-bear sentiment spread:

18fe11

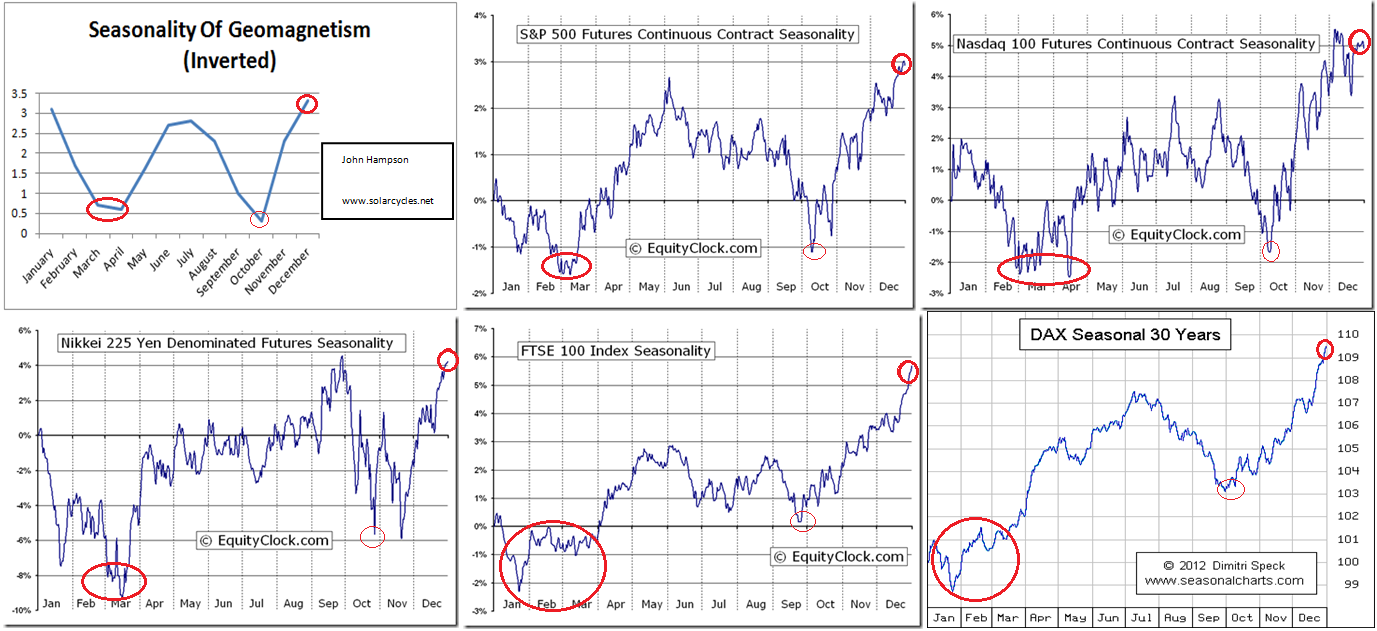
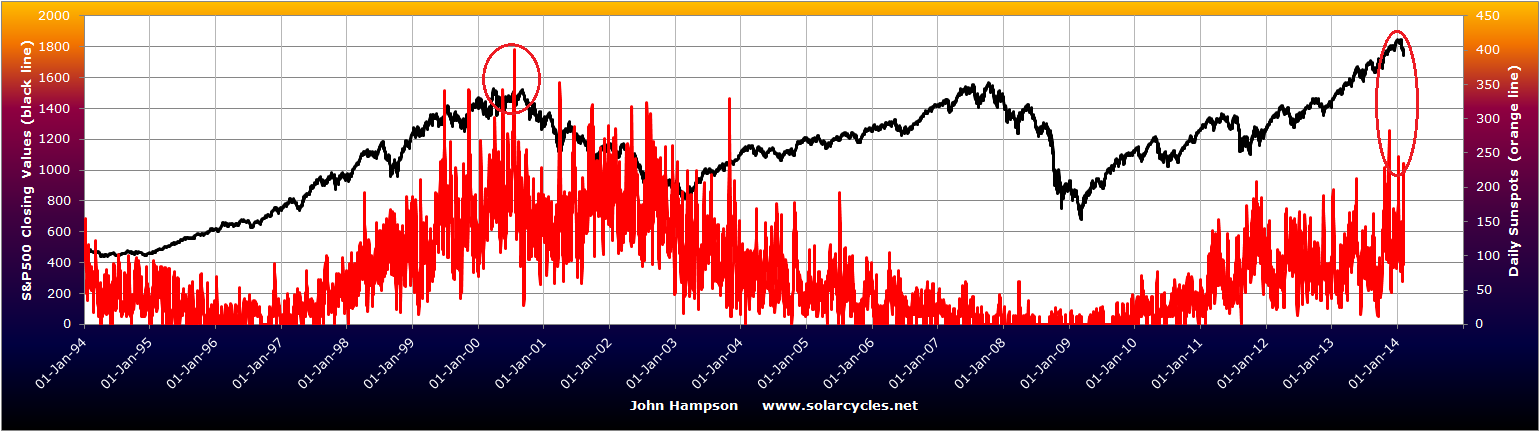
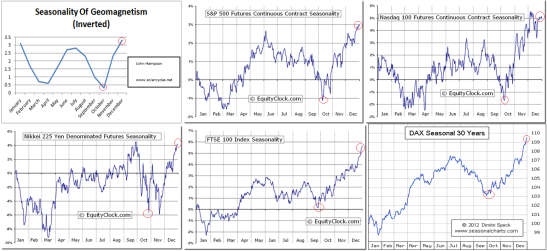
12. Sunspot, geomagnetism and lunar phase potential historic convergence:

18fe25

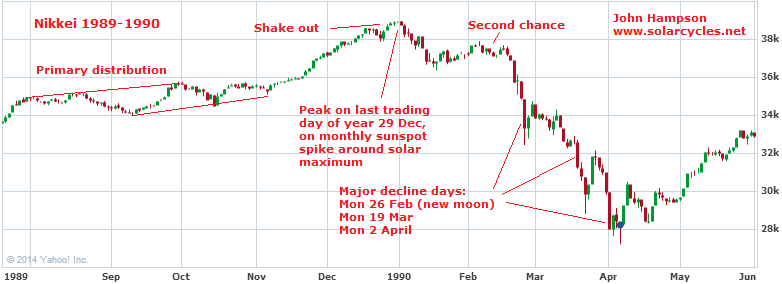
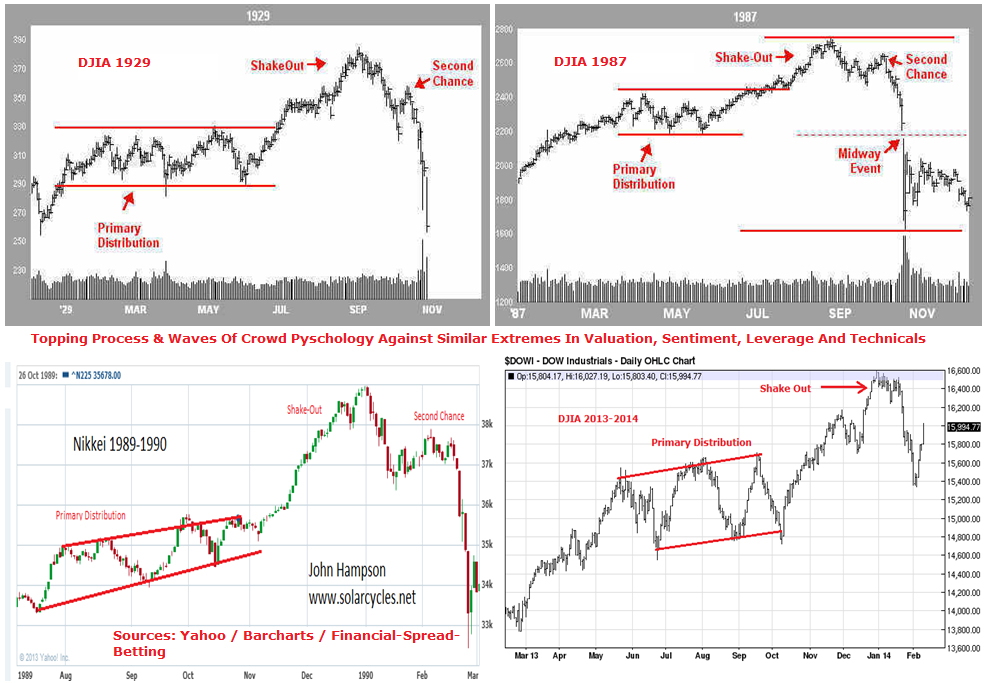
Solar maxima deliver speculative peaks but as these peaks in the sun’s activity occur only around every 11 years, we see cyclical market peaks in between. More often than not markets peak in the seasonal (inverted geomagnetism) highs around December and July, and within the month they typically fall close to new moons. If the Dow peaked 31 Dec 2013, the closest parallels as highlighted in the table are 1980 gold and 1989 Nikkei. Both these were secular peaks occuring at a solar maximum, at the turn of the year and close to a new moon. The Nikkei is particularly pertinent as it peaked on the last trading day of the year and led Japan into a period of deflation, which I believe awaits the US now. US deflationary recessionary demographics should break the Dow out of a very long secular run that has been in place from the 1940s to now.

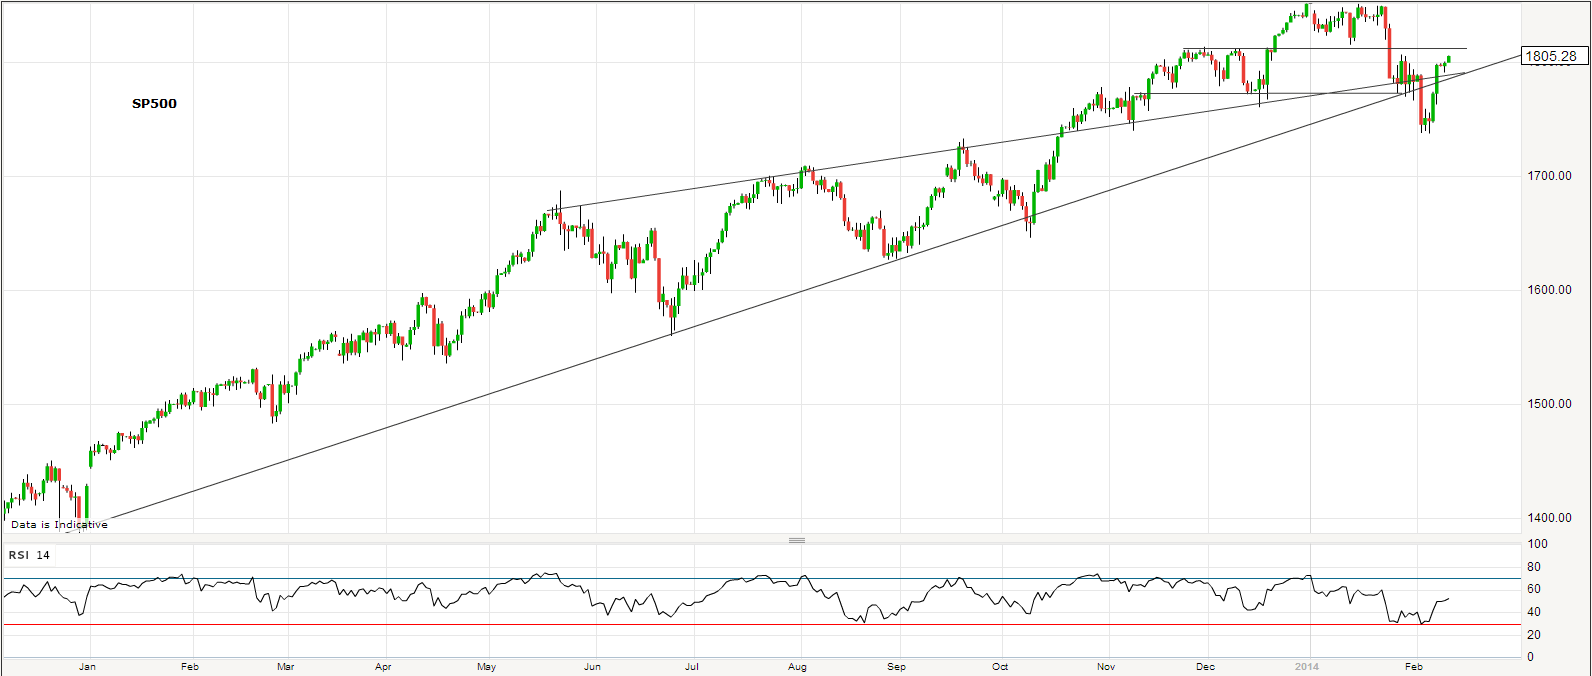
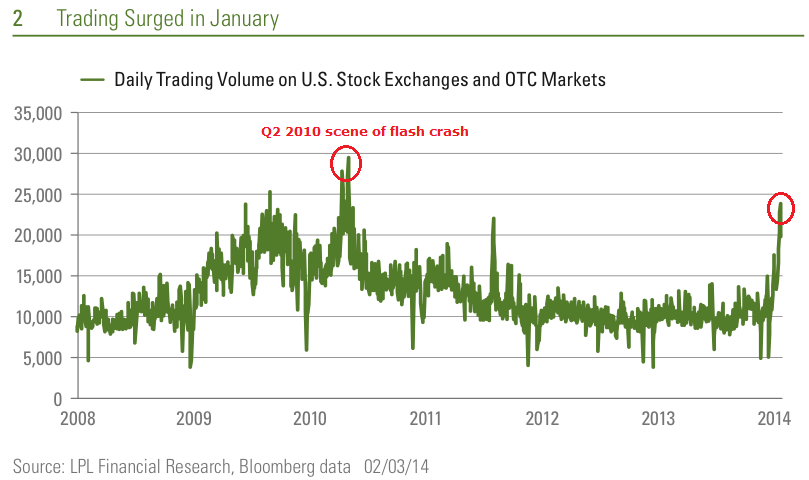
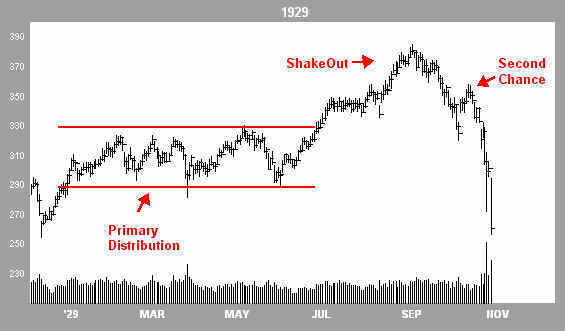
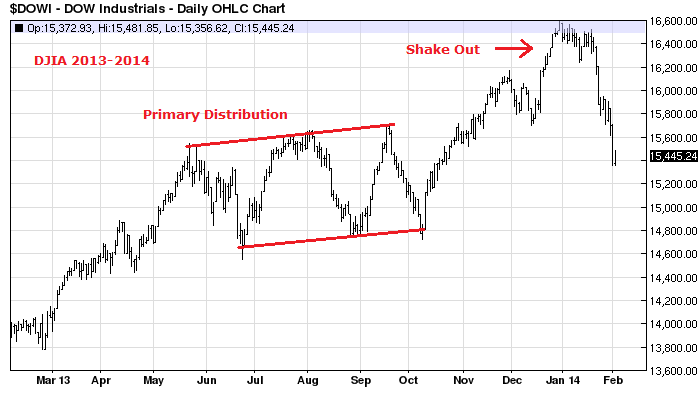
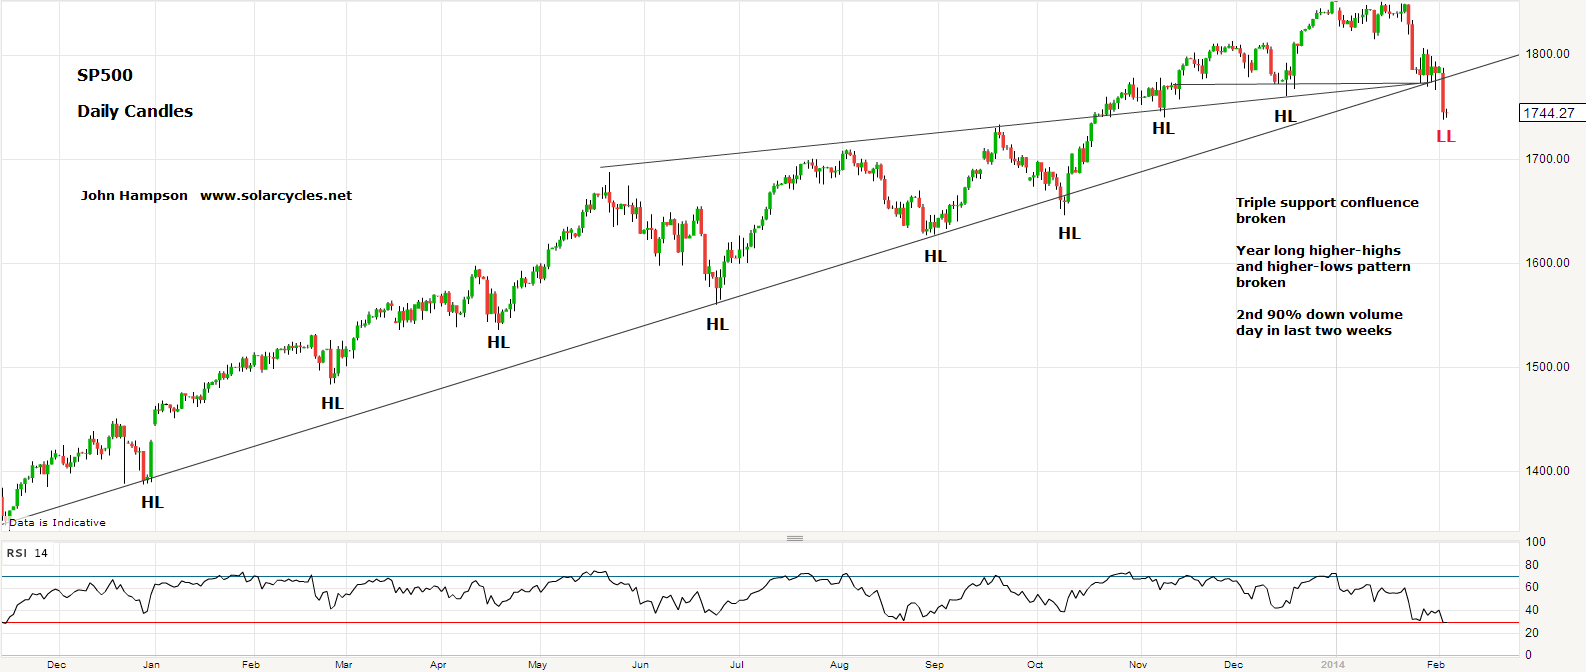
If the Dow and Nikkei did not peak on 31 Dec 2013, then the next new moon would be 1 March 2014, by which those indices would need to be at new highs. However, by that point we have moved into the (geomag-inverted) seasonal lows, and, based on current solar forecasts, gradually away from the solar maximum. The caveat to that latter point is if solar forecasts are wrong and we see a stronger sun in the weeks or even months ahead, making for a higher cluster of sunspot spikes. We might then look to the next seasonal high period of June-August and future new moons in looking at top-timing probabilities (note probabilities, as the table shows exceptions). However, the stronger case is for the 31 Dec 2013 top, and the evidence that has built up since then is supportive, including January spikes in trading volume and insider selling, 2014 money flows into treasuries, gold and defensive sectors and a downtrend in economic surprises. The last piece of the puzzle is for price to now confirm, with the Dow rolling over again this week, and in doing so adding a lower high to the Jan/Feb lower low, marking a trend change. Prices on the US indices hit technical targets on Friday, and volume for the rally remained divergent, setting up that roll over potential. We had a geomagnetic storm for the second weekend in a row too. However, we are clearly very delicately poised: either a definitive bullish breakout (with bullish internals) from here postpones a market top into the future, or we are at the top of the ‘second chance’ and staring at a major bearish opportunity.

Friday Morning Update

Yesterday was an up day for bonds, commodities, gold/miners, and equities, i.e. both pro-risk and anti-risk. Confused?

Retail sales came in weak, not just for last month, but for the revised previous month too. The string of poor economic data, in line with leading indicator forecasts of growth having peaked out, has resulted in progressive revisions to Q4 2013 GDP estimates – here is Barclays:

14fe7

Source: Business Insider

Q1 2014 GDP estimates have also been cut, with Credit Suisse reducing from 2.6% to 1.6%.

The latest picture for the Q4 earnings season shows blended revenue growth at just 0.8%, and of those companies who have given forward guidance for Q1 2014, 80% have given negative rather than positive guidance.

14fe3

Source: Ed Yardeni

Last year’s multiple-expansion rally in equities was justified on the stock market front-running a return to ‘normal’ economic growth and earnings growth, as well as the underpinning of ‘Fed policy trumps all’. With QE now being wound down, economic data worsening rather than improving, and earnings still disappointing both in terms of revenues and forward guidance, the case for anti-risk is strengthening, and the rally in stocks suspect.

Yesterday ahead of US stock market open, futures were down and equities around the world were struggling to attract buyers, then the retail sales data hit and the scene was set for a bearish US session. But the opposite occurred: a ‘stick save’ as short stops were run and bulls delivered a trend day up. We saw this occurring in January:

14fe8Eventually this gave way to the high volume decline days.

Yesterday’s volume was again weak, relative to the declines leading into the 6 day rally:

14fe6

Source: Stockcharts

Complacent put/call went lower, Skew remains elevated, and defensive rather than cyclical sectors continue to lead in 2014:

14fe1

Source: Charlie Bilello

From a bullish perspective, small caps outperformed yesterday and advance-declines continue to be strong:

14fe2

Source: Charlie Bilello

Today is the full moon, which could spell an inversion in equities. The Nasdaq 100 joined the Nasdaq Composite yesterday in making marginal new highs, but it did so on a divergence in breadth (as measured by % above 200MA). So I now watch to see whether the other US indices follow suit or all roll over from here. If the latter, then it could turn out to be the sweet spot of the top of the ‘second chance’, namely the optimal time to short, but if the former, it would open up the prospect of a longer topping process in equities. That makes it a fairly delicate position. If you have been reading my recent posts, then I have a multi-angled case for equities to roll over from here, and the developments behind the price action (volume, defensive asset flows, economic data, etc) have strengthened that case rather than weakening it. So I continue to gradually add shorts into this rally and rebuild towards my intended ‘full’ short position, until the ‘clues’ change.

The case for commodities making a late cyclical charge now looks more compelling, with new broad momentum in the class, and siginificant breakouts. Commodities typically top out after equities and once the economy has begun to weaken, sucking the remaining life out of it. On the chart below we can see the last two such occurrences. In 2007 commodities broke out of their consolidation and into a steep rally as equities topped, and I expect similar developments this time. We have been seeing the US dollar weaken on the down days for equities, which should accelerate commodities as equities fall.

14fe4

Nasdaq 2000 vs. Nikkei 1989/90 vs. Dow 2013/14

The dot.com boom peak in 2000 occurred on a monthly sunspot spike at the ~11 year solar maximum, with the familiar topping process pattern of primary distribution – shake out – second chance – waterfall declines. The major declines and flash crash occurred in March/April, with associations of Mondays and the new moon (correlations that hold up in wider stock market history).

13fe1

The Nikkei boom peaked on the last trading day of 1989 on a monthly sunspot spike at the ~11 year solar maximum, with the same topping process waves. The major declines were centered around March, with associations again of Mondays and the new moon.

13fe2

The Dow peaked so far on the last trading day of 2013, on a monthly sunspot spike at the ~11 year solar maximum (11 years is average and this was a longer solar cycle), with a similar topping process so far.

13fe3With the historic associations of Mondays and new moons, we have a potential major down day Monday 1st March, which is the new moon (CORRECTION: Monday 3rd March, 1st trading day after the Saturday 1st March new moon), and based on the percentage drops of the Nikkei and Nasdaq we could potentially waterfall to 11,000 by the end of April. The relevance of March and April is captured here:

13fe4

Just as the seasonal peak of geomagnetism (inverted) corresponds to peak stock market seasonality and a clustering of major tops having occurred at the turn of the year, so the seasonal lows of March/April and October have corresponded to worst seasonal stock market performance and a clustering of market crashes.

Wednesday Morning Update

Further rally in equities on Tuesday, here’s how things stand today:

1. Volume on the rally still weak:

12fe52. Trend in cyclical sectors still downward:

12fe43. Trend in breadth still downward:

12fe64. Skew still elevated:

12fe35. Put/Call ratio still in complacency zone:

12fe16. Investors Intelligence % Bears spending a 16th week in the historic low extreme zone of sub 20:

12fe27. Further breakout in gold and gold miners:

12fe8

8. Topping process analogs still valid, and likewise if we substitute in the current SP500:

12fe10

In summary, looking under the hood, this rally still has the characteristics of a bull trap, as befitting the second chance. If so, a 5-day almost vertical rally, with superficial echoes of 2013, is the perfect bait to lure in as many as possible before the market tumbles in earnest.  Yes it feels bullish again, but stepping back I remind you that things indeed changed since 2013, that we have a fairly comprehensive cyclical bull topping checklist, that we have a set up for a stock market crash, and that there was a multi-angled case for a turn-of-the-year major market peak that remains in play. I have added to short stock index positions again this morning and I am out the rest of the day.


Chart Updates

1. SP500 – the rally since Thursday has kept both bull and bear cases open:

11fe112. However, volume has been weak on the rally versus the falls – the reverse of December’s rally from correction:

11fe183. Call/Put versus SP500 – see U Karlewitz comment at bottom of chart:

11fe24. Rydex Bull-Bear versus SP500 – again see U Karlewitz comment at foot:

11fe15. Cyclicals continue to display relative weakness despite the rally:

11fe196. The Nasdaq 100 is the most bullish looking US index, but continues to reveal underlying breadth divergence:

11fe127. The Russell 2000 is currently the weakest index, but still has a long way to fall to mean-revert in valuation:

11fe178. Bull-defining parabolic stock, sector and index charts which have yet to break down (whilst others have):

11fe3 11fe411fe69. Economic Surprise Index latest – a reversal of fortunes in 2014 bar Japan:

11fe7 11fe8 11fe9 11fe1010. Commodities inventories latest – tightening broadly in progress (and echoed in some softs):

11fe13 11fe1411fe16 11fe15

Gold, gold miners and treasury bonds continue to attract money flows despite the stock market rally of the last few days. I have added to my short stock index positions today and will add more if we move higher still. Based on the indicators in my last post and this, I expect the rally to top out imminently and revisit the lows of last week. At that point we can review to see if indicators have washed out more thoroughly. Based on bigger picture indicators I don’t expect the market to recover from there, but first we can judge that nearer term picture for clues. I would stop adding shorts if US indices rallied back up to their highs on good breadth, volume and renewed cyclical strength, with accompanying weakness in gold and treasuries. Yellen speaking today and likely some market reaction to her overall tone.

The Second Chance

Into the end of last week we saw a two day rally for the stock market, making for a partial retrace of 2014’s declines. So how do things stand heading into this week?

1. Capitulative Breadth has reset from 10 to zero. So no further edge from this for the bulls: its rallying potential from Wednesday fulfilled.

2. Both volume and breadth on the down days in 2014 have exceeded volume and breadth on the up days, which is bearish.

3. The volume surge in January dwarfs anything from 2012 and 2013, suggesting this correction has further potential.

4. Citigroup’s panic/euphoria model is still in Euphoria, suggesting further declines are required for mean reversion:

10fe1

Source: Barrons/Citi

5. Put/call ratios (both CPC and ISEE) did not wash out sufficiently in the correction-to-date, suggesting further downside:

10fe2Source: Fat-Pitch

6. Nymo also failed to reach typical wash-out levels for a 5%+ decline.

7. Investors Intelligence latest bull-bear spread down to 29, but some way from the levels of previous correction bottoms:

10fe3Source: Astbury Research / UKarlewitz / My annotation

8. NAIIM sentiment down to 51, but durable lows historically sub 30, suggesting a deeper correction (Source: Fat-Pitch)

9. Skew remains historically elevated, suggesting more of a wash-out required

10. From Sentimentrader “Every time, since 1928, when SPX went from a 52-week high to a 70-day low within two weeks, it was higher in three-months, averaging gains of 8%”:

10fe4Such a drop from 52WK high to 70D low has occurred again in 2014. U Karlewitz has added the green dots to show that when these instances occurred there was some of kind of second low, before the rally to new highs.

In short, I have listed 8 indicators that argue for a deeper correction from here, and 1 indicator that argues for new highs, but before that some kind of second low, in the form of a double bottom or lower low. Plus 1 indicator now neutral: capitulative breadth. So that’s pretty good odds that the rally of the last two days of last week gives way to renewed declines ahead, and maybe we can time that.

11. Drawing on the 1929, 1987 Dow and 1989 Nikkei analogies (see previous posts), the peak of the ‘second chance’ partial declines retrace (the last chance to exit longs and the optimum point to short) occurred around 28-30 trading days from the high in each case. From the 31 December 2013 highs in the Dow and Nikkei, that would take us to this Wed 12 February – Fri 14 February, as a guide.

12. Looking at the biggest down days in history, there is a clustering around both new and full moons, as well as Mondays (after weekend reflection). This coming Friday 14 February is a full moon, and gives us the potential set up of falls into the Friday close, followed by a major heavy down day on Monday 17th February.

13. There is a geomagnetic storm in progress this weekend, for which we typically allow a lag of up 5-6 days on the markets. The pessimistic influence of geomagnetism together with the negativity into and around full moons, makes for dual negative pressure in the week ahead.

In short, I have a case for rally of the end of last week to give way to renewed declines during the week ahead, potentially making for large falls in the window Fri 14 Feb to Mon 17 Feb.

So what news or events are coming up as potential triggers for market movement?

14. Earnings season continues and currently shows a positive 65% earnings beat rate and 64% revenue beat rate, which may bolster the bulls, but we should be aware that this is set against a very low bar through record low earnings guidance. A more valuable picture comes from the blended earnings growth rate (8.1%) and blended revenue growth rate (0.8%) which is the sum of earnings reported and the projections for those still to come. So sales continue to be weak, as companies get by on cost-cutting, and that remains a negative for the markets.

15. The postponement of the debt ceiling issue ended on Friday and the US is projected to run out of funds to pay its bills by the end of this month, unless the Republicans and Democrats can agree on the criteria for increasing it. Whilst neither party would wish to risk default, this issue may now become a market mover again until resolved.

16. Emerging market issues may return to the fore as they continue to simmer.

17. Sunspots remain strong. This would become a threat (to the bearish case) if February produced the highest monthly spike in solar activity of solar cycle 24, understanding this is a driver of excitement and speculation. However, as previously noted, forecasts are fairly united in expecting the solar maximum to wane as of the turn of the year, and the fairly comprehensive set of cyclical bull topping indicators that already congregated support this from a different angle.

In conclusion, even if we allow for the lower probability of the solar max continuing to strengthen and a higher high in stocks still to come, we can nonetheless draw together all the points in the post above and argue that the stock market should first decline, likely starting in the week ahead and probably to a lower low, to fulfil a more satisfactory wash-out and based on a cluster of bearish signals. That would make the current ‘rip’ a sell, and thereafter we can assess again the clues for whether the ‘dip’ would be a buy. However, drawing together all the evidence of my recent posts, I maintain the balance of probability is that we have just experienced a major stock market top and that such a ‘dip’ will in fact turn out to be waterfall declines, and as such I will be adding to my short positions this week. I believe the current partial retrace of 2014’s falls-to-date will turn out to be the ‘second chance’, or rather last chance, to move from long to short on equities.

Something Happened At The Turn Of The Year…..

1. Treasury bonds bottomed / yields topped out:

7fe22. Gold bottomed and broke out:

7fe3

3. Bitcoin peaked:

7fe44. US Consumer Discretionary and other cyclical stock market sectors peaked:

7fe55. US stock market sentiment made a historic high peak:

7fe66. The put/call ratio made a historic low bottom:

7fe87. Trading volumes surged:

7fe98.Equity funds had their largest ever weekly outflow (whilst bond funds had a record inflow):

7fe1

9. Investor leverage spiked to real and as a percentage of market cap records:

7fe1110. The solar maximum peaked and the stock market peaked (prediction):

7fe10Plus, leading indicators (narrow money and OECD derived) forecast that global economic growth peaked out around the turn of the year.

And why? This is the part that is unpalatable to many: because we are less intelligent creatures of free will and more dumb subjects of natural forces:

7fe12 7fe13 7fe14 7fe16Caveat: If NASA/NOAA/Solen projections are wrong and the smoothed solar maximum extends further into 2014 together with another larger monthly spike in sunspots then it is possible the stock market makes a higher peak with it, close to another future new moon. However, the collective evidence (united solar forecasts plus comprehensive cyclical stocks bull topping checklist (my last post)) suggests this is low probability.

Cyclical Stocks Bull Topping Checklist

Time for an updated look at the common historic features of peaks in cyclical equities bulls, with the focus on the US market.

1. Market Valuation Excessive : Yes

Second highest market cap to GDP valuation outside of 2000, the 4th highest Q ratio valuation and 4th highest CAPE valuation in history, last two years gains more than 80% multiple expansion and less than 20% earnings growth

5Fe1Source: Dshort

2. Evidence Of Overbought And Overbullish Extremes : Yes

January 2014: II bears lowest since 1987, II bulls highest since October 2007, CS Risk Appetite US model into Euphoria; Citi Panic/Euphoria model into Euphoria; Put/Call ratio at extreme low; Second highest ever Skew reading; Greedometer at extreme; Margin Debt at all-time record; Margin Debt to GDP at 2000, 2007 levels

3. Major Distribution Days Near The Highs : Yes

24th January: 90%+ down volume day; 3rd February: 90%+ down volume day

4. Rolling Over Of Leading Indicators : Yes

Global economic growth to peak out between November 2013 and February 2014 according to leading indicators with 4-6 month lag:

5Fe2 5Fe3

Source: MoneyMovesMarkets

5. Excessive Inflation : No

Developed economies are flirting with deflation, in line with demographic trends. However, recent action in commodities suggests that class may be gearing up to outperform as late cyclicals and deliver a temporary inflation shock to help roll the global economy into recession. Tentative breakouts to be watched.

5Fe46. Tightening Of Rates : Yes

Emerging markets raising interest rates; US Fed tapering QE; China actively reigning in credit; Developed markets bond yields rising into the end of 2013

5Fe5Source: The Felder Report

7. Cyclical Sectors Topping Out And Handing Over To Defensives: Yes

5Fe6Source: Stockcharts

8. Market Breadth Divergence : Yes

5Fe8

5Fe9Source: IndexIndicators

8. A Technical Topping Process/Pattern : Yes

Parabolic shaping on US indices into blow-off top mirroring Dow 1929, 1987 and Nikkei 1989 (and analogies further supported by similar levels in valuations, sentiment and leverage)

27dece2 27dece3

27dece4

5Fe7Sources: Financial-Spread-Betting and Barcharts

In short, with history as our guide, we have a fairly comprehensive case for a cyclical bull market top in US equities having occurred at the turn of the year. A late cyclical rally in commodities to deliver a short inflation shock would complete the picture. For equities, drawing together both the time and price guides of the analogies, we should now be alert to the possibilities of both a building out of a ‘second chance’ lower high and a more pressing collapse into waterfall declines.

Near Term Assessment For Equities

Yesterday delivered an important breakdown in US equities. Following a 90%+ down volume day on the 24th Jan, we received our second such day yesterday. Price broke triple-support on the SP500 and delivered a lower low which breaks a pattern in place for a year:

4Fe1Like the SP500, the Russell 2000 had been clinging to a lower channel support in last week’s mixed action, but decisively broke it yesterday. So the question is, what now for stocks?

As yet, we do not see sufficient mean reversion in sentiment (II, NAIM, Panic/Euphoria all still evelated), nor has Skew returned to more benign levels. Put/call ratio remains persistently low, despite yesterday’s sell-off, and suggests more selling is required to reset the complacency. Nymo has broken downwards but is still not at typical bottom levels:

4Fe2Source: Charlie Bilello

On the other hand, Vix, Arms and % stocks above 50MA have moved towards levels that marked bottoms over the last year, and that second 90% down day also meant a low was close in that same period. That could mean buyers may become interested again.

However, as per my recent posts, I don’t think last year is going to work as a guide any more. My case for a major top in equities has been aided by treasuries outperforming since the turn of the year and cyclicals changing trend in their relative performance to the SP500 also as of the start of January. We have also been seeing some economic data disappointments, as expected, and this Friday’s jobs report is likely to be another market mover. I believe we need to see those sentiment and put/call indicators wash out before price makes an important low, and that means any near term buying should ultimately give way to selling to a lower low.

If we look again at the 1929, 1987 and 1989 (Nikkei) topping analogs (this post and this post), the waterfall declines were kicked off at similar times in all three: after around 30 trading days from the major peak. Today is the 23rd trading day since Dec 31st, which makes things unclear. We could potentially make an upward retrace over the next couple of weeks to a lower high and then begin the true declines, or we could roll over into the waterfall declines from here. The price action analogs suggest similar: we may yet need to build out more of a definitive ‘second chance’ retrace or we may achieved a weaker version of that between 24th Jan and yesterday. So we need to see how price action develops this week and keep an eye on the indicators for clues.

Solen’s monthly solar maximum and projection update is below and remains supportive of my Dec 31 equities top case, with the monthly spike in sunspots and smoothed solar maximum projection combination:

4Fe3

Source: Solen