

1. Treasury bonds bottomed / yields topped out:
 2. Gold bottomed and broke out:

3. Bitcoin peaked:
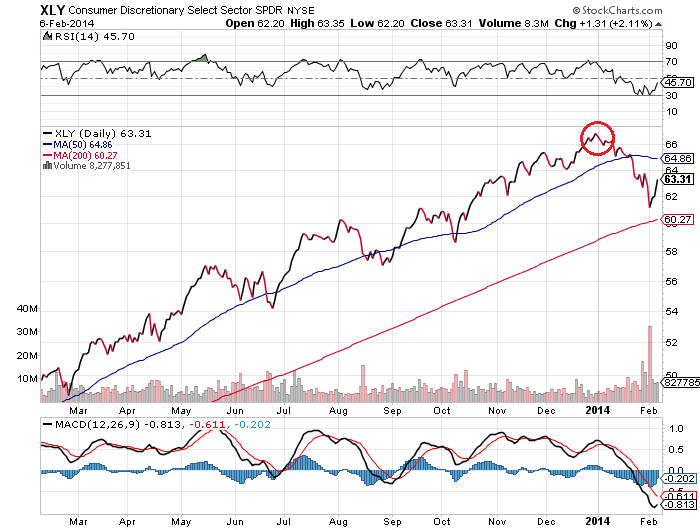
 4. US Consumer Discretionary and other cyclical stock market sectors peaked:
 5. US stock market sentiment made a historic high peak:
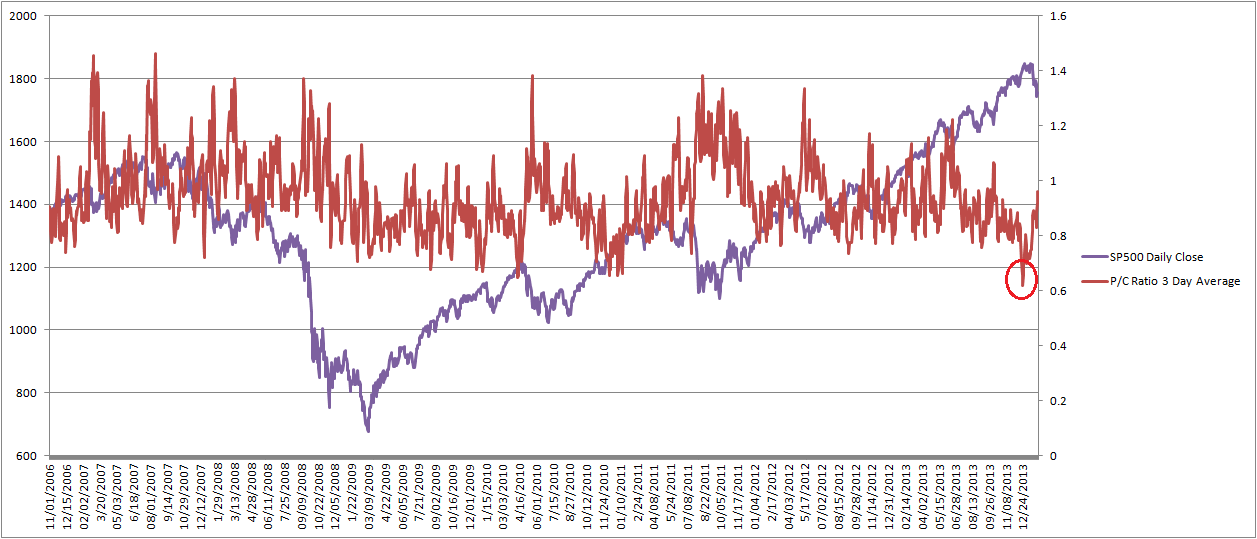
 6. The put/call ratio made a historic low bottom:
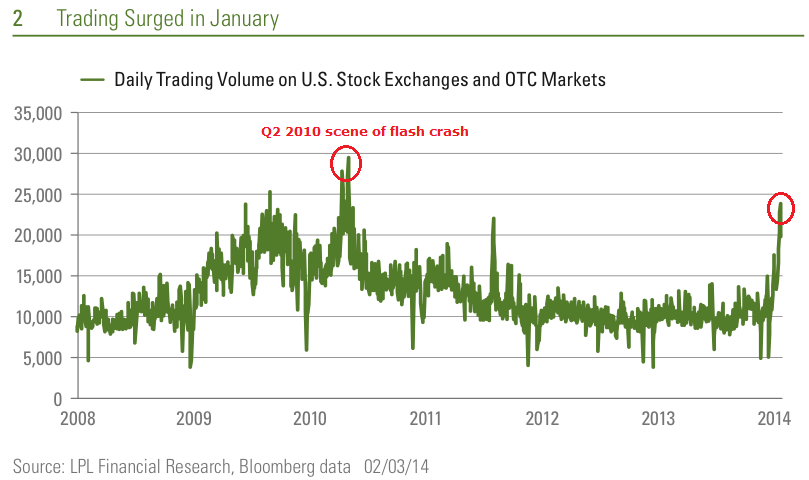
 7. Trading volumes surged:
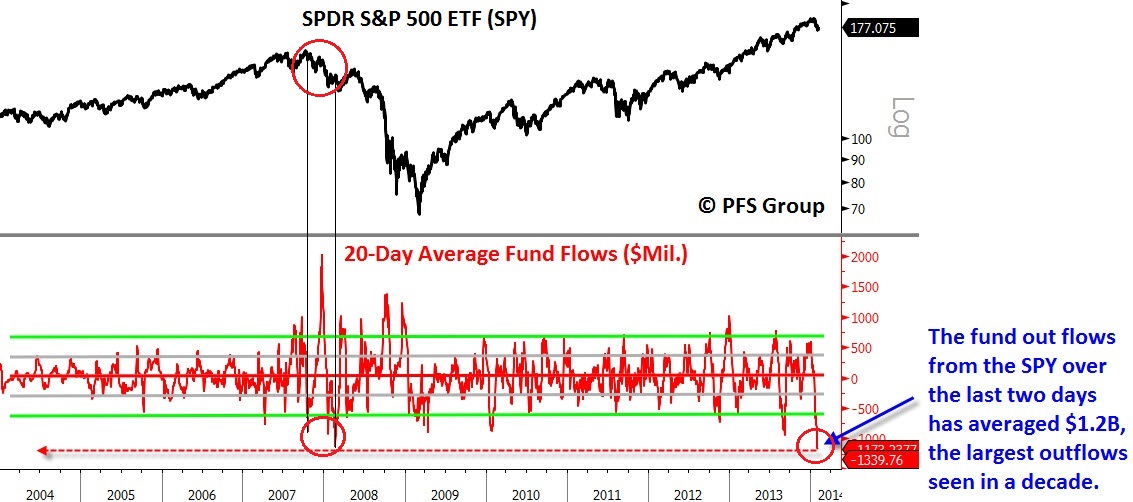
 8.Equity funds had their largest ever weekly outflow (whilst bond funds had a record inflow):
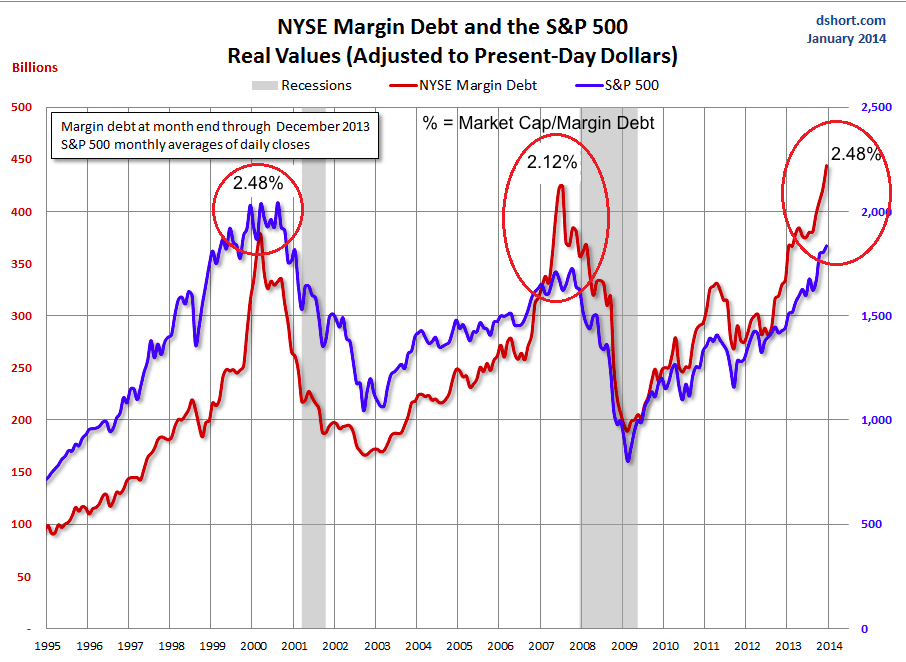
9. Investor leverage spiked to real and as a percentage of market cap records:
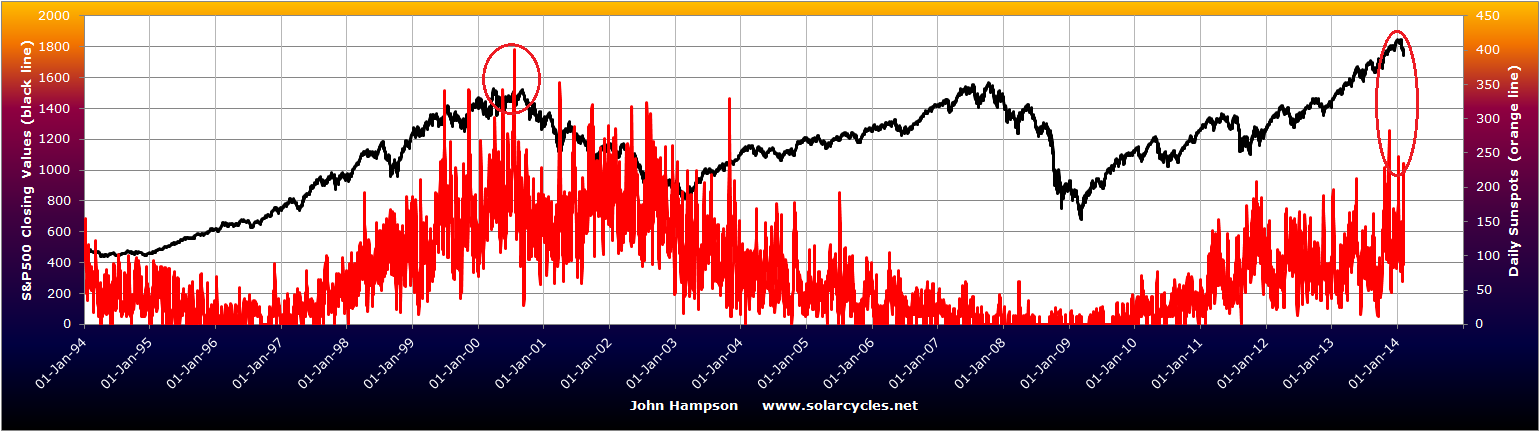
 10. The solar maximum peaked and the stock market peaked (prediction):
 Plus, leading indicators (narrow money and OECD derived) forecast that global economic growth peaked out around the turn of the year.
And why? This is the part that is unpalatable to many: because we are less intelligent creatures of free will and more dumb subjects of natural forces:


 Caveat: If NASA/NOAA/Solen projections are wrong and the smoothed solar maximum extends further into 2014 together with another larger monthly spike in sunspots then it is possible the stock market makes a higher peak with it, close to another future new moon. However, the collective evidence (united solar forecasts plus comprehensive cyclical stocks bull topping checklist (my last post)) suggests this is low probability.

Outstanding…
Thanks HVA
John,as an old-timer my technical skills are outdated and lacking when compared to the charts and information which appear here (along with other posters comments)
but at least I pride myself with the ability to recognize excellence.
Thanks eclectic
My thinking is the falling of the solar max at the (inverted) geomagnetism seasonality peak, together with a new moon, could be fairly potent in bringing about that kind of all peaking together. Given how January turned out, I am expecting margin debt may have peaked in December too, we’ll see.
The last such falling example would be gold’s secular peak in 1980 – the solar max was Dec 1979, gold peaked 21 Jan 1980 4 days from the new moon, margin debt peaked Feb 1980.
Hi John – I have been reading your site and the fantastic analysis you provide for a while now. Thank you. Now that you have exited your shorts and under your caveat section you mentioned you thought a top could be later, but not likely, are you still thinking near-term we start to accelerate down? With the NFP miss again by a large margin and the market taking off again it seems bullish momentum still with us. Until yesterday I thought 2014 was going to look different from 2013 but now I am not so sure. It seems bad news is still good news. Your thoughts?
Thanks Ken. I said I exited some shorts – I have kept the larger part. No I don’t think 2014 will be at all like 2013. Too early in the US session to judge the reaction today, let’s see how it develops.
Hi John,
Are you concerned at all about the number of people that are following the ’29, ’87, ’89 Nikkei analogies? DeMark’s repeated CNBC appearances seems to have put it on everyone’s radar.
All of the analysis is excellent and I feel strongly that we will see a substantive decline now or in the months to come, yet my gut tells me that with so many people keyed in on one scenario the market will likely not follow suit.
Thanks.
As this tool confirms, we have enough stock market history that you can and will always find an analog:
http://www.mrci.com/special/index.php
Hence we have seen many times a scary analog doing the rounds that comes to nothing.
I’ve only seen 1929 doing the rounds recently and based on pattern similarity mainly. Hopefully you understand I have more of a case than that. 1929, 1987 and Nikkei 1989 share the same technical unfolding pattern as each other and today’s US indices : a parabolic finale and within that similar waves of crowd psychology. What’s equally important is that same kind of backdrop is shared in terms of valuation, sentiment, leverage and technical indicators. Not only that, but the 1989 and 1929 peaks gave way to deflation in the same way we should now under similar demographic trends. So I think they are highly relevant.
John great stuff and great call, is your view of commodities getting confirmed with this fall in equities?
Thanks Tom. I can just refer you to the chart in the previous post – there is a tentative commodities breakout. Interest has clearly picked up in commodities but it’s still too early to judge.
the Coppock curve triggered a long term sell on January’s monthly close also: http://stocktwits.com/message/19809498 (and created what I’ve heard called a killer wave with the divergence from the curve’s prior high).
The coalescence of Bearish signals that John has so beautifully explicated is overwhelming. Therefore, what should we do – press the downside. The analogy I see is with gold. It went up for over 12 years. Therefore, the overwhelming experience was to buy and profit. Of course the bears were virtually wiped out. Then when the tide finally turned, the bulls saw a buying opportunity, and the few bears left took small profits immediately, just prior to the really big drops. There were great buy signals per the previous 12+ year bull market, but they did not work in the new bear market. Briese says sell sell signals in a bear market and ignore buy signals. Vice Versa in a bull market of course. Right or wrong we are at a critical juncture where big money can be made. WD Gann says that in a bear market, rallies are usually 3 days, 3 weeks, or 3 months. The last three days look like a 3 day rip! Sell the rips.
strange rally…. the QQQ is beyond 618, the SPY past .5, yet the DIA is just now reaching .382 and the TNA can barely get off the floor.
Have found similarity between the DAX 14′ and Japan 89′
Japan- down 15 days at 6.6% retrace 4.2% over next 12 days
DAX – down 13 days at 6.4% retrace ?
i do not know what to make of this… I am just reporting..From low to closing high at the .382 retrace, the $ INDU moved 458 points..90% of the points were from 9 stocks in the index, with one stock accounting for 19% alone. the other 21 stocks in the index just sat there.
To continue the thought…. note that John’s chosen vehicle, the Russell,barely got off the mat on this rally.. there simply are too many stocks to give a few an overweight thus making it difficult to manipulate. At the other extreme, the QQQ has six stocks that comprise 40 % of its valuation with AAPL the big dog with 20 %.Thus even though AAPL struggled to retrace ,382 of its recent slide, it was enough to have the QQQ retrace almost 70 %.
Hi John:
Here is a link to a site from one of the more knowledgeable folks following earth/sun interactions. He is a strong believer in the solar geomagnetic influence. I think we are just now beginning to understand the importance of magnetic portals between the sun and planetary bodies (then add in the moon).
http://www.suspicious0bserverscollective.org/daily-news.html
The site gives daily 4-5 min. “news” that covers weather, earthquakes and solar activity. Yesterday, they presented some good graphs of earthquake totals and how they match up with solar activity.
As for an uptick in commodity prices, I work with a large number of foreign nationals, they are moving money out of their host countries as quick as they can. From Asia, the flood is not done, the ones from South America are happy they started awhile back. The thinking is that the US stock market is too rich, so they are going with Silver/Gold/Treasuries. Also note, last year, 60% of all real estate purchases, were all cash buys. A lot of liquidity is going to be looking for a home. So, one more uptick then crash.
my EQ-work shows a ~3,5 year cycle, that seems to correlate well with the corresponding ~3,5 year cycle for SPX. Both cycles are topping around year 2014
Hi John
My cycles favor some kind of Feb ~25 top/shoulder. Some analogs are Nov 2007 and march 2011, and Norway looks most like march 2011, that could bring a higher high in some weeks.
Norway also has a possible tripple top coming up similar to 1990.
So markets look unstable, but if there is no trigger, we should drift sideways/up to Feb ~25
Thank you all
Inverted geomagnetism = inverted polarity of solar wind? Or inverted angular momentum? New moon mean no light reflected off moon to earth. Hence no disruption of polarity or angular momentum where this is not true with full moon. Now throw in a recent CME where the sun’s polarity change completed and may be onto a combination here? Can’t be sure. Recently a scientific paper published the fact that quarks are aware of direction. These make up protons, neutrons, but not electrons or photons. Photons interact with electrons, both are found plentiful in the solar wind.
http://en.wikipedia.org/wiki/Neutron_magnetic_moment
As always John, good posting, evidence of your theories is really clear.
Thanks, and interesting
John,
As stated in this post, if “the smoothed solar maximum extends further into 2014 together with another larger monthly spike in sunspots then it is possible the stock market makes a higher peak with it, close to another future new moon.”
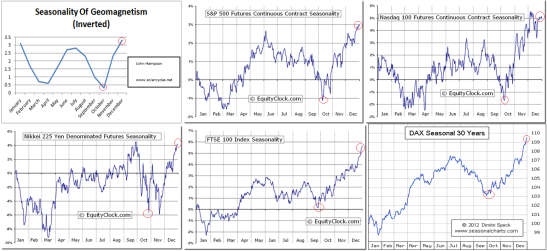
Other commentators speculate that the blow off top in the S&P will happen around May/Jun. This coincides with a new moon on May 28. Attached to your post is the S&P Seasonality chart that indicates the following, which is in line with what other commentators think:
1. Drop into Feb (which has already occurred)
2. Pop beginning early Feb (which is occurring)
3. Drop to early Mar
4. Steep rise to late May or early June (this could be the blow off top)
5. Slide into Aug then a sizable bounce (this could be the “second chance”)
6. Steep drop into Oct
7. Rise into Dec (probably the rise will continue into 2015 because year ends in a 5)
If the above happens then gold may hit another low in late May or early Jun as the S&P peaks.
Jack
Jack, based on my elementary correlations with the extreme lows in the price of gold (perfect time to buy) and the peak in the respective monthly smoothed values in previous SS similar to the current 24; the current time window for a low agrees with your conclusion. Of course if the smoothed values are higher as time unfolds; then it follows that the time window is also moved further into the future.