
Time for an updated look at the common historic features of peaks in cyclical equities bulls, with the focus on the US market.
1. Market Valuation Excessive : Yes
Second highest market cap to GDP valuation outside of 2000, the 4th highest Q ratio valuation and 4th highest CAPE valuation in history, last two years gains more than 80% multiple expansion and less than 20% earnings growth
 Source: Dshort
2. Evidence Of Overbought And Overbullish Extremes : Yes
January 2014: II bears lowest since 1987, II bulls highest since October 2007, CS Risk Appetite US model into Euphoria; Citi Panic/Euphoria model into Euphoria; Put/Call ratio at extreme low; Second highest ever Skew reading; Greedometer at extreme; Margin Debt at all-time record; Margin Debt to GDP at 2000, 2007 levels
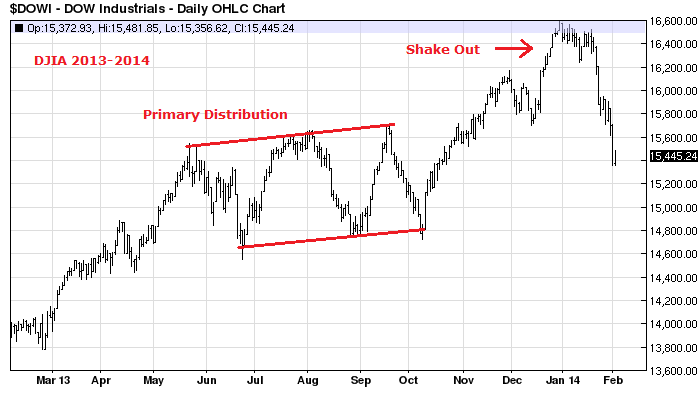
3. Major Distribution Days Near The Highs : Yes
24th January: 90%+ down volume day; 3rd February: 90%+ down volume day
4. Rolling Over Of Leading Indicators : Yes
Global economic growth to peak out between November 2013 and February 2014 according to leading indicators with 4-6 month lag:


Source: MoneyMovesMarkets
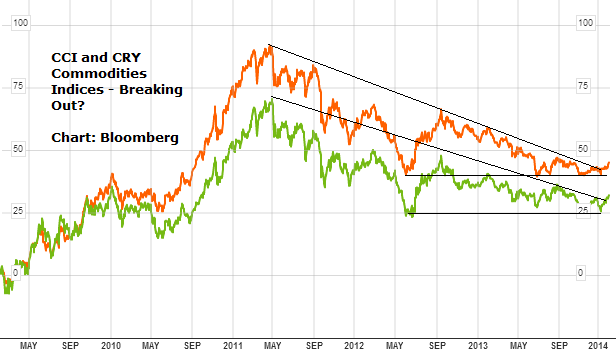
5. Excessive Inflation : No
Developed economies are flirting with deflation, in line with demographic trends. However, recent action in commodities suggests that class may be gearing up to outperform as late cyclicals and deliver a temporary inflation shock to help roll the global economy into recession. Tentative breakouts to be watched.
 6. Tightening Of Rates : Yes
Emerging markets raising interest rates; US Fed tapering QE; China actively reigning in credit; Developed markets bond yields rising into the end of 2013
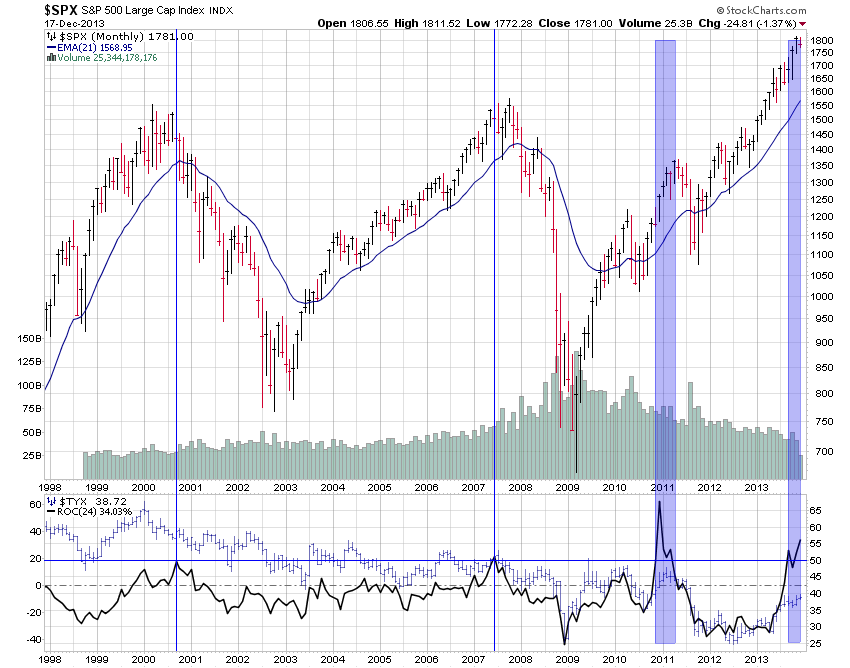 Source: The Felder Report
7. Cyclical Sectors Topping Out And Handing Over To Defensives: Yes
 Source: Stockcharts
8. Market Breadth Divergence : Yes
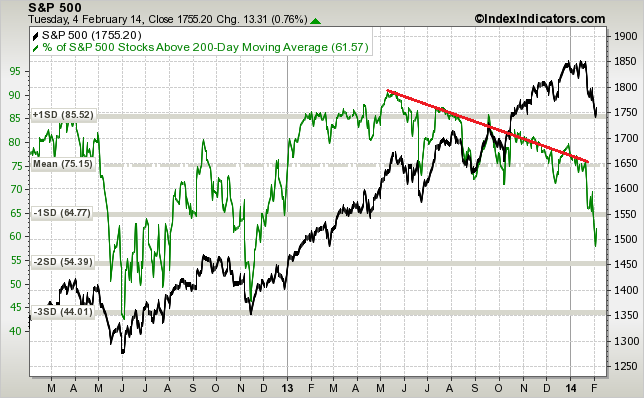
 Source: IndexIndicators
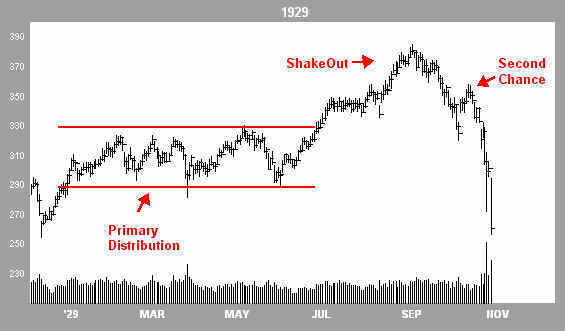
8. A Technical Topping Process/Pattern : Yes
Parabolic shaping on US indices into blow-off top mirroring Dow 1929, 1987 and Nikkei 1989 (and analogies further supported by similar levels in valuations, sentiment and leverage)


 Sources: Financial-Spread-Betting and Barcharts
In short, with history as our guide, we have a fairly comprehensive case for a cyclical bull market top in US equities having occurred at the turn of the year. A late cyclical rally in commodities to deliver a short inflation shock would complete the picture. For equities, drawing together both the time and price guides of the analogies, we should now be alert to the possibilities of both a building out of a ‘second chance’ lower high and a more pressing collapse into waterfall declines.

Hi again, Jonh, in the prior article, I suggested you that could be posible that in Real prices could see in the future, -next movement in the Industrials- lower prices than in march´09, but not in Nominal prices.
Do you contemplate this possibility.
Thanks.
@apanalis
I expect deflation, as per demographics, and therefore a lower nominal low
Ok, thanks, time will tell.
@apanalis
Thank you for your frequent updates. Your charts show, that at former tops the upmove to the „second chance“-point began above the upper trendline of the preceding distribution zones. Today the Dow is already in the upper third of this area. Here one can find a chart of the average course of the Dow following a decline of more than 4% in January http://www.godmode-trader.de/artikel/der-januar-knock-out-und-die-folgen,3651100. It fits very well to your Dow 1929 chart.
Furthermore the dow has already cut the December 2013 lows. As Jeff Saut is pointing out, this creates a very high statistical case for a further decline of more than 9% over the rest of the year http://www.financialsense.com/contributors/jeffrey-saut/tinker-evers-chance.
Should the overbought rally reverse today, I would look to August 2011 as a possible guideline.
For now the only chart that is puzzling me a bit, is the cumulative A-/D-line ($nyad). As of yesterday the weekly hasn’t broken its 10 ma, which is, what it almost always has done soon after the start of a major decline since 2007.
Thank you Theo
Yes the cumulative AD isn’t playing ball. I can find just two previous Dow tops – 1937 and 1946 – where that breadth measure did not diverge before the top but effectively topped out with the index. So that scenario is possible, but it has not been common.
John, I read somewhere a while back that due to so much flash trading, advance/decline line divergence does not happen any more.
How would that work Kent, to prevent it?
John, have you found any instances where the “second chance” made a higher high before the big sell-off?
Don’t know of that, but I’d consider that to be a different kind of top: a topping process with an initial high than a second marginally higher high on negative divergences. What the above 4 have in common is the increasing rate of ascent into the top – parabolic on the longer term view – a blow off top.
Thursday update:
Signs for a bounce:
Capitulative breadth hit 10
D-trend shows exhaustion
Put/call back into normal zone
Weekly RSI oversold
Tails on the daily candles last couple of days
T-bond yields rallied yesterday
So I think we are due to build out that ‘second chance’.
Decline ended at day 23. This bounce should be short and sharp retracing more than 60% of the decline. Also not sure if the decline fit the bill % wise on the S&P. Anyway took profits on shorts today. Just watching and waiting now.
Thanks
Hi, John, do you have the updated chart of Citigroup Economic Suprise Indicator?
Thanks
@apanalis
Page 4 http://www.yardeni.com/pub/PEACOCKBULLBEAR.pdf
Thanks, John
Hi John
In your post 5 higher are you saying that all those criteria have been met or that’s what you are looking for?
Will
If you mean the signs for a bounce, they were all present at the end of yesterday
Also John
Ever since the beginning of your blogs you have always said when you are taking action……you don’t seem to any more is that a conscious decision?
Yes I used to post every trade open and close, when my trading was more leisurely and I was making few trades overall in a year. I’m currently opening and closing trades every day so that’s what’s changed. But I will summarise my positions in a coming post.
John, have you covered some of your short positions?
Yes I took profits on some this morning once I had that list of bounce signs
Thank you John…I also have taken some profits…so Let the lower high gets built.
History says the Second Chance top should be in the vicinity of SPX 1820 which is less than 3% higher than where we closed today!
Thanks John for your articles. I always learn something new (and useful) from them.
Thanks Cesar