
Into the end of last week we saw a two day rally for the stock market, making for a partial retrace of 2014’s declines. So how do things stand heading into this week?
1. Capitulative Breadth has reset from 10 to zero. So no further edge from this for the bulls: its rallying potential from Wednesday fulfilled.
2. Both volume and breadth on the down days in 2014 have exceeded volume and breadth on the up days, which is bearish.
3. The volume surge in January dwarfs anything from 2012 and 2013, suggesting this correction has further potential.
4. Citigroup’s panic/euphoria model is still in Euphoria, suggesting further declines are required for mean reversion:
Source: Barrons/Citi
5. Put/call ratios (both CPC and ISEE) did not wash out sufficiently in the correction-to-date, suggesting further downside:
 Source: Fat-Pitch
6. Nymo also failed to reach typical wash-out levels for a 5%+ decline.
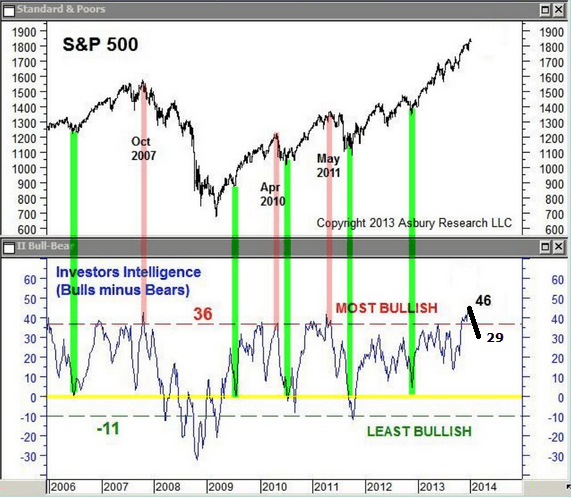
7. Investors Intelligence latest bull-bear spread down to 29, but some way from the levels of previous correction bottoms:
 Source: Astbury Research / UKarlewitz / My annotation
8. NAIIM sentiment down to 51, but durable lows historically sub 30, suggesting a deeper correction (Source: Fat-Pitch)
9. Skew remains historically elevated, suggesting more of a wash-out required
10. From Sentimentrader “Every time, since 1928, when SPX went from a 52-week high to a 70-day low within two weeks, it was higher in three-months, averaging gains of 8%”:
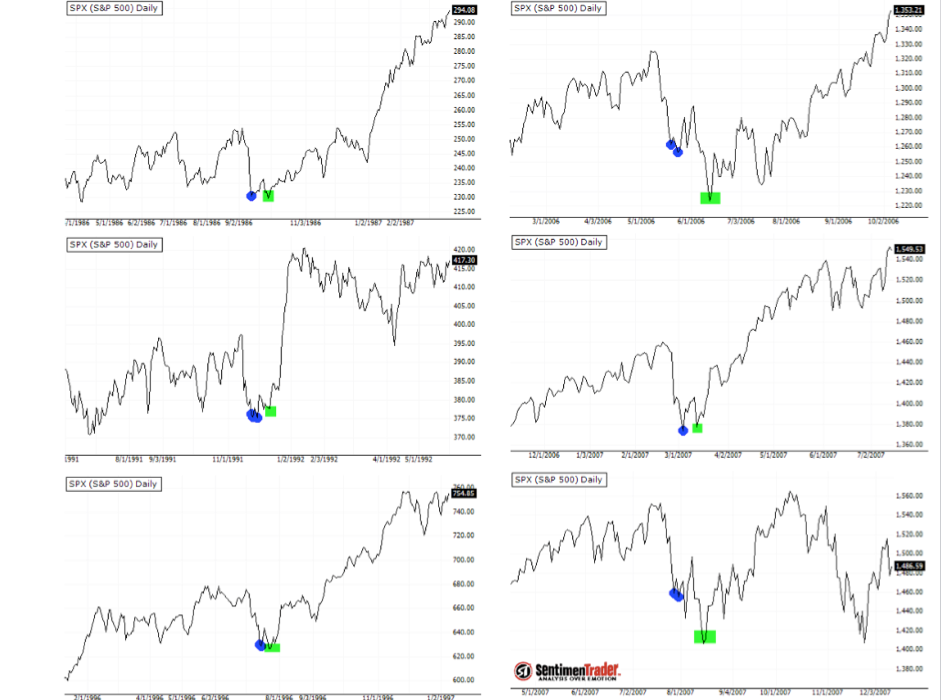 Such a drop from 52WK high to 70D low has occurred again in 2014. U Karlewitz has added the green dots to show that when these instances occurred there was some of kind of second low, before the rally to new highs.
In short, I have listed 8 indicators that argue for a deeper correction from here, and 1 indicator that argues for new highs, but before that some kind of second low, in the form of a double bottom or lower low. Plus 1 indicator now neutral: capitulative breadth. So that’s pretty good odds that the rally of the last two days of last week gives way to renewed declines ahead, and maybe we can time that.
11. Drawing on the 1929, 1987 Dow and 1989 Nikkei analogies (see previous posts), the peak of the ‘second chance’ partial declines retrace (the last chance to exit longs and the optimum point to short) occurred around 28-30 trading days from the high in each case. From the 31 December 2013 highs in the Dow and Nikkei, that would take us to this Wed 12 February – Fri 14 February, as a guide.
12. Looking at the biggest down days in history, there is a clustering around both new and full moons, as well as Mondays (after weekend reflection). This coming Friday 14 February is a full moon, and gives us the potential set up of falls into the Friday close, followed by a major heavy down day on Monday 17th February.
13. There is a geomagnetic storm in progress this weekend, for which we typically allow a lag of up 5-6 days on the markets. The pessimistic influence of geomagnetism together with the negativity into and around full moons, makes for dual negative pressure in the week ahead.
In short, I have a case for rally of the end of last week to give way to renewed declines during the week ahead, potentially making for large falls in the window Fri 14 Feb to Mon 17 Feb.
So what news or events are coming up as potential triggers for market movement?
14. Earnings season continues and currently shows a positive 65% earnings beat rate and 64% revenue beat rate, which may bolster the bulls, but we should be aware that this is set against a very low bar through record low earnings guidance. A more valuable picture comes from the blended earnings growth rate (8.1%) and blended revenue growth rate (0.8%) which is the sum of earnings reported and the projections for those still to come. So sales continue to be weak, as companies get by on cost-cutting, and that remains a negative for the markets.
15. The postponement of the debt ceiling issue ended on Friday and the US is projected to run out of funds to pay its bills by the end of this month, unless the Republicans and Democrats can agree on the criteria for increasing it. Whilst neither party would wish to risk default, this issue may now become a market mover again until resolved.
16. Emerging market issues may return to the fore as they continue to simmer.
17. Sunspots remain strong. This would become a threat (to the bearish case) if February produced the highest monthly spike in solar activity of solar cycle 24, understanding this is a driver of excitement and speculation. However, as previously noted, forecasts are fairly united in expecting the solar maximum to wane as of the turn of the year, and the fairly comprehensive set of cyclical bull topping indicators that already congregated support this from a different angle.
In conclusion, even if we allow for the lower probability of the solar max continuing to strengthen and a higher high in stocks still to come, we can nonetheless draw together all the points in the post above and argue that the stock market should first decline, likely starting in the week ahead and probably to a lower low, to fulfil a more satisfactory wash-out and based on a cluster of bearish signals. That would make the current ‘rip’ a sell, and thereafter we can assess again the clues for whether the ‘dip’ would be a buy. However, drawing together all the evidence of my recent posts, I maintain the balance of probability is that we have just experienced a major stock market top and that such a ‘dip’ will in fact turn out to be waterfall declines, and as such I will be adding to my short positions this week. I believe the current partial retrace of 2014’s falls-to-date will turn out to be the ‘second chance’, or rather last chance, to move from long to short on equities.

Just an additional note. Friday’s job report was definitively bad, and the second such in a row, yet the market rallied. Those with more knowledge in this area than I suggest it was technical algo-driven opportunism – signals pointing to the ability to run stops and maintain momentum for the day. My personal add is that it was the wrong time to renew declines in the market – the ‘second chance’ needed further building out both by price and time, as per the waves of crowd psychology, and we may need to see that build out a little further in the first part of this week. Nonetheless, it was another data item banked for the bearish case and befitting the turn-of-the-year economic peak, and I believe adds to the set up for waterfall declines erupting ahead.
The geometry of the indexes on the close offers an alternative that could frustrate both bulls and bears.IF! prices turn down directly from the close or move up very marginally and then turns down, then the geometry offers the possibility of a month of churning with 2-4 day bursts in both directions…..if price rockets higher on the open then the geometric possibility breaks…. will just have to see on Monday….
Gold stocks are at critical juncture on Friday close.. Off the buy signals in December many reached their upside targets on the key day which was Friday.IF! they do not move sharply higher here, then I expect then to turn to their final lows in March -April before the fireworks commence on upside…
Thanks Slater, always interesting to get your angle
Thanks for your input.
That would be characteristic action during a Mercury retrograde (the rest of this month).
http://stockcharts.com/c-sc/sc?s=QQQ&p=60&yr=0&mn=1&dy=19&id=p98738951715&a=331801168&r=1391986411166
my apologies for this not loading
My current list of positions – understand this is dynamic – but to give you an idea:
Short Hang Seng
Short EU Stocks 50
Short French CAC
Short SP500
Short Nasdaq 100
Short Dow
Short Russell 2000 (biggest short)
Long Wheat
Long Coffee Arabica
Long Coffee Robusta
Long ETF Agri
Long Natural Gas
Long Crude Oil
Long Gold
Long Silver
Long Gold Miners ETF
Thank you John for sharing your positions.
A strong bounce makes NDX the better looking H&S pattern than the other indices to enter a trade. I just initiated a short position. Very tolerable risk is the trade is wrong.
In summary, John your idea is to increase short positions from12 of feb to 14th feb to mantein until 14-17th feb´14? or will be the last opportunity to be short for a long time?
@apanalis
ViX indicator, must close two gaps downwards
@apanalis
For Mark: (Silver Chart: 1900’s)
http://www.enterpriseintegrators.com/palmer/history/3-tulane&jub/historyofgold&silver.htm
Mark, note that the POS did not bottom until around 1915.
Hi eclectic,
Many thanks for posting that link – as well as the detailed silver prices, there’s a lot of other useful information in it. Its a timely reminder that currency debasement has been a major concern for thousands of years; not just under recent QE. Also, given the author’s 1983 call to begin accumulating precious metals, we should not stick too rigidly to cycles or analyses.
The precious metals were subject to more open and direct government control a century ago; nowadays they try to keep it hidden from view. It looks like silver started to respond to Solar Cycle 14, but was interrupted by the Panic of 1907 and did not dramatically increase in price until the First World War, taking it into the next solar cycle. This could well be happening again, as the short, medium and long term war/violence cycles have recently started to align upwards (and will continue to do so until 2017/2020). SC24 is as strong as ever, and could easily fuel continued aggression and speculation towards 2017.
Gold’s bottom (whether temporary or not) at the turn of 2014 fits perfectly with a longer term Fibonacci time sequence. The next turning point is late July 2014 – and that is the final one in this corrective phase…
Thanks again, and regards!
Reblogged this on thedarklordblog and commented:
The full moon could be pivotal. But first, Yellen!