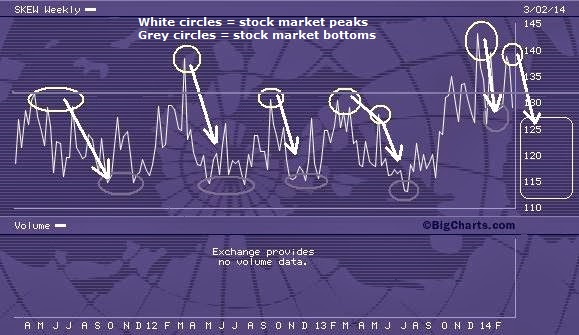
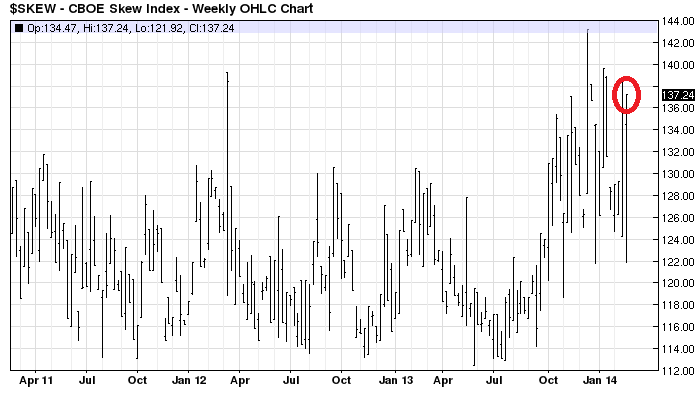
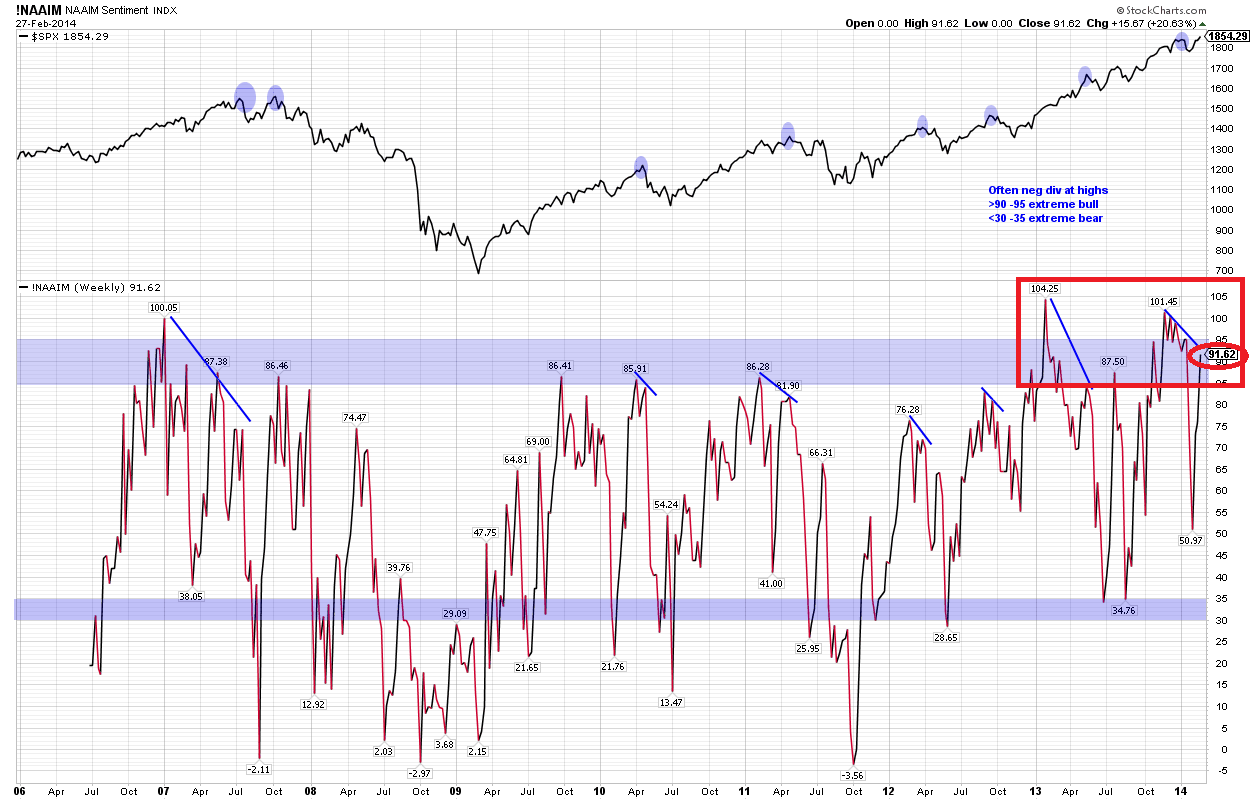
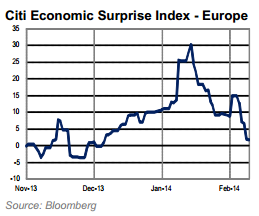
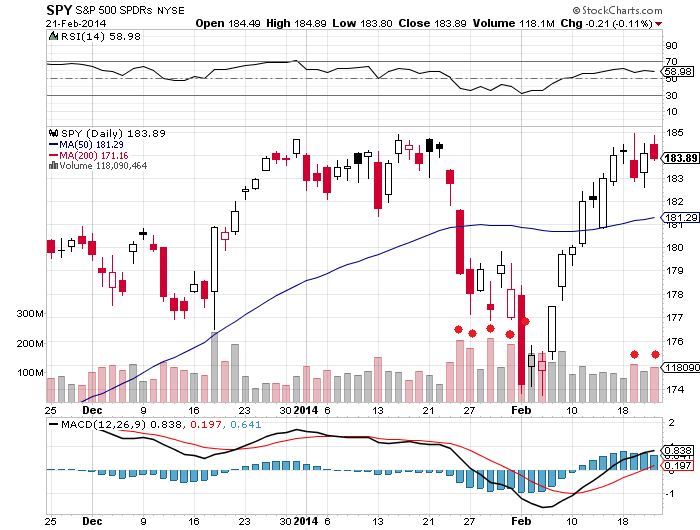
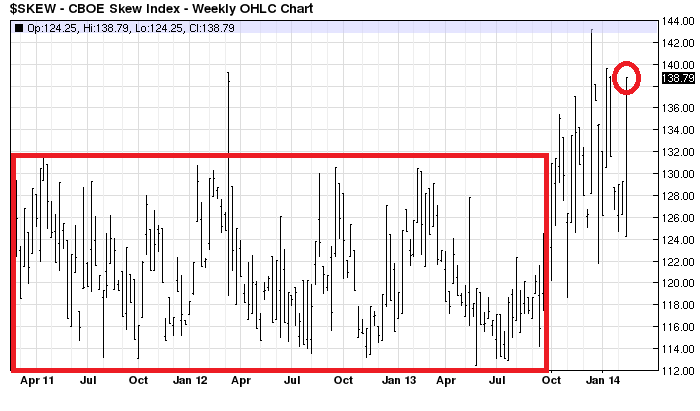
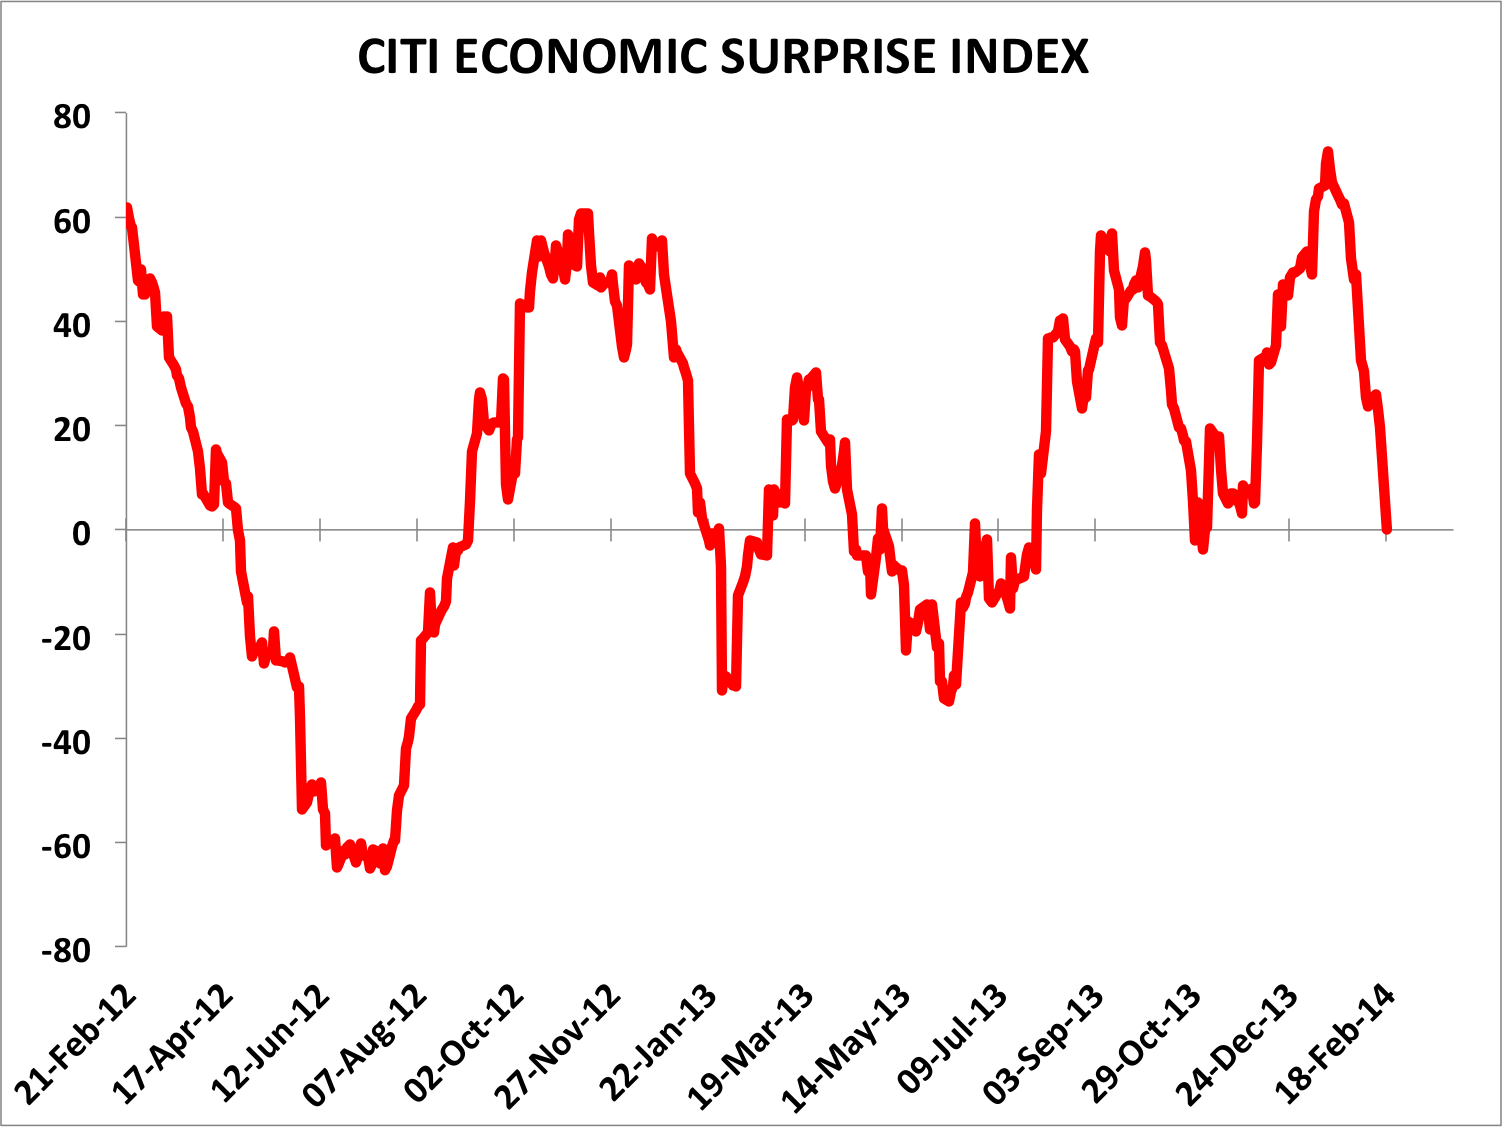
Yesterday saw a failed breakout on the SP500 on high volume which suggests exhaustion. The Skew print came in still historically high and the put/call print historically low again, which continue to signal bullish complacency and high risk of an outsized move to the downside. Economic data disappointed again, and the latest economic surprise readings are below:


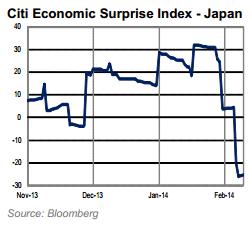
Source: Citi
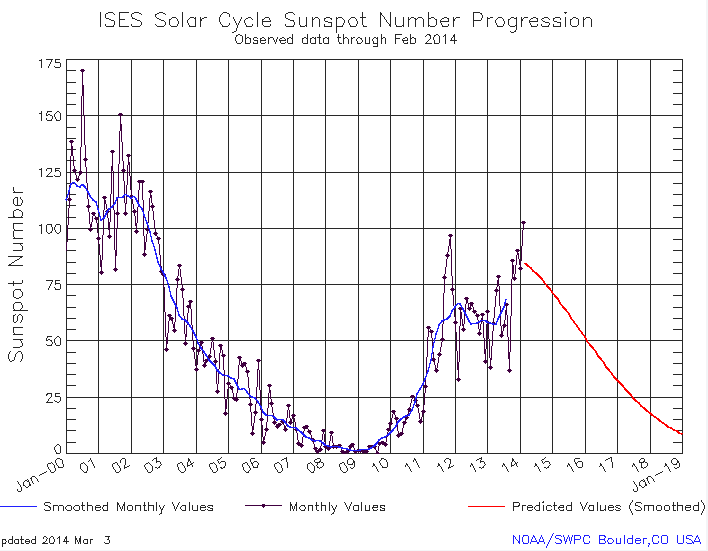
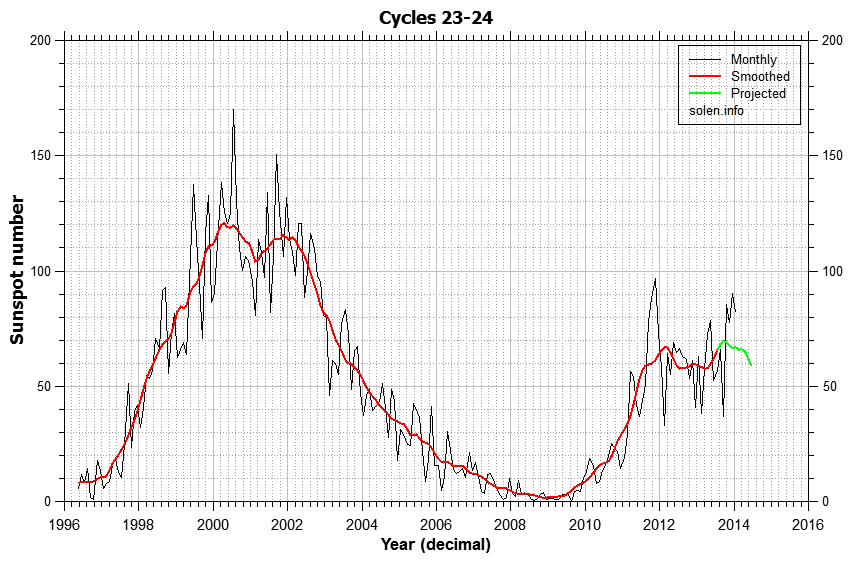
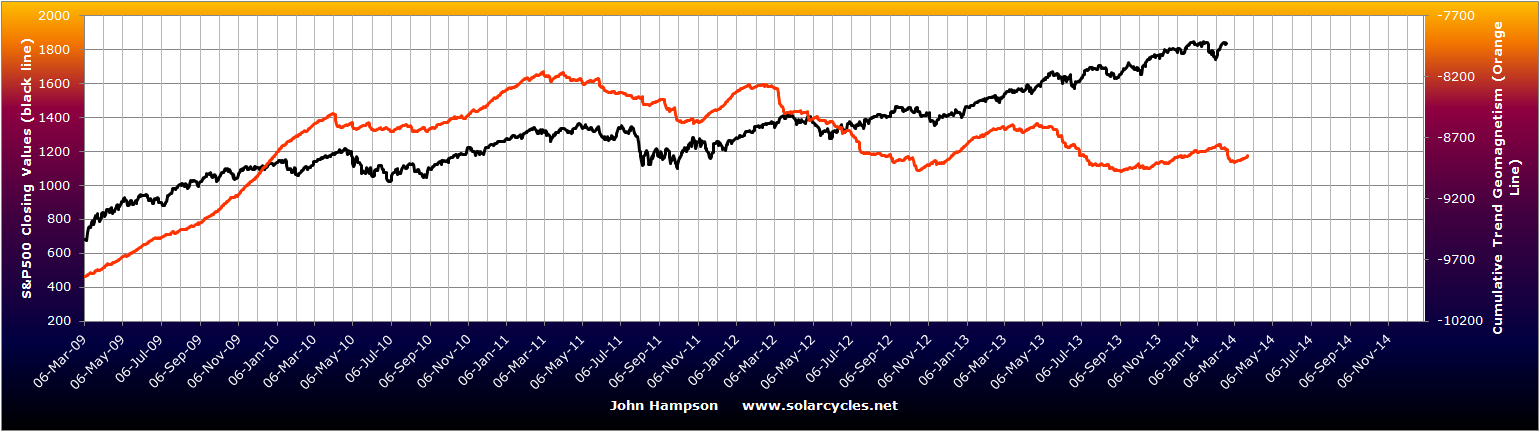
The geomagnetic storms over the last week broke the model’s multi-month uptrend (red line) and along with the NOAA forecast reveal downward pressure this week:
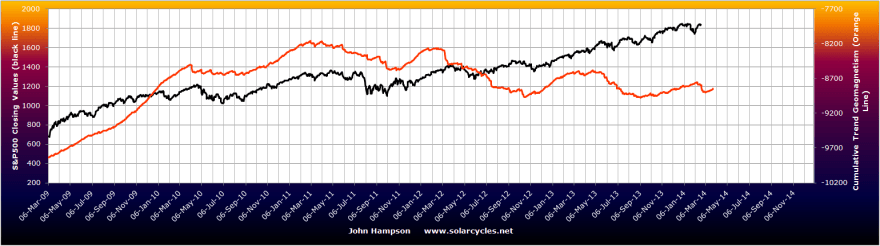 If you are new to the site my models are updated weekly.
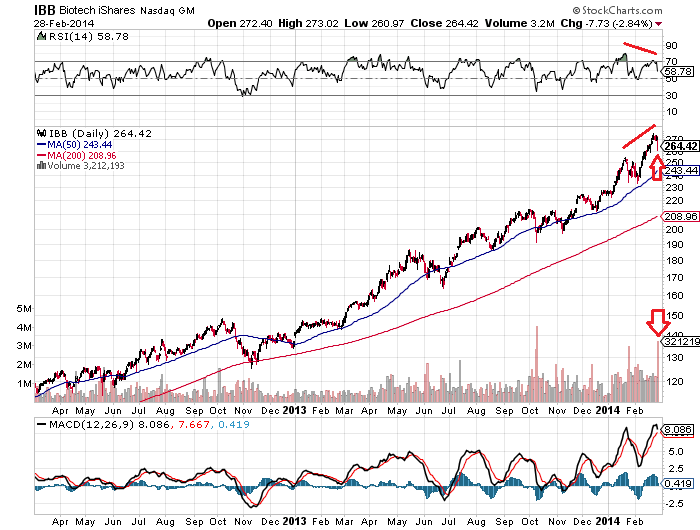
The significant outstanding bubble in the markets remains the Nasdaq Biotech sector, but the unsustainable parabolic is ripe to pop:
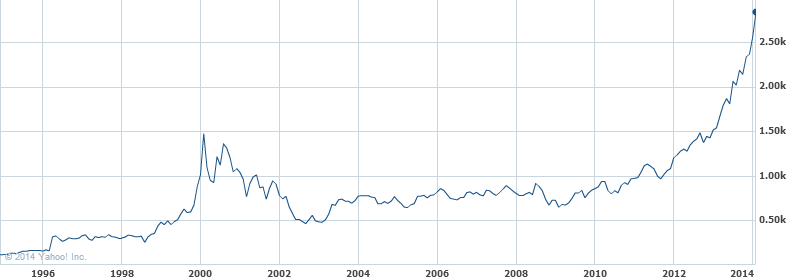
Source: Yahoo
Less than one third of this sector’s 122 companies earned any money in the last 12 months.
The last 2 years gains in the wider US markets were approximately 80% multiple expansion and 20% earnings growth. The justification for the multiple expansion was (1) ‘Fed policy trumps all’ and (2) stocks frontrunning a ‘normalisation’ in economic growth and earnings. Now: QE is being wound down, Q4 2013 GDP and Q1 2014 GDP estimates are being revised downwards, earnings estimates are being revised downwards and for Q1 2014 82% of companies so far have issued negative earnings guidance. Those justifications have largely evaporated.
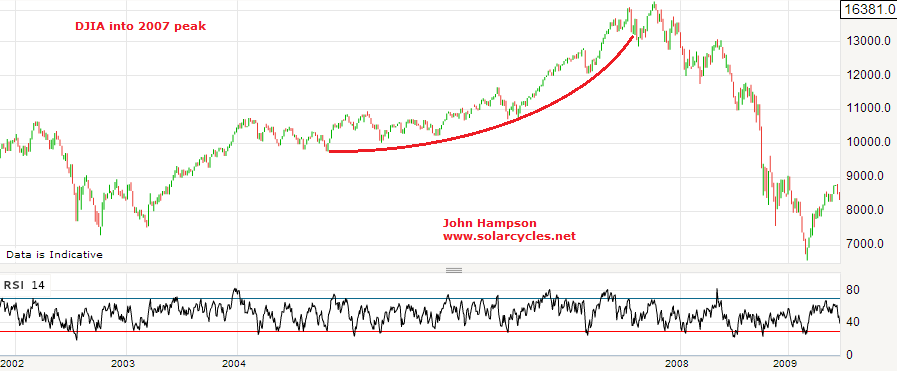
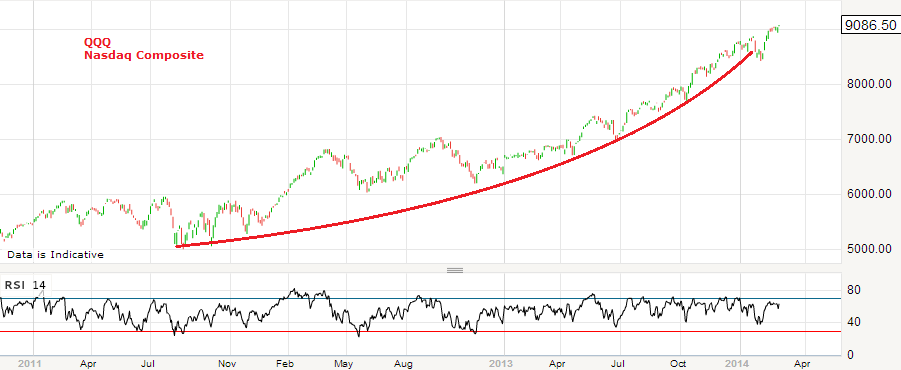
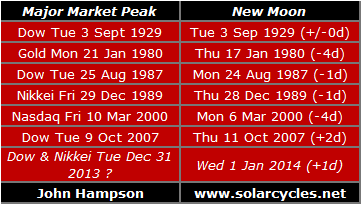
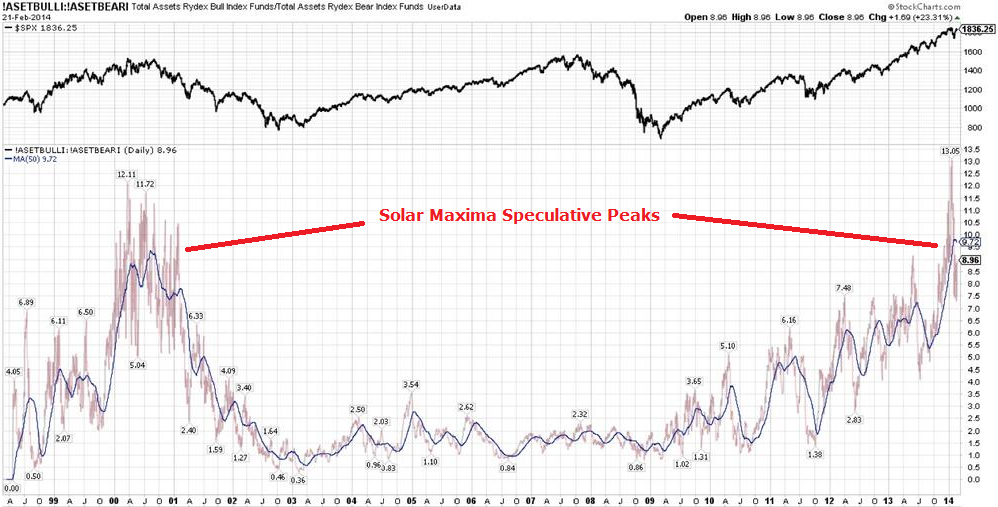
The lesser known reason for the big run up in price into the end of 2013 is the speculation peak driven by the solar maximum, and this was shared in the superpeaks of Dow 1929, Nikkei 1989 and Nasdaq 2000. A reminder that there are 3 ingredients for a superpeak: (1) speculative mania by solar maximum (2) increasing number of buyers through demographic swell and (3) increasing use of leverage amongst buyers. Both (1) and (3) apply to the current US markets but (2) is absent. There is a shrinking rather than swelling demographic pool, and for that reason we do not have a supersized peak. Otherwise, the analogies are very much applicable.
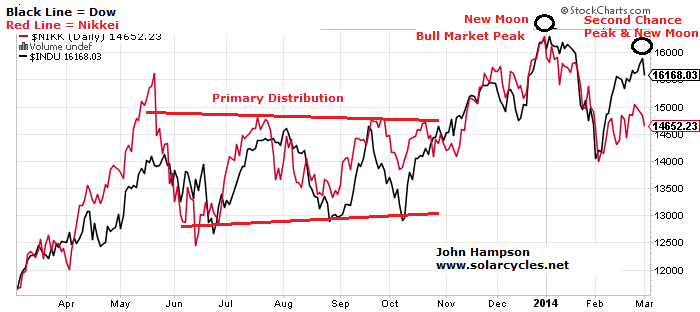
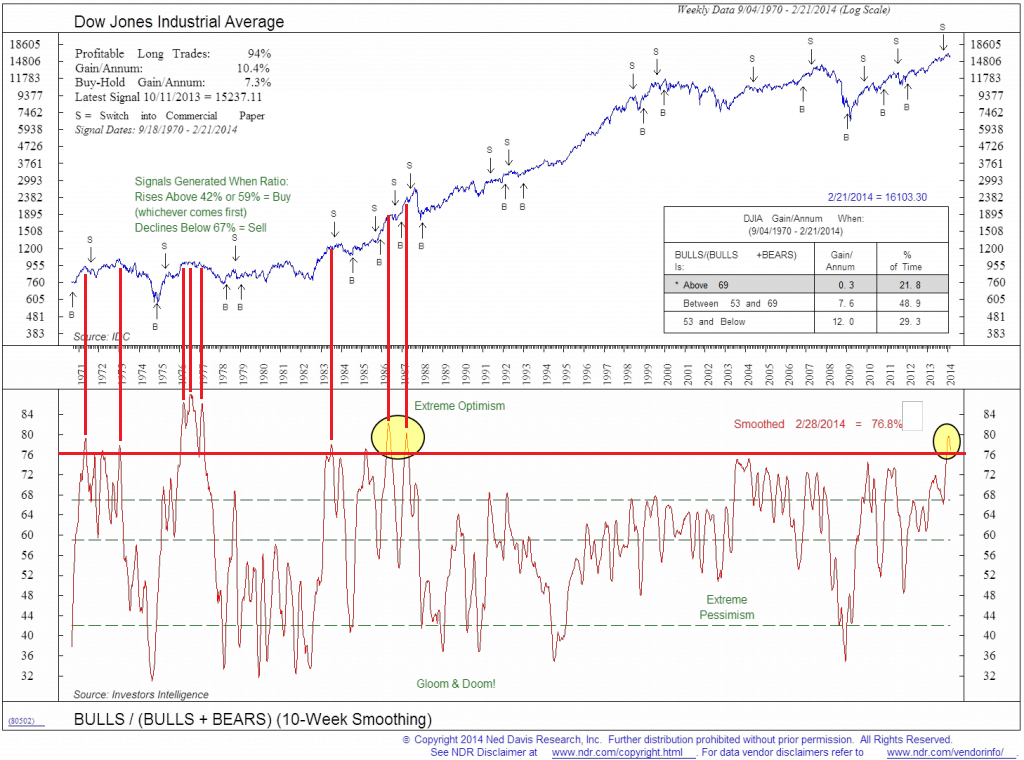
In 2013 US markets ran up in a parabolic shaping, generating historic levitation above moving averages and producing an anomalous lack of a ‘proper’ correction. Sentiment reached levels not seen since previous major peaks, and euphoria only historically exceeded in the dot.com boom. We have reached valuation levels in the Q ratio equivalent to the TOP in 1929 and in stock market capitalisation to GDP equivalent to the TOP in 2000. Leverage levels equal the TOP in 2000 as measured by margin debt to GDP and beat the 2000 top in other measures. The blow-off topping process in the current Dow so far mirrors that shared by the 3 analogs, and the peak-to-date occurred at the solar maximum.
In short, the ‘size’ of the peak in current US markets does not compare to the analogs because of the key demographic difference, but in many other ways these analogs are particularly apt. What comes next in the analogs is waterfall declines, and we have a case for the same in the current US markets due to (1) historic levitation away from moving averages or parabolic rise on long term view (2) historic time since significant correction and historic compound gains and bull duration (3) 80% multiple expansion 3-pronged justification case shattered (4) ‘all-in’ measures of sentiment, leverage and fund flows ripe for unwinding. We are likely through the solar maximum peak and the speculative excess into the peak is now vulnerable to pop.
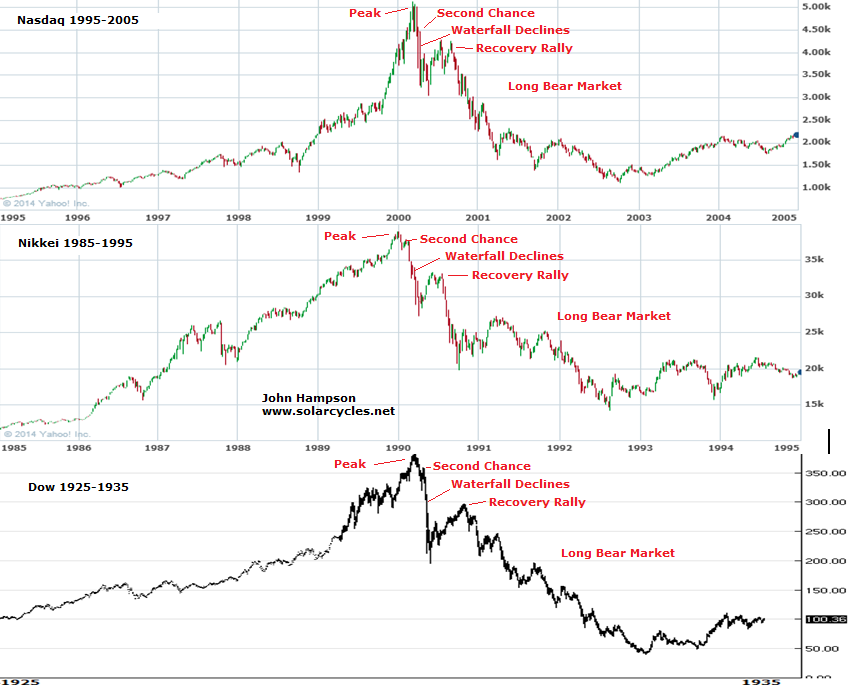
Here are the analogs on a 10 year view centered around the peak:
 Alongside I’d like to remind you of the relevance of the (inverted) seasonality of geomagnetism for the timing of peaks and falls:

Nikkei 1989: Waterfall declines from second chance lasted about 6 weeks, centered on March (geomagnetism (inverted) seasonal low), and took off 27% from peak; Recovery rally then lasted 3.5 months from April to July, back up 20% (through seasonal high); Then 2.5 months more waterfall declines, mid July to beginning of October down 40% (through seasonal low).
Dow 1929: Waterfall declines from second chance lasted 1 month, centered on October (seasonal low), and took 48% off from peak; Recovery rally then added back on 50%, lasted 5 months from November to april (through seasonal high); Then long period of declines lasting a couple of years.
Nasdaq 2000: Waterfall declines from second chance lasted about 6 weeks, March-April, and took 36% off (seasonal low); Recovery rally lasted about 3.5 months from May through to beginning of Sept, adding back on 34% (through seasonal high); Then long period of declines lasting a couple of years.
So, averaging them out and applying to the current US markets, we could expect waterfall declines of around 35% lasting around 5 weeks, and this should occur in the seasonal low of March-April. That would then be the time to take off short positions for a recovery rally of around 35% lasting around 4 months from April to August or so, through the seasonal high. A second set of steep declines should then unfold through the seasonal low of September-October.
 By that model the initial waterfall declines should wipe out all of 2013’s gains in the space of a month. I refer you to the case for waterfall declines further up the page as to why this is reasonable, and I suggest the consensus view once this occurs will belatedly point to similar factors. However, once the recovery rally then erupts, as can be seen from the 3 analogs on the 10 year view, it will keep the ongoing bull market option in play. I suggest 1987 will likely be quoted as benchmark: a harsh correction that was a golden buying opportunity. But, once the recovery rally tops out short and rolls over into more steep declines, there will be broad acceptance of the new bear.
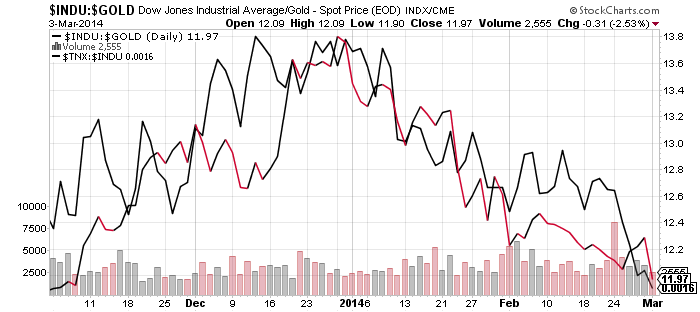
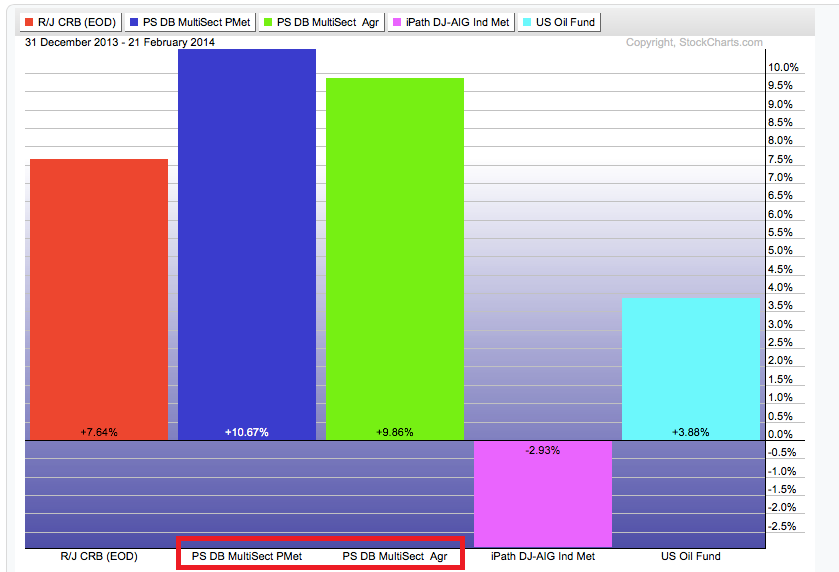
What will happen to commodities under waterfall declines? Understand that such unforgiving drops will bring about forced liquidations as leverage is unwound so there will be some blanket selling. In all 3 analog waterfall decline periods, commodities (including precious metals) fell too, whilst the US dollar largely rallied. The same occurred in October 2008’s sharp falls. That suggests it may be prudent to pull back on or even exit commodities long positions once we get a whiff of steep declines erupting.
Previous major commodities peaks have been speculative to a large degree, but also typically founded on a fundamental supply/demand case. For energy and industrial metals the latter is currently weak, and we see oil and copper in long term ranges rather than in major breakouts. Various soft commodities have enjoyed steep moves up as shorts have scrambled to cover, but whether there can be an enduring supporting story this year remains to be seen. I am skeptical as to whether commodities as a class can make a major rally to beyond 2011’s CCI peak this year, anticipating they may sell off under the waterfall declines and perhaps struggle for a case under deflationary recession fears. However, maybe they can outperform during the ‘recovery rally’ over mid-year and particularly if the US dollar is less seen as a safe haven this time, so I remain open to the possibility that maybe they can beat 2011’s peak, but currently see this as less likely. The case for previous metals differs from other commodities, and as I have outlined before I see gold’s 2011-2013 bear as a pause in a longer term secular bull market likely to terminate at the next solar maximum. My tactics will be to reduce all commodities long positions bar precious metals once it looks likely that equities are on the cusp of waterfalling, anticipating some blanket selling across all assets in that period, and then review again as we approach the end of that event.
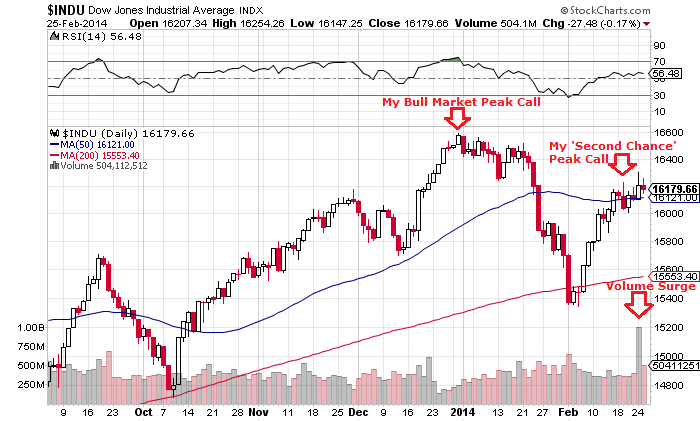
Looking back to the Great Depression, banking panics began in 1930 and swapping dollars for gold in 1931. In other words, it took time for things to unfold, and I would expect similar this time around. Whilst I cannot be sure, I do not expect a sudden chain of bankruptcies under the first waterfall declines, but for the real ‘trouble’ to unfold gradually and likely after the recovery rally peaks out. First things first then: I expect a major short equities opportunity to unfold swiftly from here through March and into mid-April, and am positioned for that. I will be looking to exit all equities shorts as I try to time the end of that event.

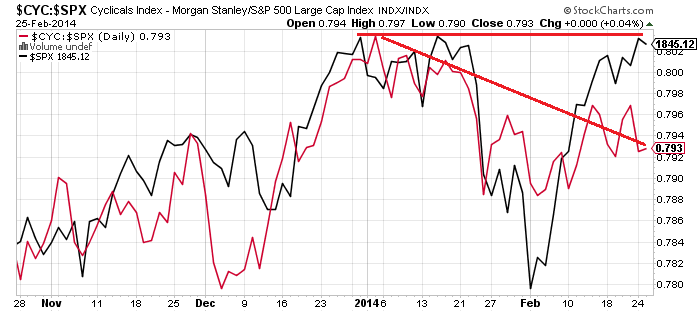
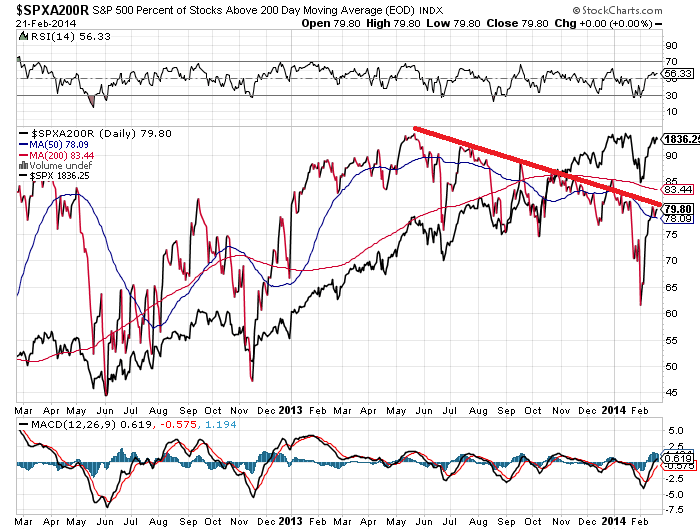
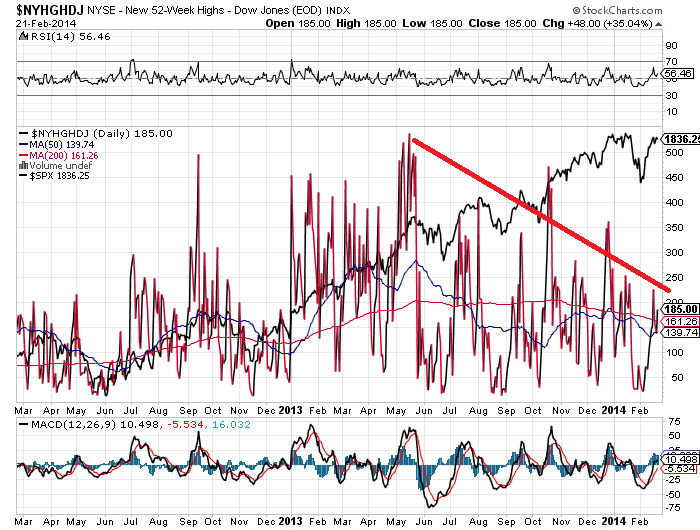
 Source: Stockcharts (and next two charts)
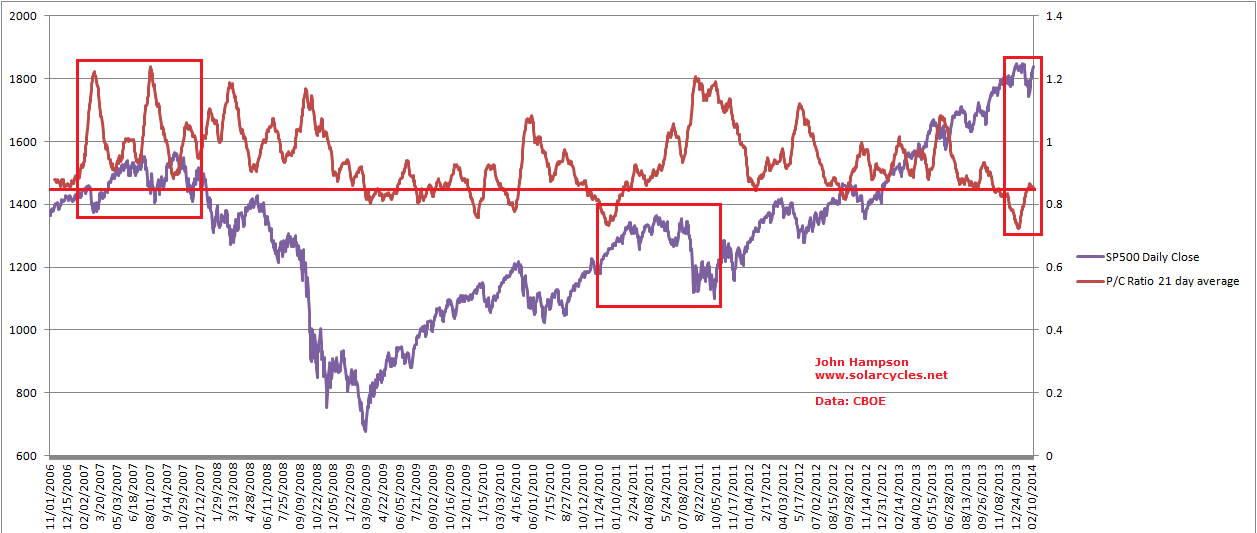
 3. Equity options put/call ratio yesterday moved back to historic extreme low:
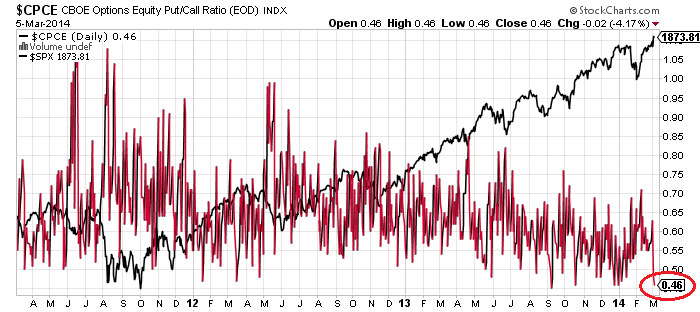 4. ISEE put/call index 5 day average over 200 for the second day, other instances shown:
 Source: Keystone Speculator
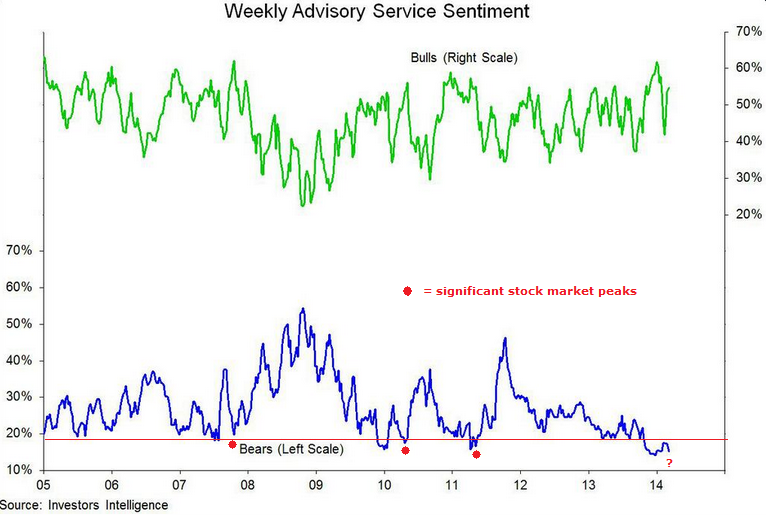

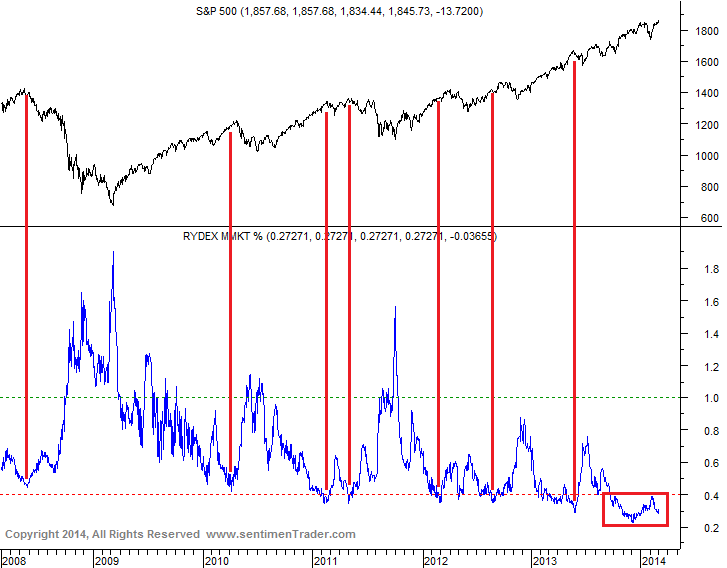
 Source: Ispyetf
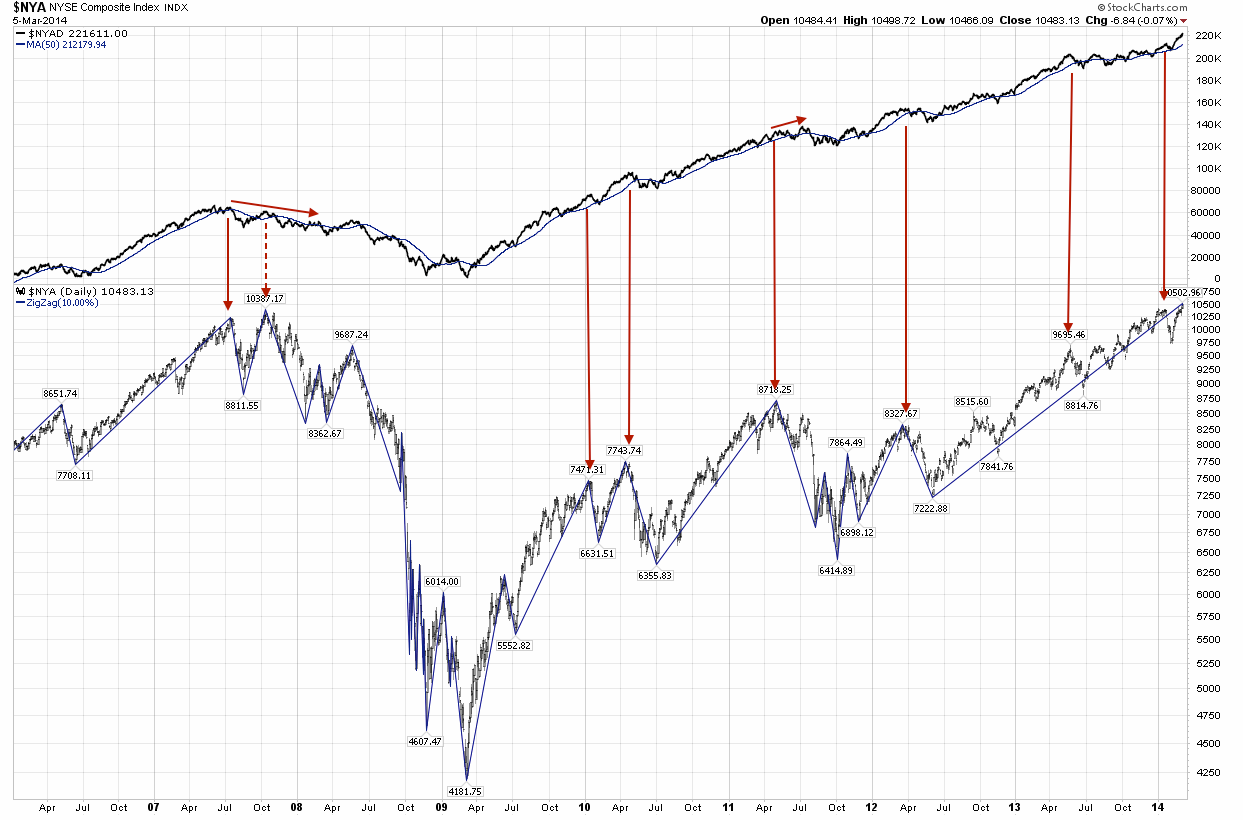
 Source: Fat-Pitch
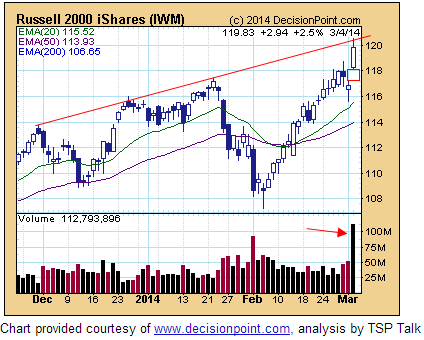


