

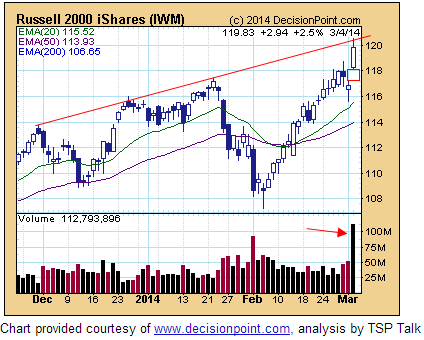
A surprising day yesterday. Russell 2000 up 2.75%, and all US indices popped strongly. Clearly nothing to do with Ukraine. If we look beyond price, not much has changed. There is still a momentum divergence on this new high. The Russell 2000 is up 15 out of 16 days, which is a record. Indicators suggest this is more likely to be an overshoot rather than a breakout. Put/call is sub 1 for 5 months now, and is 5 days away from an all-time record. Skew is is also 5 months at historic elevation levels. Investors Intelligence sentiment is back to extreme (see below). I remain confident a crash is ahead, but yesterday’s action has made the short term picture less clear. For that reason I did not add further short positions into the rip. So let’s see how today unfolds, I expect more clarity by tomorrow/Friday.
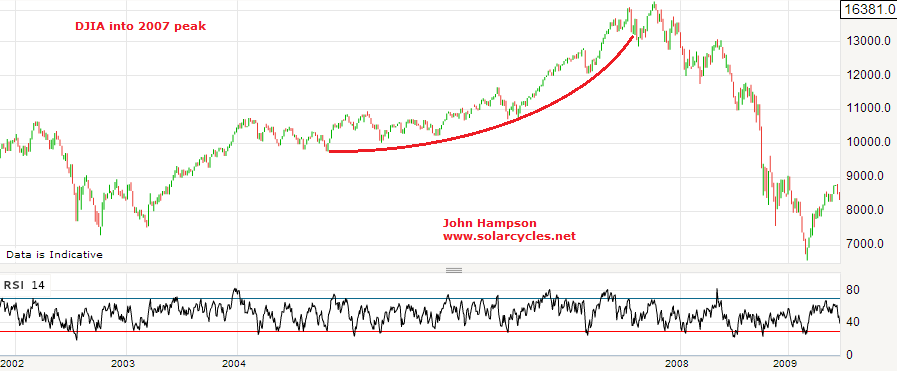
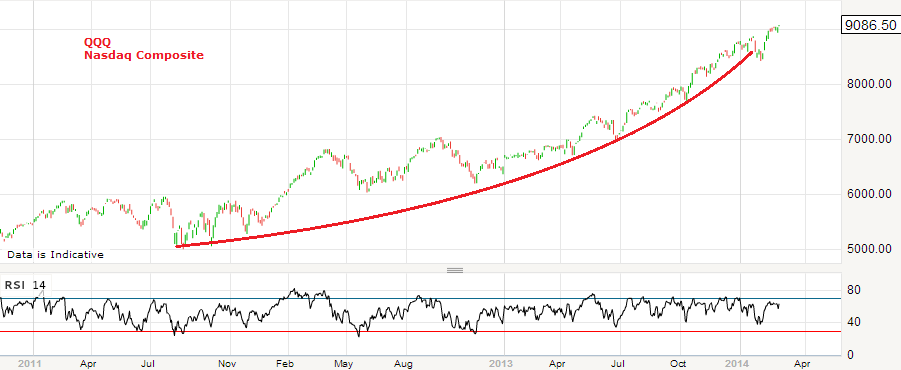
I leave you with a few charts, which are hopefully self-explanatory. At the bottom I looked to see how the Dow’s parabolic ascent into 2007’s peak terminated, which may give us clues about how the Nasdaq’s current parabolic could feasibly resolve if this short term action is an overshoot before renewed downside. The Dow made a higher high then a lower low, which was the definitive kill of the parabolic. The Nasdaq has made a higher high, but remains in the parabolic until we see a lower low.


John once again concise and well analysed, without any sign of deviation from a well founded and researched stance.
Thanks
$INDU
http://stockcharts.com/h-sc/ui?s=$INDU&p=M&st=1982-01-01&en=(today)&id=p17798172470&a=325848835&listNum=5
Thanks john for your outstanding analysis. I have been following your blog for a year or so and I look forward to reading your analysis every time you post it. Cannot ask for anything better! With regards to current situation, my hunch is we may be forming the head of a head and shoulder pattern like 2011. I suspect this head will be the top of the run from 2011 but not the top of bull run from 2009 which I am expecting in 2016. Thanks again for your great website and analysis.
Thanks HR
One thing bothers me: The 2007-8 peaks were achieved with rising volume and blow-off tops, followed by total capitulation volumes into the subsequent low. Today we are seeing exactly the opposite, with declining volumes throughout the past year. = Zero euphoria and unlikely to constitute a blow-off top. Why? Because the retail investor is running dead scared, as he or she has been throughout this bull market, crash memories are very much alive and chartists have exhibited numerous ‘topping’ patterns that have kept retail investors on the sidelines or wrongly encouraged them to liquidate prematurely.
Sure, there will be a crash some day, but I’ve used every correction of the past year to add to my position, and I’m more than happy to have been a lone voice. Historically low interest rates, a slowly recovering economy, low inflation, windfall profits from outsourcing, 70 % of companies beating last Q’s earnings estimates, etc.,. ….. do not create the conditions for a crash. Another correction in April, probably, but not a crash.
To infinity and beyond
This reminds me of the top in 2007. The market “clearly” topped in Jun and July. Then it had a good decline, but rallied to a new high in Sep and Oct. It had another good decline but even then it rallied significantly toward the highs in Dec. Another good decline but yet again another rally back toward the highs, and finally the bear market really started in May of 2008. Right now looks like in Sep 2007 3 weeks before the top. Sep 18th, 2007 was a 300+ pt day also part of coming out of the first correction. It almost seems as if the market is an evil being that wipes you out if you are too early being bearish, and if you do have anything left a year after the top as the market really starts down, you feel compelled to take small profits too early.
I don’t think so, the market is much much more parabolic this time around, with sectors like biotechs and small caps going totally parabolic. The decline will be much more violent, whenever it comes.
Hope you are right, Gaby. A lot of crashes start on a new moon – Mar1. They have an initial decline to the next new moon, Mar 30th. Then, the failing second chance rally goes to the full moon, Apr 15th. Then the crash phase really begins, especially when it is a lunar eclipse which April 15th is. Exciting times.
These Bullish:Bearish sentiment figures suggest a long way to go before a crash:
http://www.aaii.com/sentimentsurvey
A cycle top with just under 40 % bulls? It should be way above 70 %, preferably 90 % (as continually throughout 1999) before a significant decline sets in.
Retail investors are scared to enter the rally. That explains the declining volumes at almost all peaks. When volumes rise, then, and only then, should you see whether your solar cycles and Fibonacci ratios confirm a pending crash. I believe you have to match the fundamentals with the cycles, because so far the fundamentals have been defiantly and relentlessly contradicting the cycles, as was clearly the case this week.
I look forward to consulting with you all whenever the 10-year TNote rises in sustained fashion above 3.0%, when volumes rise significantly at new peaks, when breadth deteriorates and when earnings begin to disappoint. Until then, I will remain long and continue reaping profits and high dividends.
Anyone relying only on one narrow set of parameters is going to lose a lot of money, whether long or short.
1999 was a major major long term top like 1966 and 1929.. Such extremes should not be seen again for 20+ years. This is just a run of the mill top like 1976 and 1980.
I disagree. Many indicators are as extreme as 1929 and 1999, such as market gdp ratio, price/ revenues, Shiller 10 year PE ratio, in addition to record margin, record margin GDP ratio, record low yields on junk bonds, extreme sentiment readings…I know it’s difficult to consider another crash, but it’s still the most probable outcome. Can the market continue to go up a little while longer ? Sure, sure but the risk reward is extremely good for shorts right now.
This entire rally from 2009 has been on low volume so that is not a good indicator.
I assume, the persistent restraint of retail investors is the reason why the sentiment scales on sentimentrader.com strictly refuse to rise into very optimistic territory. As far as I remember, optimistic extremes had been displayed by these scales many times before the 2007 top was in.
Today one can find several bullish sentiment spikes and found a scenario on them, but then one has to focus only on a small part of the whole picture, ignoring fore instance big short interest and other. Yes, doing so appears to be an effective recipe for loosing money.
The 2000 crash may have been thought of as a 1 off crash, so folks stayed bullish in the 2008 top. Now that we have this triple peak, folks are scared and scaling back. I think the demographic problem will ultimately lead to big declines very quickly this time because of bearish expectations formed from last memory.
we won’t know until the market declines significantly whether now is a peak or not. Already SPX is more than 15 percent above the 2000 and 2007 peaks, so it’s looking less and less like a triple top, and more and more like a breakout. We will surely get a pullback in the next weeks or months, but maybe all it does is test the breakout price and then continue higher.
on the 30 plus year chart, dow is definitely completing a megaphone broadening top pattern
Double ditto!
… and on the 6 year S&P chart we have a clear and steady (non-parabolic) rising triangle from the 2009 bottom, with the top of the triangle today at 1880. If it breaks out this week it could easily go to 2200 +/-.
What do these charts prove in isolation?
Reblogged this on More Money in 365 days.
On Eclipses:
I am presenting the following link for consideration; or perhaps useful for those interested in doing further research.
http://www.amanita.at/en/interesting/articles/solar-eclipses-as-the-most-important-astrological-factor
I honestly think that MOST of what is contained on this link is pure unscientific bunk. Now, my opinion is in no way meant to impune any of the authors knowledge of financial astrology; because they are very astue within their field. But, as far as application to trading; or market forcasting; that’s entirely a different matter.
Apart from that I don’t want to divert any further attention away from the purpose of John’s fine blog.
If anyone has any personal experience or feedback on Bill Meridian’s work; I’d love to hear about it.
Best to all.
When I looked into it, his record was so bad, it might work in reverse. My take on this site is it is highly technical and things like astrology are adjuncts to possibly get a better feel for timing.
Kent, are you talking about Meridian? That’s a pseudonym, btw. I think he ran money in Dubai for a while. Don’t know where he lives currently; maybe NYC.
Arch Crawford uses astrology and technicals and is definitely not perfect but has a good track record.
Hi Kent,
This is really in reply to your earlier comment about lunar eclipse.
As best i can tell-
4/9/14 thru 4/18/14 is a Puetz “Crash Window”
i am still targeting Monday, April 14th as a possible carsh
Arch Crawford cost me alot of money….always calling for a “crash”…stay away.
Ecletic, I found Merriman predictions to be very bad.
Astrology is not astronomy. Astronomy is a science. Astrology is not.
Maybe not. Which one came first? Anyone read “Babylon Banksters”?
http://www.newdawnreviews.com/conspiracies-and-cover-ups/babylons-banksters/
Paragraphs 1 and 12.
Astrology is the oldest science known to mankind……older than the pyramids
I continue to urge traders to watch John’s position in agricultural etf.Again, I think it will be the best percentage trade of the year.
Slater-
Is that DBA? What other agri based investments do you like? MOO? Straight corn or coffee?
Thanks
I am in DBA …
DBA has had a large move already, where are you thinking it goes by yearend? Shouldn’t we wait to see if a correction happens before starting a position or are you thinking this will weather a correction just fine? Thanks
I first posted how important I thought John’s position in ag etf was when DBA was a dollar off lows… second post at three dollars… yesterday was third post….because the move off the bottom has been vertical with no pullbacks, any correction should be short and sharp,,,The risk in the trade remains the 2404 low.Because I expect all time high grain prices this year,I expect DBA will reach 4800.
Agricultural commodities should do well this year, but junior gold stocks is where the real action is. Check out the returns on some of my favorites: International Tower Hill Mines, up 136% YTD, Columbus Gold, up 100% YTD, Red Eagle Mining, up 80% YTD, Cayden Resources, up 72% YTD. All remain deeply undervalued.
That being said, junior gold stocks are the most volatile stocks extant. If we get a stock market crash (and I expect one), they could get hit in the near term. Hedging with something like TVIX or UVXY is a very prudent move.
Thanks for everyone’s input
Slater, what makes you so bullish grains this year?
John, Thank you so much for your great posts. I feel like I have just found a gem to help me out with my investment. Extremely analytical, insightful, thoughtful, and well thought
Measured against 240 other newsletter portfolios, Arch Crawford was #1 Stk Mkt Timer for the 5-yr period ending June 1997, for the 2-yr period ending 2003, qnd the 2-yr period ending Oct 31, 2009 according to Hulbert Digest rating service. To be fair, he was in the bottom 10 in 2006, but was #1 Gold Timer that year according to Timer Digest rating service.