
Yesterday we saw a gap down in European and US stock markets on fears over Ukraine. Stocks then continued to sell off during market hours, but US stocks managed to recover some of the losses into the close. At the time of writing US futures are up on news that Putin ended military exercises near the Ukraine border. In fact, it had already been announced that those exercises would be completed today. News typically buffets the market but major trends and turns are set by other factors. If stock markets topped out on Friday then I suggest more relevant is the telling developments in indicators and the relevance of new moon peaks. If stocks have not yet topped out then it also won’t be due to news in the geopolitical arena, and we might point to the strength in cumulative advance-declines and renewed interest in cyclicals. So let’s put Ukraine to one side and see how things look after yesterday’s action.
1. SPY shows what looks like a bull trap. My suggestion last week was that the marginal new high on divergences would be the bait to lure in the last of the ‘dumb’ money. The rip in the overnight futures could set the scene for the gap left yesterday to be filled before downside renews. Volume and RSI divergence are bearish. Cyclicals repaired their January weakness, particularly in the last week, which is bullish, but there is a divergence with the higher high on SPY as shown. If SPY breaks higher again and cyclicals make a new high, then that top may be postponed.
 Source (and other charts below): Stockcharts
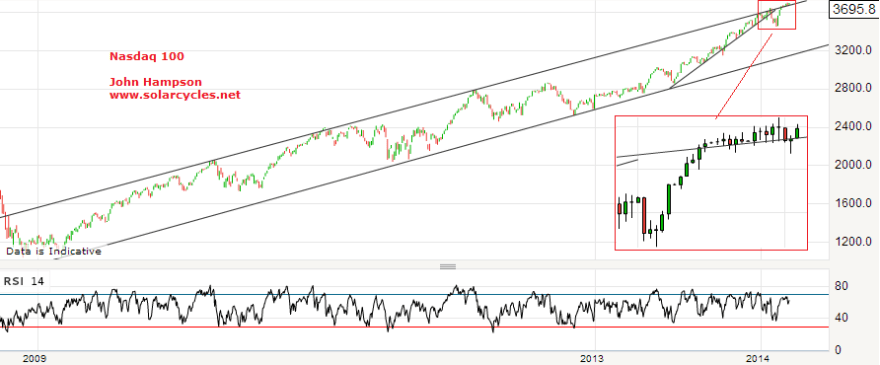
2. The Nasdaq 100 (black line) has room to pull back further before retesting the January high, whilst the breadth divergence continues:

3. On the longer term view, the Nasdaq 100 is creeping along the top of its bull channel since 2009. If it can break up and away from here that would be a particularly bullish development, but I put higher probability on it being dragged back down into the channel, with the RSI divergence joining the breadth divergence.
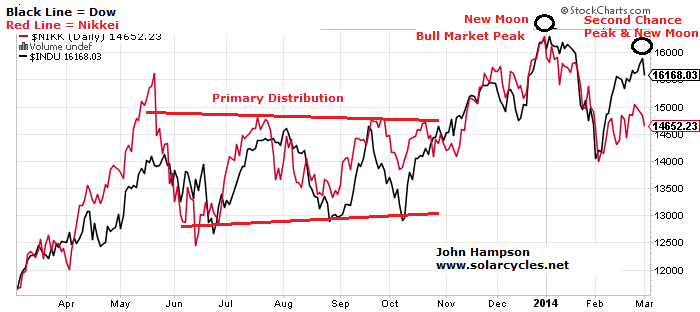
 4. The Dow and Nikkei continue to honour my 31 Dec top call, with their charts still mirroring the topping processes of the historical analogs. 31 Dec was 1 day from the new moon and at the inverted geomagnetic seasonal peak, and if Friday turns out to have marked the peaks in the other US indices then that was also one day from the new moon and at the turn into the seasonal lows of March and April.
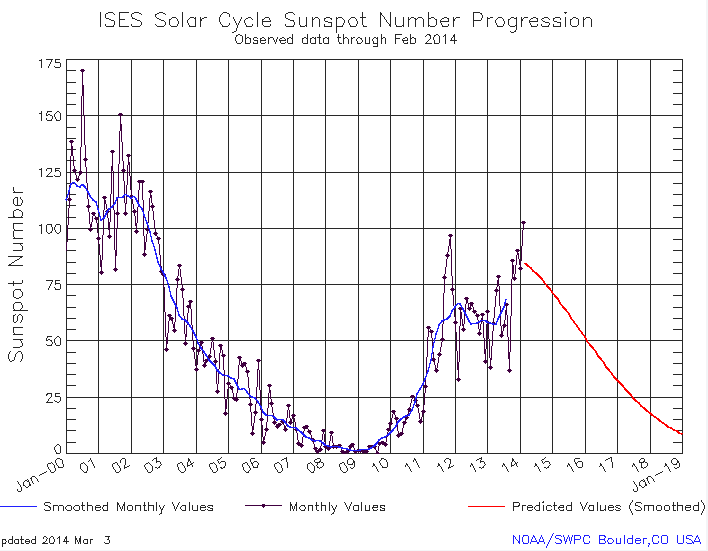
 5. My bull market peak call was also very much related to timing the solar maximum, and below are the updated sunspot charts of NOAA, SIDC and my own. It now looks more certain that the smoothed solar peak (blue line on NOAA, red line on SIDC) will turn out to be around now rather than the earlier peak of Feb 2012, which fits with speculation peaking out now rather than back then. Historically, markets tend to peak close to the smoothed solar maximum and on a monthly sunspot spike. A top at the end of December fits both, and we see evidence of accompanying developments as we turned the year such as Bitcoin peaking, trend reversals in treasuries and gold, and historically high trading volumes and insider selling in January. However, we actually made a higher monthly sunspot spike in February, and that could partially explain why other stock indices made higher highs in that month. NASA agree with NOAA and Solen in predicting the smoothed solar maximum to be behind us and waning from now, but SIDC still have that as one of two options, with the other being a mid-2014 smoothed maximum. If that turned out to be the case then that, for me, would be the strongest reason for bull market continuation until then. However, I consider this lower probability than the smoothed maximum turning out to be the end of 2013.

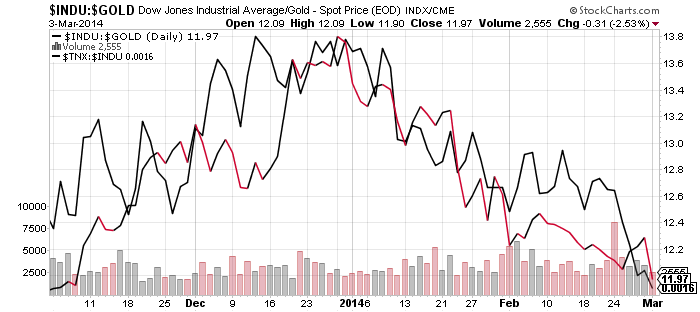
 6. Gold and treasuries continue to outperform stocks and is supportive of the 31 Dec relevance:
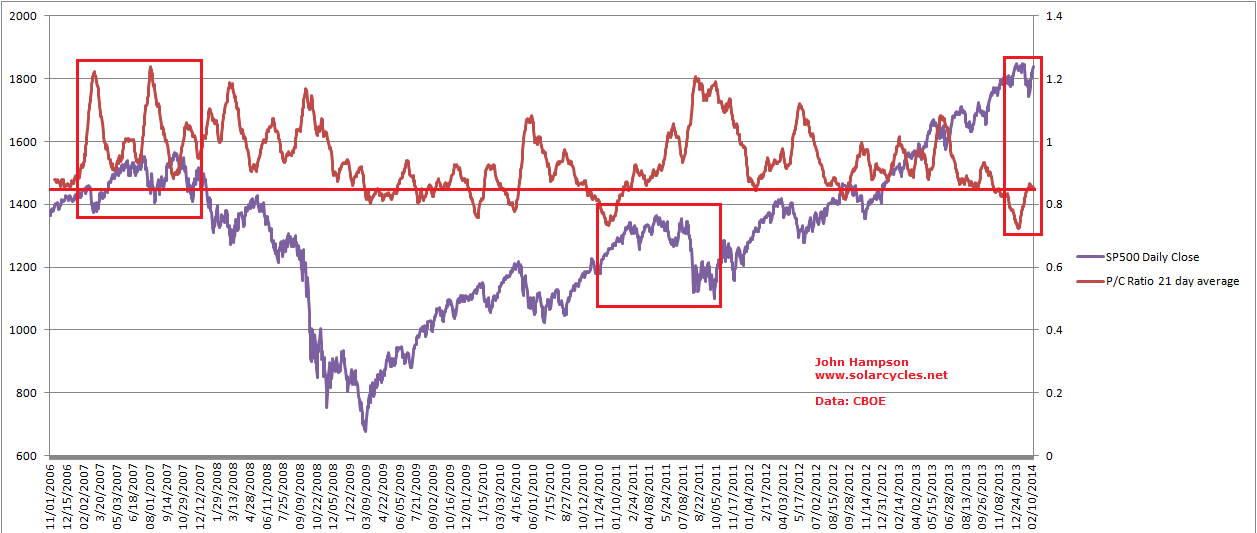
 7. Rydex cash levels and put/call 21 day average share similarities. They are not just at low levels consistent with market peaks, but at historically extreme low levels, that suggest high complacency, the kind of which could be a catalyst for the waterfall declines that I predict are imminent. The 2013 exuberance rally was key to generating these historic readings, whilst similarly postponing any meaningful correction into what I believe will be a super-correction. If we look at the the 2007 peak in the put/call chart we see less extreme complacency than now but also complacency resetting during the corrections in the topping process (the two spikes to over 1.2). This did not occur in the January 2014 sell-off and is another warning of an impending much deeper correction to come.
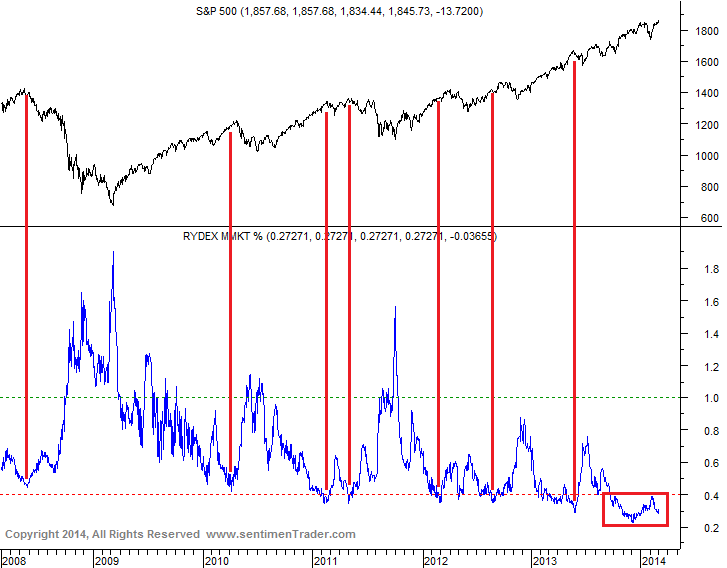 Source: Sentimentrader
 8. Peak excess in equities is also reflected in these 3 charts. Retail investors have belatedly joined the party, as is typical at market tops, and global stock market capitalisation is back to 2007 peak levels whilst achieved on dwindling demographics in the major nations. We see lower overall trading volumes whilst investor net debt, real margin debt and margin debt to GDP (now at 2.72%) exceed 2007 and 2000 market top levels, i.e. less participants but more indebted and leveraged, and this fits with the historic complacency above.

Source: Ispyetf
Source: U Karlewitz Source: Scott Grannis

Dear John,
If the topping of the S&P500 is delayed, which target dates will you be looking at?
Would rather cover that once my current scenarios are invalidated.
Thanks John. The market will always take the most amount of capital it can from the most investors it can whether they be bull or bear.
The common belief is that markets end with a bang, whereas they mostly end with a whimper.
I suspect this market will suck as much fom both sides of the fence and create as much frustration as it possiblt can before it heads over the falls.
I agree with a lot of that.
Well said, Allan. I totally agree with you. John’s charts and analysis are becoming more compelling , and urgent, with the passing of every single day.
Thanks John
^.^
Thank you for posting your charts and resulting findings. This is the first posting I look for each day before I open my charts. Thank you!
Appreciated
breathtaking opening half hour in the R2K. Did someone suggest a panic “into” stocks?
seriously challen
seriosly challenging your theory..Is it time to bail.
Not for me, the opportunity remains golden if we look beyond price.
Done all my short underneath the current level starting at 1824 on the SPX, then 25pt every drop below to a certain level, the first one almost hit it yesterday.
I will prob put another one in at 1849 later today, then wait. I reckon there will be a surprise by he 6th.
The market seems so nervousness a single shot incident would topple this weaving stack of cards down.
Keep up the excellent work John, I find your regular updates are straight forward, factual and very helpful.
Thanks Aaron
R2k is skyrocketing. This is completely insane, crazy, there is not sense for this kind of uptrend. Let’s see what happen when the POMO ends after european markets close.
haha so you finally relize that markets don’t follow logic? welcome to the club 😉
That’s probably a very good sign that the end is close. Very close….
yes these crazy parabolic move… makes me feel the end is close. As of now i dont see any weakness and no guts to open shorts
many cycle come here 3/6 is 5 year / 60 months gann cycle from the 666 low and 7 quarter from 2012 June 4 low
Good luck all
one more additional information
when you look at DAX – the biggest markets for Europe, they have their top on 1/17 or 1/21 after a 5 wave up and yesterday is doing a backtesting to that up trendline.
If today they fail to rally and no folllow thro and in latter day get a close below 3/3 i would be more confidence with US is ready to drop as well.
HOWEVER one point i would like to emphasise, since US is a big global market and distribution takes time, i would expecting this would be the first leg down and a come back (lower high or higher high) likes 2000.
Aaron, what do you expect for the 6th?
Jordi
Ref 6th March
It’s the 5th anniversary to the day the bull market began from the lows of around 3300 on the ftse.
Referring to your (John) dumb money moving in, volumes do seem very low.
Looks like there even sucking out the few pennies left from the poor grannies pensions to push this up.
Jordi
Ref 6th March
5th anniversary to the day, the bull market started from the lows of around 3300 on the ftse.
ok, thanks Aaron
Thank you Sir, my brain enjoys surges of freshly oxygenated sustenance each time I visit your esteemed blog. Please take no heed of this outpouring…
We know nothing of substance about the earth’s core, but we are certain that there will never be anything to concern anyone ever…
http://www.nasa.gov/topics/earth/features/2012-poleReversal.html
(no matter – since we know nothing of substance about so much that, it seems, we are locked into superstition and belief syndromes involving most everything, up to and including the existence of fairies at the bottom of the garden)
And it may well be that there really is no logical explanation for absolutely everything. Now that would be really hard to believe. A person would have be nuts!
Thanks
I.m expecting real capitulation within march´13, but with open mind.
The Investors Intelligence reading at the end of 2013, published the 1st week 2014 is clear, but not always is so accurate with the tops; remember 1999, for instance.
Sentiment was bullish, is still bullish, but several drops in the past make people afraid, and this is not the way.
Probably, S&P surpassing prior highs, Russell, NDX, also Industrials and Transportation would create a REAL BULLISH SENTENCE.
Even more, tops use to be very complex, remember 2000 and 2007 for example.
@apanalis
hi john, love the research and you are obviously bearish, but are you finding any bullish charts to put on the blog, cos there must be lots of reasons to be buying ie.. practically 0% yield on treasuries
Price is bullish and only price pays. But I am interested in what price will do over the weeks and months ahead, and my case is overwhelmingly bearish. My strongest bull argument is if the solar maximum is still ramping up, as noted in this post, but that is a lower probability.
cant short the nasdaq biotech etf due to stock borrowing restrictions, so its at full capacity
so much for the market going down….small caps up “3%” today?!? mkt is beyond a joke…scared of Russia we go down 1%…that where’s off and we go up 3%???
SPX expanding wedge – http://scharts.co/1crLLxy
John
Apologies if ive misinterpreted but arent stocks bullish going into spring? I.e. Sell in May and go away. Just wanted to understand a bit more about the March/April lows you’ve written about.
Duncan
My case for the existence of stock market seasonality is that of underlying seasonality of geomagnetism, which correlates. https://solarcycles.files.wordpress.com/2014/02/13fe41.png
Let’s not forget people that John’s 1929 analogue is based upon the DOW which has yet to surpass the Jan 31st highs and is just one of currently many diverging signals in the markets.
Volume continues to also diverge as per today, on all indices, so it’s not over ’til the fat lady sings.
This market in my opinion is becoming more unstable by the day and is primed to take a hit from one of a multitude of externals.
Remember, it’s what the market doesn’t see that will hurt it the most. I suspect the Ukraine is not it, It may be so insignificant as to pose no threat in a normal healthy market, but this market is becoming increasingly unhealthy. There is surely something coming and when it does, lookout.
An observation on the ”strong” A-D LINE. The market is littered with stocks that have had substantial breaks off their peaks. Yet because the breaks occurred on few days most are net neutral or in some cases positive contributors to the AD LINE despite being as much as 50%off peaks…. I
The long term work I do I learned from a trader who at one time was one of the 5 largest currency traders in the world back when the banks ran the currency markets….Based on that work, the SPX,INDU and DAX are either topping here or have another 5% or less to go.The RUT is at its limit and if it breaks out here I have no limit or target. The NAZ is already past measuring except for the 2000 high.Thus I am looking at the possibility of a bifurcared market based on the tools where the first three move modestly higher into a top while the last two have concentrated parabolic moves… not unlike previous markets where the speculation gets narrower and more intense.
Thank you Slater for the information from your source.
Slater, there is no resistance on the NAZ until it reaches the 2000 top. It’s fairly logical to me that this is a viable target, with or without the participation of the broader market. I don’t like any of it at all, and I’m out of stocks altogether now.
More troubles brewing in China. “China’s Chaori Solar poised for precedent-setting bond default”. A-shares fell, despite all-time high for S&P and govt maintaining a 7.5% GDP growth target,…..
Thank you all for your input