
Just as the defining sector of the 2000 solar maximum speculative mania was Internet, a case can be made for both Small Caps and Biotech as defining manias at the current solar maximum. In 2000 the Nasdaq Composite made a parabolic blow-off and hit p/e >80 as companies were ‘revalued’ on expectations rather than earnings. The Russell 2K currently trades at p/e >80 and the index of Biotech companies trades at p/e>160, with both having a significant weighting of companies trading on expectations.
The Russell 2K trades at its most expensive historic valuation:

Source: Karla Tango
The Nasdaq Biotech sector is in a parabolic trajectory signalling imminent exhaustion:

Source: Blogspot
Marrying the two, the strength in the Russell 2K in 2014 has been dominated by Biotechs:
 Source: Bespoke
Similarly the Nasdaq Composite has been significantly driven recently by Biotech strength. So a pop in the Biotech bubble would have significant ramifications for the Russell 2K and Nasdaq, and the wider markets.
On Friday, Biotech had a significant down day on high volume, having built up a negative divergence in RSI:
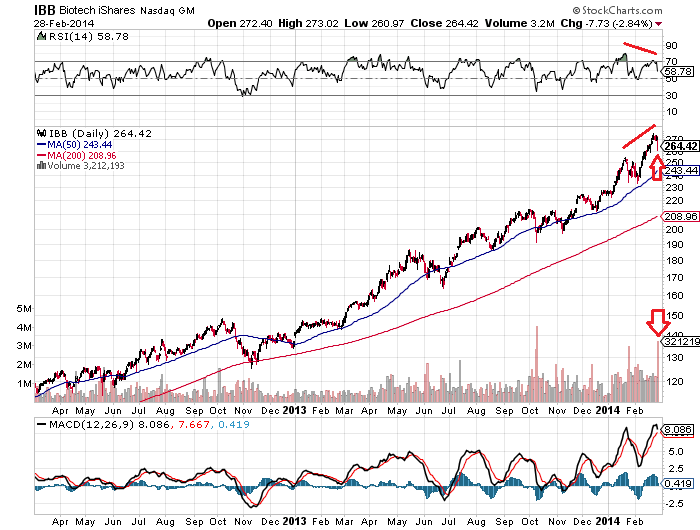 This occurred at the new moon and as we head into the inverted geomagnetic seasonal lows of March and April. Add in the near vertical trajectory of the parabolic on the longer term view and we have the potential for a top having occurred on Friday, but subject to follow through next week.
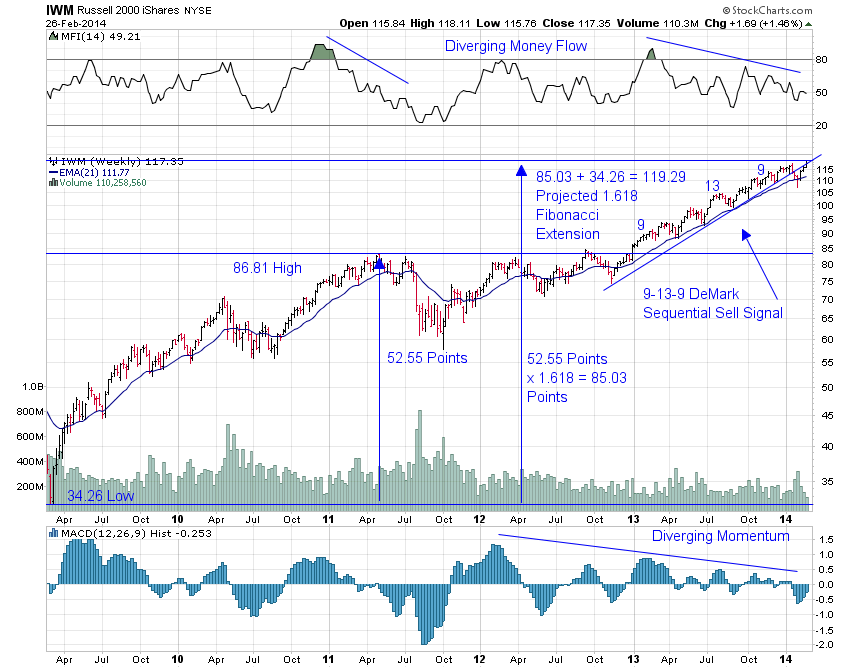
Similarly, the Russell 2K experienced a high volume reversal on Friday and shows other topping signals:
 Source: Stocktwits
To further judge the likelihood of a top, a key question is: could the R2K and Biotechs rise materially higher yet? Whilst we cannot calculate a precise answer to that, we can look to various indicators to build up a case for a limit.
The Biotech sector has risen approx 150% in the last 2 years, which is very similar to the gain in the Nasdaq Composite from 1998-2000. Real margin debt and net investor credit have both now exceeded the 2000 market peak (and 2007 peak), whilst real margin debt to GDP is at the same level as the 2000 peak.
 Source: DShort
Citigroup’s panic/euphoria model, which aggregates short interest, put/call ratio, retail money funds and more, is above 2007’s peak but remains some way off 2000’s mania; whilst their CEM model points to a market correction right ahead which would fit with Friday having marked a peak:
 Source: Citi / Fat-Pitch
Sentiment as measured by Investors Intelligence with 10 week smoothing is above or at levels that have previously marked tops, with an exception in 1986-7 where the market first rallied higher for several months before ultimately crashing.
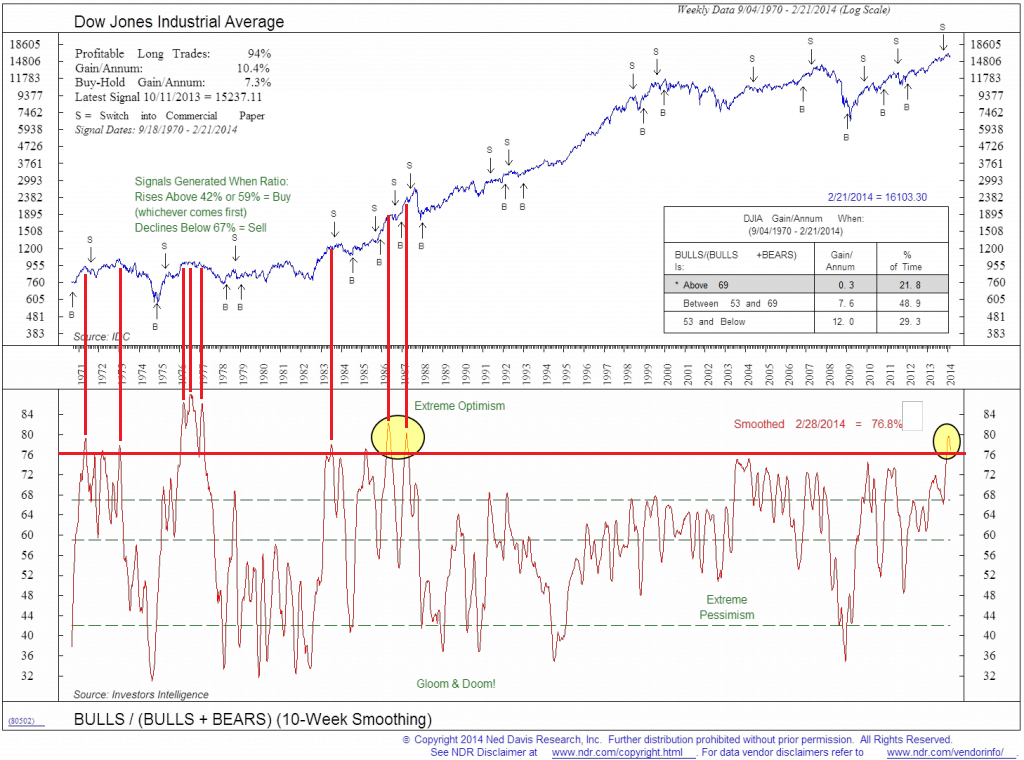 Source: CMG Wealth
Solen’s updated solar cycle progress and prediction chart still suggests a peak at the end of 2013, which is consistent with the Dow and Nikkei having topped out then and other indices now rolling over to join, and my own daily sunspots chart also reflects this:
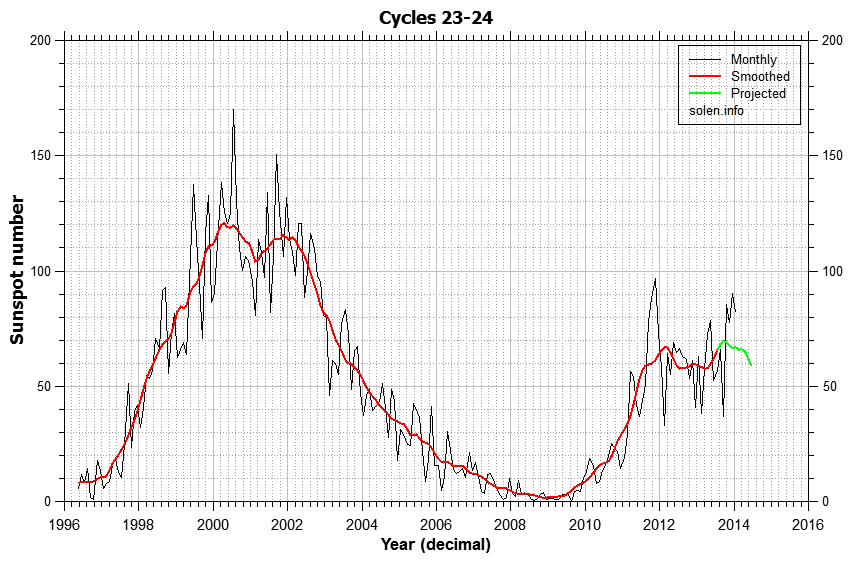
Source: Solen
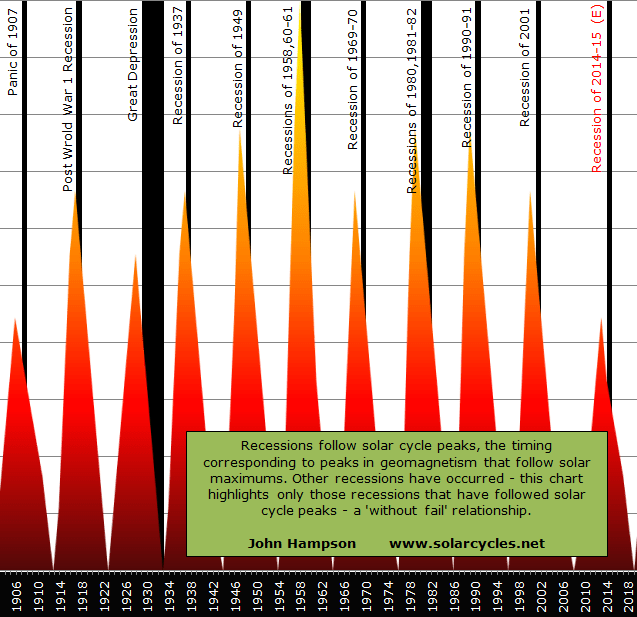
The waning of the solar maximum has historically given rise to a recession in the US. ECRI’s leading indicators rolled over in early 2013 and have recently reasserted that downtrend. Any further deterioration from here would suggest such a recession is coming, and that sort of timing would be a general fit with the business cycle:

 Source: DShort
In keeping with that prospect, 20-year treasury bonds look to be breaking out following an 8-month basing:
 Source: Fat-Pitch
Drawing all together, I have a reasonable case for the Russell 2000 and Biotech to have peaked out on Friday, with the latter feeding into the former, and both into the wider markets. The Friday candles and volume and the negative divergences in both the R2K and Biotech suggest a peak. The Citi CEM, new moon and inverted geomag seasonal lows of March and April suggest follow through could then occur this coming week forwards. The rate of trajectory of the Biotech sector suggests terminal exhaustion should be close at hand, and that would then feed into the R2K’s fortunes as per the Bespoke table above. Valuations, leverage and sentiment collectively suggest significant further gains are unlikely. Solar speculative maximum timings suggest other US indices should now be ripe to join the Dow in rolling over, or more specifically began a topping process at the end of December which is now completing, and in so doing becoming leading indicators of a looming recession.

Great work, John. Theres a piece on Biotechs below that also points to a possible top.
http://blog.kimblechartingsolutions.com/2014/03/pay-attention-to-the-hottest-markets-on-the-planet-and-putin/
Thanks Duncan
John–Your work is top notch and I really appreciate you sharing it with us. If the top isn’t already in, it will very likely be within days or weeks. Profiting from your knowledge comes down to timing when to go short. You appear to have been scaling in over the past two months. Are you at your maximum short position now?
Thanks Jake. About 75% – I will add the rest as the market resumes downtrend.
The s&p is still in an uptrend. There’s no such thing as ‘the’ top. DJ has topped as have lots of other indices worldwide. I think a steep decline can’t happen without de S&P joining the party. Best guess is that other indices will ‘wait’ (trading market) for the S&P. The S&P is simply the biggest market on the planet (one ring to rule them all…)
This mismatch in topping behaviour means the correction will be significant. But only then when the s&p gives in. And I don’t think we are there yet. We’ll see.
Thanks
Bravos.
I am salivating because my strategy of shorting the R2K while owning a Structured Note that pays 11% per year in the next 2 years as long as R2K is above 700 may pay-off big time.
John, you are marvelous and your work add to my confidence……As the situation changed, I will change. For now, I am accumulating RWM.
In your previous post, I said R2K has reach its limits relative to the $SPX ($RUT:$SPX) performance again. Bad things happened to R2K when it did in the past.
.
Thanks Newt
My ‘Newnorm’ indicator suggests SPX with 50% chance of seeing upside just beyond the 2000 level by end of April, with only 20% prob of dipping back to 1825 next week.
Of course it is a new thing so this next phase will be a very good test.
It would merely extend yet another 6 to 8 weeks the onset of an overdue correction, so not all that significant in the larger view.
What is this indicator Peter?
any thoughts on the 40 year kress cycle bottom due in 2014, about september?
My long term cycles are solar and demographic, with the two being linked. So I don’t know about a 40 year cycle.
if one does cycle analysis, purely on DOW-price, one finds a ~43 year cycle. Ihafe found some explaination in soalr cycles, and some planetary. But with such long cycles we need several hundred years of data to be sure, and so far we dont have that much data 🙂 Btw 2014 is analog to 1929. To be exact, if the cycle is 43 years… then year 2015 is analog to 1929…
Just to say I will respond to comments and questions on the last post and this post first thing tomorrow
http://swingcycles.blogspot.com/2014/01/the-really-longgggg-term-part-1.html
OK thanks, that’s the Kress in more detail. As per previous comment, I have evidence and reasoning for solar cycles and demographics being the main long term influences.
Perhaps SPX’s Second Chance has been achieved in $SPX:TLT. ..turning to “risk-off”?
Would the escalating geo-political uncertainty in Ukraine dampen bulls’ mood to buy?
We will know the answers very soon.
John,
you persistenly refuse to consider very reliable indicators, that don’t fit to your scenario as „anomaly“.
For instance if you look at the ratio-chart $dax:$bel daily rsi, you will see, that an rsi below 30 almost always signaled a buying opportunity. Only exception: September 2008. The same held true, if the rsi turned up slightly above 30.
Monthly coppok-curve also turned up again.
$NYAD is going up steeply anyway. In a century or so you have found two incidents, where equities and A-/D-line topped together, but if I understand you rigth, none, where stocks entered a bear market while A-/D-continued to uptrend sharply.
10 weekly MA of oexa200r just stopped its decline and is running sideways. So the similarity of this indicator to July 2011 was broken.
Sticking to your bearish scenario is really approaching stubbornnous, which one should definitly ignore for the sake of ones portfolio.
In my opinion, John tries his best to dispassionately analyze the markets with an open mind. You can characterize his attempts however you’d like, but I find his work extremely valuable. He might be proven wrong, but it’s more than a little interesting that the crash timing of another successful market timer (Jeff Seymour, who created the Greedometer market crash warning gauges) is lining up so closely with John’s.
I’ve made some good timing calls in the past myself, and I think a stock market crash initiates very soon. I personally think the big money this cycle will be made with gold and gold stocks, but shorting the market (starting now) is likely to prove to be very profitable as well. A good way to do so would be to go long the VIX, especially using one of the leveraged ETF’s like TVIX or UVXY. I think it’s likely the VIX hits 100+ at some point during the coming crash (before the end of Q2 2015).
Wow Dj
Nice post. We think alike.
Thank you for sharing. I visited the site…Very interesting food for thought. Heed to the Shiller PE ratio.
Do you know John’s trading time frame?
I would urge all readers to judge me objectively. I am just one guy publishing a trading journal with certain unorthodox threads of research. It is for you to decide whether or not I am biased, delusional or incompetent, and if you judge me so then please filter me out and focus on those sites/analysts/traders that you trust.
John, your work is amazing. I believe the period from march end to mid november (7.5 months) is a dangerous period for this market. Any comment on your target for S&P at the end of this period? My belief is that it will be a breathtaking plunge!
Thanks.
Putin ex machina. With so many bearish indicators it doesn’t seem like it was necessary, and we will see if it is enough. Many parabolic blow offs end 2 months after the last sideways correction. That would be this month to go. I favor now, but Saddam Hussein said he was going to pull out of Kuwait and the market rallied.
I believe events in the Ukraine are being engineered, but that’s another post for another day. With respect to said events and their impact on the financial markets, Jeff Seymour nails it with this brief post: https://www.greedometer.com/russians/
Thank you both
I always enjoy reading your trade analysis and articles John. Thank you.
I do believe that July – November will be a tough time for the market. The question is will it be a Primary IV down or a larger Cycle 2 down (to use Elliot Wave terms)?
We should soon receive the answer as we’ll either continue to rise from tomorrow into mid/late March/April and then on to higher highs come July for a Primary III top or we have indeed already seen the top of Primary III top and we’ll likely fall into mid/late March/April time before a final Primary V (1 whole uptrend run) into a July top.
For now I think we’re still in Primary III but that will be put to the test this week for sure.
I read Tony Caldaro’s website as well.
Thanks
Sooner or later you will be right. I would watch 1825 and then 1737 personally…..
Some Feds are ready to to go from lower gear to higher gears. If the recession hits, expect them to cease tapering, buy in at the low on equities, but gold also good to hedge the massive QE4 / abenomics that Yellen and friends might unleash because comments recently that they may aim for higher then 2% inflation to increase employment and try to beat deflationary forces. A recession now also will force more to contemplate waiting to retire.
Hi John, do you incorporate institutional buying and selling in your analysis, like the url below http://www.stocktiming.com/Friday-DailyMarketUpdate.htm.
I did see that chart, but when I look at it, I don’t see anything predictive – it seems to be reflective of price action rather than leading. Tell me if you see different.
you analyze the prior trends and prior peak, bottoms, and crosses, and compute probabilities, just like every other type of analysis 🙂
GEOMETRY in place for short term selloff in pm stocks and SLV…..we shall see…
Janbenestad, ref your 1929,1972, and 2015 43 year cycle tops. The five year is almost always up. However, both eclipse pairs that year have the solar eclipse occuring before as opposed to after the lunar eclipse. someone commented on this site that solar before lunar is more bearish or actually portends a crash per Puetz crash cycle. I cursorily looked at several years and it seemed true. I believe Puetz say that the key is if the solar and lunar are within 2 weeks of each other. This year’s firstr eclipse pair is the lunar on April 15, and the solar is Apr 29, exactly 2 weeks. Major peaks frequently occur on lunar eclipses.
hi Kent, I only do cycle- and solar-work – no moon or eclipses
The ~43 year cycle is bearish into ~2025, and we are at solar maximum (waiting for the solar maximum bear market). My 3,5 year cycle has a top this fall, so we could stretch this even more… making it as euphoric as 1929. But right now we have a bearish setup from March to ~June. It may materialise, or morphe back into something bullish 🙂
I would like to contribute more to the Puetz crash window discussion. Here is what i read:
He showed that 8 of the 12 greatest stock market crashes in history from the Holland Tulip Mania in 1637 to the Tokyo crash in 1990 fell within a time frame of six days before to three days after a full moon (usually also a lunar eclipse) that occurred within six weeks of a solar eclipse. The odds of this happening by chance are estimated to be less than one chance in 127,000. He also explained that a lunar eclipse full moon close to solar eclipses seem to be the triggering event that allows for the rapid transformation of investor psychology from manic greed to paranoia.
Puetz was not saying that so-called “Puetz windows” always lead to crashes, but that if a crash is going to occur, a Puetz window would be the likely time frame in which it would happen. Puetz windows tend to occur every year or two, while crashes are rare events.
2014 Apr 15: Total Lunar Eclipse
2014 Apr 29: Annular Solar Eclipse
and
2014 Oct 08: Total Lunar Eclipse
2014 Oct 23: Partial Solar Eclipse
For April 2014 the window is 4/9 – 4/18.
4/14 is a Monday just before the tax deadline.
That is my target.
For October the window is 10/2 – 10/11.
10/6 is a Monday. We may have to wait for that.
Or, perhaps, as John said, we get the March/April crash followed by a 50% retracement because the bulls are convinced it’s “only” a ’87 type crash and then we get another October crash too. Wouldn’t that be something.
My dates are very close to a few of those dates you mentioned
17.6
A reply to your post on the “Higher Close Implications” thread. Just saw the above post as well; which I’m looking forward to reading.
Hi Eclectic,
Some research links for you. The Puetz definition is fuzzy and I think that’s because a single definition doesn’t work. There is something interesting about eclipses but Puetz hasn’t nailed in IMHO.
This is a link to eclipse dates that you may find useful:
http://www.timeanddate.com/eclipse/list.html
This is NASA’s site on eclipses which I love:
http://eclipse.gsfc.nasa.gov/eclipse.html
and here is the 8.8 year cycle on NASA’s page (2×8.8 = 17.6)
http://eclipse.gsfc.nasa.gov/SEhelp/moonorbit.html
Regards,
Kerry
John,
With today’s weakness, what are you looking at in the near future besides SPX price action to further confirm the ‘waterfall’ decline.
There have been some very interesting comments here lately on Puetz Crash Windows. The rules Puetz came up with are obviously very contrived, and therefore difficult to follow in practice.
Total eclpises are most important because the sun, moon and earth are perfectly lined-up. Partial eclipses are more common because of the lunar declination cycle.
The two-week period between total solar and total lunar eclipses mentioned by Kent is so important because the moon swings from new moon (perfectly positioned to give the earth maximum shielding from positively-charged ionization in the solar wind), to full moon (perfectly positioned to reflect it back onto earth).
This scenario causes the greatest variation in ionization, in the shortest possible time. We are now approaching the next Minor Lunar Standstill period of the lunar declination cycle, and total eclipses will be relatively frequent. In fact, as eclectic pointed out recently, there will be a tetrad of four total lunar eclipses in a row between April 2014 and September 2015 with no partial eclipses in between. And a total solar eclipse in the middle.
This is why Gann told us, 105 years ago, that 2015 will be a year of panic. I would suggest that, rather than see a two-week crash window, we will see a two-year panic window.
The effect on gold prices should be obvious, but it could also cause a panic INTO the stock markets as ordinary people around the world become increasingly concerned about their savings being confiscated by a “Supertax” and forcibly converted into govenment bonds and some new-fangled economy fund, and inflated away by money printing. Officials, especially in Europe, have recently been openly advocating these measures.
Group; what am I missing here?
In this conversation between Peter Elaides and Chris Carolan; they list the Puetz date of the Mississippi Bubble as December 28, 1719.
http://www.wallstreetbear.com/beginner/Puetz%20Eclipses%20-%20Peter%20Eliades.htm
From this link, there were two solar eclipses during the year 1719: February 19, 1719 and August 25, 1719.
http://eclipse.gsfc.nasa.gov/SEcat5/SE1701-1800.html
And from this link there were two lunar eclipses during the year 1719: May 23, 1719 and November 15, 1719.
http://eclipse.gsfc.nasa.gov/LEcat5/LE-1799–1700.html
Anyone care to reconcile these data points? BTW, here’s a chart.
http://www.thebubblebubble.com/mississippi-bubble/
For one thing prices were still on the upswing in 1719. Secondly, there is also too much time between the solar eclipses and lunar eclipses during the year 1720, when the crash occurred.
So maybe it doesn’t have to be a lunar eclipose following a solar eclipse and this is the exception to the rule?
Hi Eclectic,
I have responded to your question re eclipse dates above in this article.
Regarding this, I have different solar dates to you
http://eclipse.gsfc.nasa.gov/SEcat5/SE-1799–1700.html
Solar: 5 June, 1 Nov, 1 Dec 1719
Lunar: 23 May, 15 Nov
So the Puetz conditions existed. Using mu understanding of the Puetz window, you need a lunar eclipse after a solar eclipse so that gives the November dates only. Then you look for a top 6 weeks before the lunar eclipse, so approx 1 Oct 1719. And then you’d expect a crash in the 2 weeks after the lunar eclipse, so 1 Dec. This seems to fit your bubble chart roughly. I always allow a few weeks around this as Puetz in his book says that it sometimes is shifted by a lunar month forward or back.
This is a good spot by you, thanks for flagging it. Please keep us informed of your research.
Regards,
Kerry
One other thing, if you wind my 17.6 year cycle back from 2000 it gets you to 1718, 1 year out from the Mississippi top, not bad going back nearly 300 years. Food for thought.
Regards,
Kerry
John,
Still looking at March 6-7 as a high before a decent correction. Markethighsandlows.com
Hang in there…..Might only be the SPX that makes a new high. That will leave a large amount of non confirmations.
Scotty
17.6/Mark:
Thank you for your posts. Can you see why this is so MADDENING!
Different dates for solar or lunar eclipses depending on which link one uses??
How then can one have any confidence when you can’t trust the data?
If you click on my link; you get my dates for eclipses; but if you click on the 17.6 link; you get his dates; which are different!
This is enough to drive a serious researcher nuts! Any explanation?
John, forgive me for not acknowledging your contribution. I’ll certainly be aware of the ‘6 days before; 3 days after’ the lunar eclipse rule.in both April and November.
17.6
I may have accidentally stumbled onto something significant without ‘spotting’ the significance; which you point out? I thought the ‘6 week rule’ was only AFTER
a solar eclipse; but the rule you point out looks like a new wrinkle? Again, either an F for Puetz in technical writing or an F for me in reading comprehension.
Tks again all. Cheers.