
Small range day for equities yesterday, on low volume, consolidating the previous day’s advance. Gold has paused at its first meaningful resistance level of 1350. Treasury yields decline also currently arrested. So are we to see precious metals and bonds reverse their 2014 trends here whilst equities break up and away? Let’s take a look at some charts.
1. We have a possible analogy from July/August last year, shown below. Then, the market appeared to be rolling over by the end of July, only for a gap-up candle to a new high, as occurred this Tuesday. In that 2013 instance, it represented exhaustion.
 Source: Stockcharts (and next two charts)
2. Total put/call ratio is now 5 months under 1.0, which is a historical extreme:
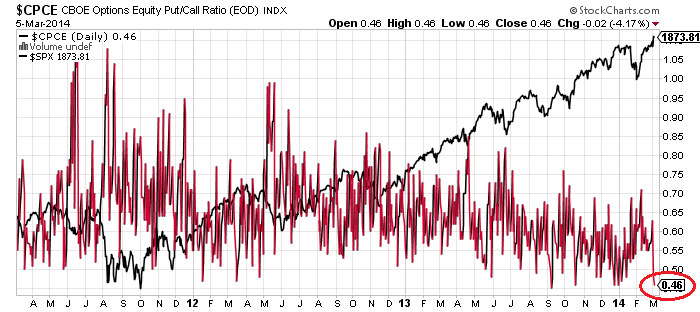
 3. Equity options put/call ratio yesterday moved back to historic extreme low:
 4. ISEE put/call index 5 day average over 200 for the second day, other instances shown:

Source: Helen Meisler
5. Skew remains historically elevated for 5th month. Weekly Skew reading suggestive of another top, as per the beginning of Jan and other historic incidences.
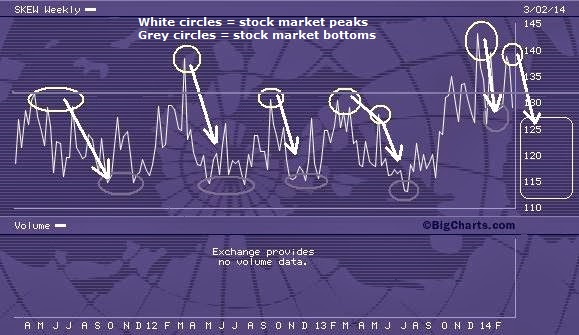 Source: Keystone Speculator
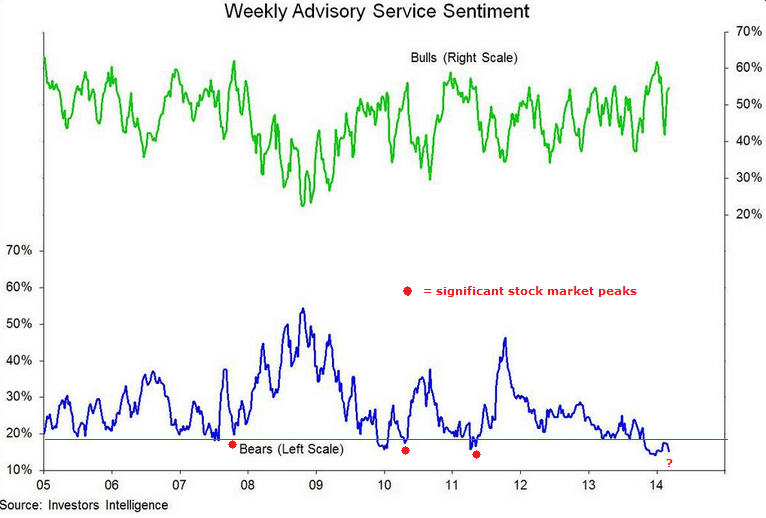
6. Investors Intelligence %bears is beneath the level associated with significant market tops in 2007, 2010 and 2011. Also note those peaks occurred on the second spike down in %bears, which is potentially what we have now (with end of Dec dip):
Source: Willie Delwiche (My annotations)
7. Euro-USD is at long term resistance and has had a reasonable correlation with stock market performance. Break out or break down here?

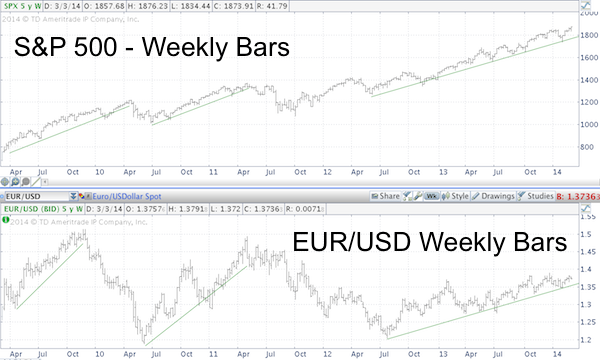 Source: Ispyetf
8. The two measures of breadth of cumulative advance-declines and % stocks above MA are divergent. Which one is more reliable as a leading indicator? The below charts show that the former (NYAD) typically expands into market peaks whilst the latter (using a combination of 50MA and 200MA) typically diverges into market peaks and is more of a leading indicator. This suggests we should be looking at a market peak now, not a break out.
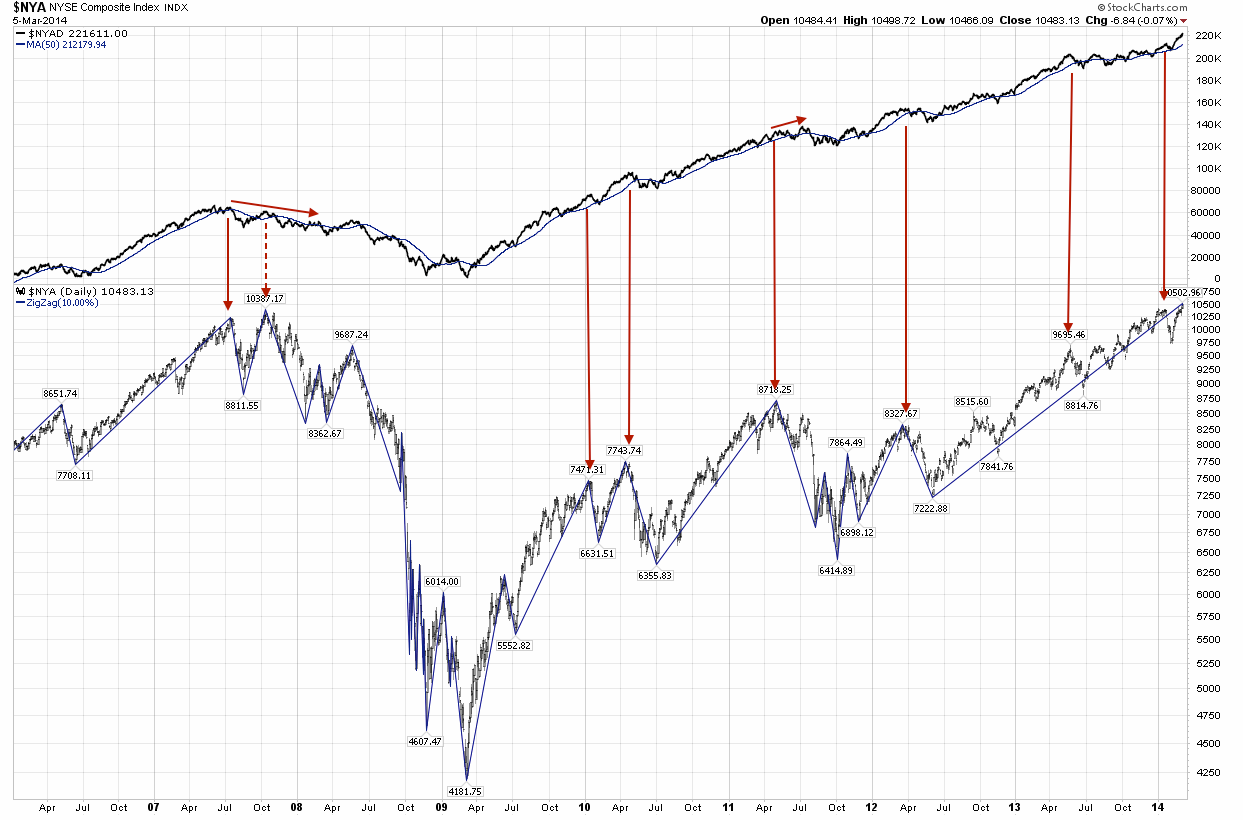
 Source: Fat-Pitch
In short, the balance of evidence still points to the stock market reversing down here, rather than breaking up and away. Maybe tomorrow’s employment report will be the catalyst.

You and I are on the same page, John. Add another voice to the club calling for (at least) a meaningful correction to start soon — Erik Swarts, who does some of the best fractal analysis I’ve seen. Check out his latest article. I think it adds a provocative perspective to the ongoing debate re: near-term market direction. http://www.marketanthropology.com/2014/03/the-46-parallel_5.html
Thanks DJ
I have known the trader joed for 13 years He always says what he thinks.This is from his blog traderjoed.blogspot.com
short term resistance
http://stockcharts.com/h-sc/ui?s=TNA&p=60&yr=0&mn=4&dy=19&id=p71653620978&a=331801219&listNum=26
intermediate resistance
http://stockcharts.com/h-sc/ui?s=$RUT&p=60&yr=1&mn=7&dy=19&id=p80241874885&a=333831815&listNum=26
long term…..PRICE will do whatever it wants… All my work says it should at least pause here.
http://stockcharts.com/h-sc/ui?s=$RUT&p=M&st=2002-1-1&en=(today)&id=p40012891676&a=224691875&listNum=5
Eclectic on astrology. I am a member of the church of what works. Gann’s 60 year master time factor cycle works and is well correlated with solar cycles. Puetz crash cycle not so much, but interesting. Cycles, well they work sometimes random? The Bradley Model based on astrology/astrology worked remarkedly well in years past, not lately. By the time I learn the rules, they change the rules! The credit cycle seems most important. The master time factor says we are in a secular bull market since 2010, looking good. However for the first time ever, population growth is much slower and world population will actually reverse by 2050. That makes me skeptical of the secular bull. Plus the huge megaphone formation of the markets since 2000 is potentially extremely bearish and the markets are extremely overvalued relative to all time lows (6 pe, 6% yield, and below book), the exact opposite of 2000’s extreme overvaluation (30 pe, 1% yield, and 3X book).
THIS SAYS IT ALL FOR ME
http://www.zerohedge.com/news/2014-03-05/what-happens-when-chart-hits-zero
nice divergence on vix etf`s this last week, its not happened for a long time, i watch the chart all day (along with others) it normally gets crucified
also russell not playing today, anyone reading this now should go short right now. bear flag
VIX
http://screencast.com/t/vDHbxV9O28
biotech etf tanking
Correct ! There’s a good chance this biotech bubble is finally popping. This sector has gone totally parabolic and the correction will be violent.
big wave 3
wow, biotech etf collapsing almost a 1000 points from high of day, yipppeeee, couldbe a bearish sign for dow etc
Yep, this chart is not insignificant.
http://stockcharts.com/h-sc/ui?s=$NBI&p=D&b=5&g=0&id=p07951282203
Aussie gold stocks, which IMO are by far the best leading barometer for gold are underperforming by a wide margin. Today they are virtually 100% down despite the relative strong showing from gold.
This says to me that gold will soon take a significant plunge amd may be inline with a broader market fall
Thanks everyone
Every Friday as the market looks to breaking down the Fed steps in an buys a bunch of futures contracts and keeps the markets afloat. Am I the only one seeing this?!