I played the long side of the stock market from 2009 to 2013, which longer term readers can vouch for. I reiterate that in case there is any doubt amongst newer readers that I may be a permabear. However, I would rather hope you can see my work is as objective as I can make it, bearish as it now is.
I began my series of bearish posts in December 2013 as topping indicators began to accumulate and I entered my opening shorts. I made my first topping call in early January as 31 December 2013, and here is the link to that post: click.
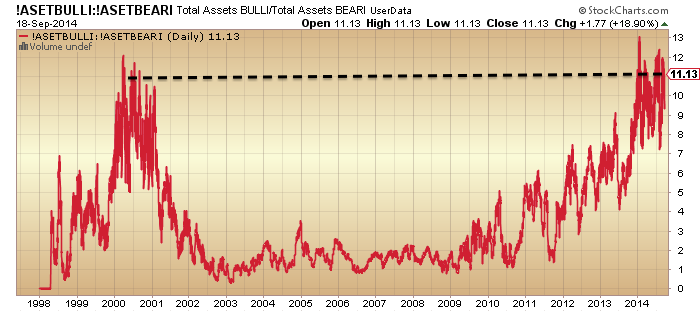
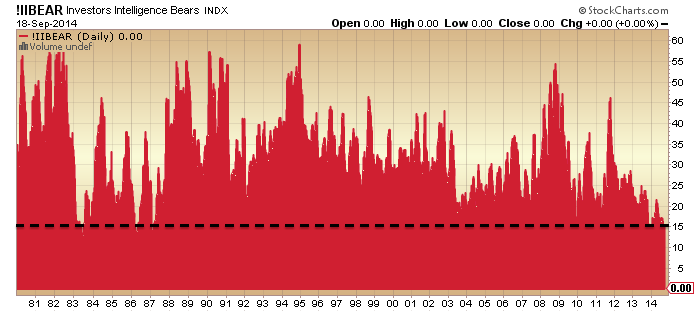
In that analysis I cross-referenced over 30 topping indicators and I therefore don’t have many regrets. It was a strong case, and it did capture certain peaks in risk and the likely beginning of the topping process, as shown here:
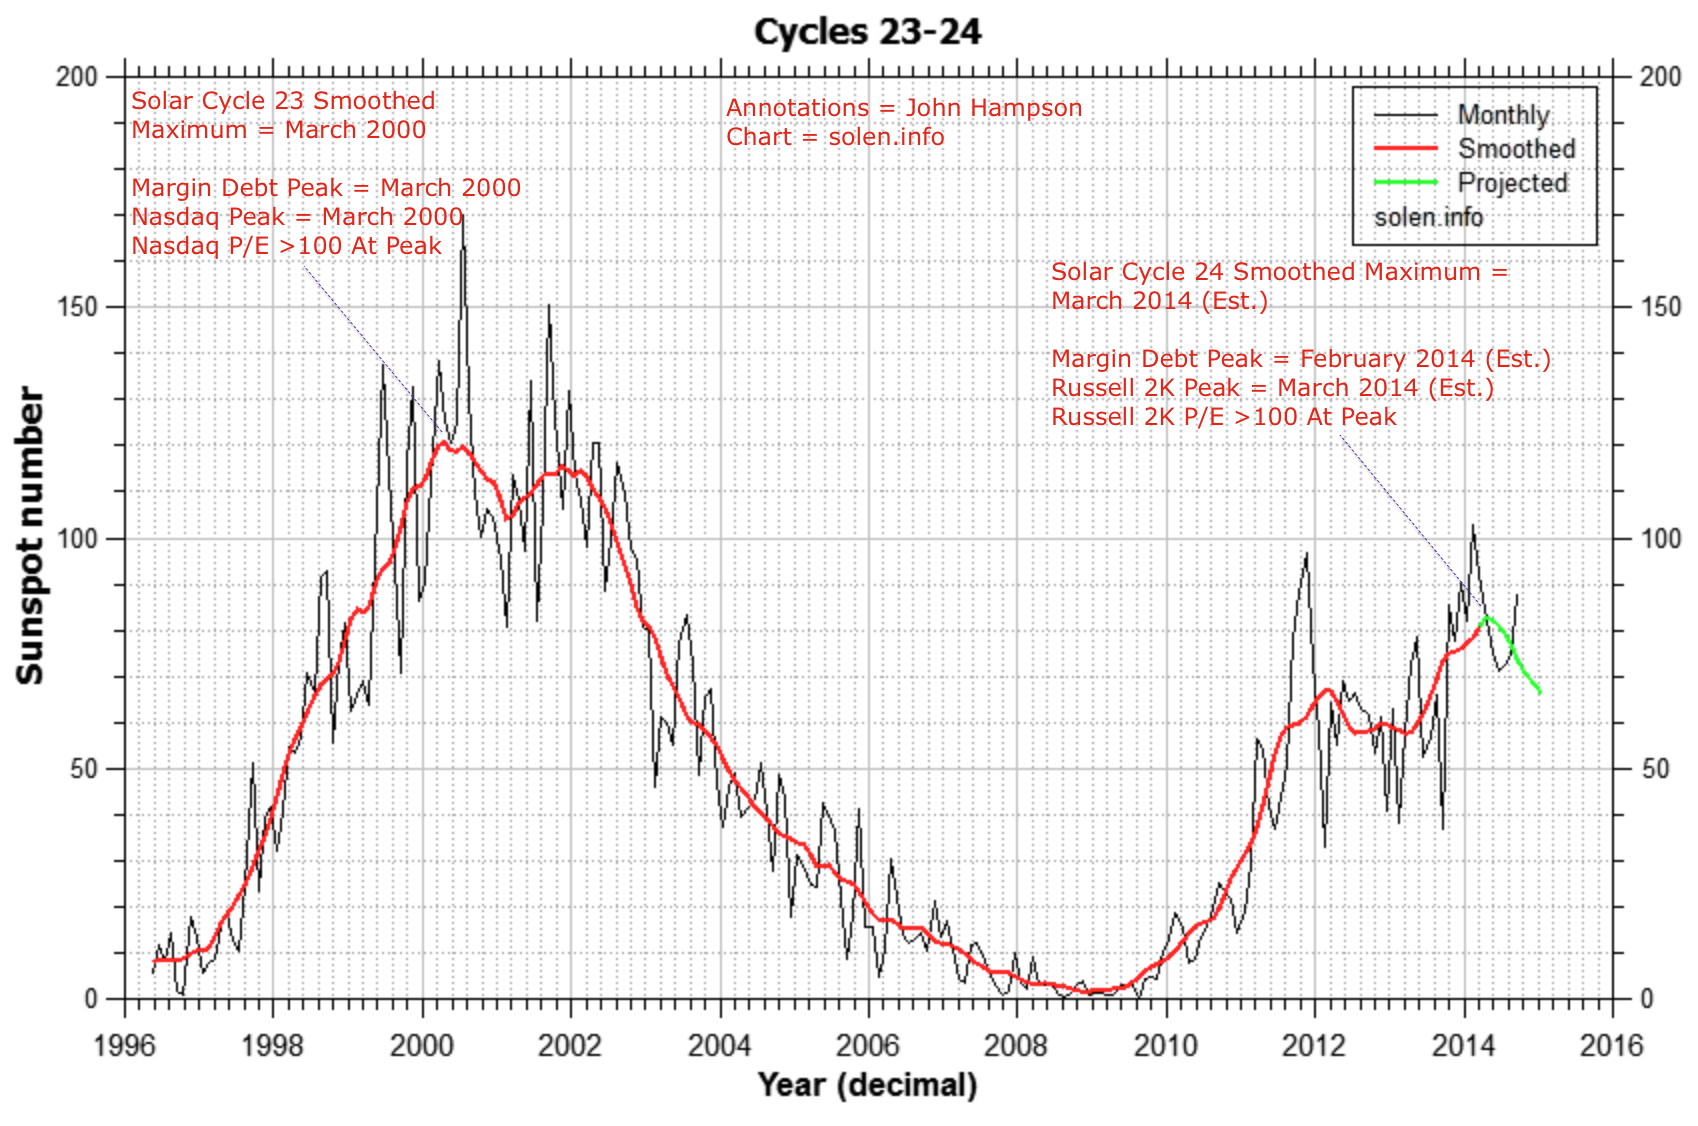
 At that time, leading indicators were predicting a weak Q1, which then shocked to the downside, and earnings guidance was the worst on record. Solar scientists predicted the smoothed solar maximum was already through by the end of 2013, so the whole set up looked very promising.
However, solar scientists got it wrong, as sunspots continued to a (likely) peak of around Feb/March 2014. Therefore, I can now retrospectively account for speculation increasing from 31 Dec through to the start of March, and the negation of my original topping call. But at the time, not much I could do.
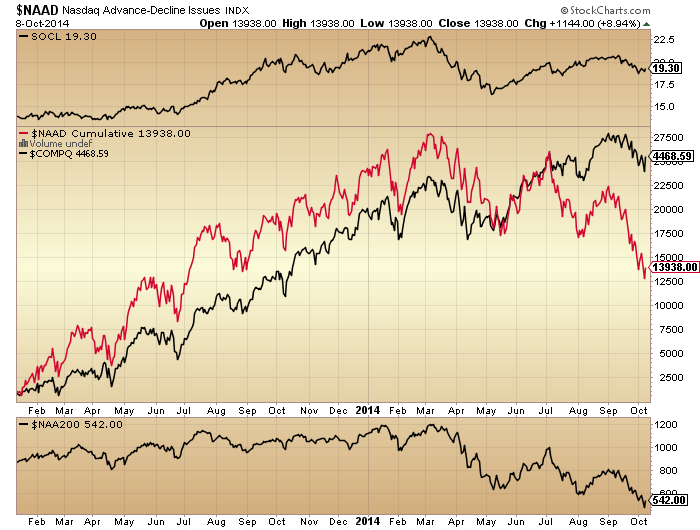
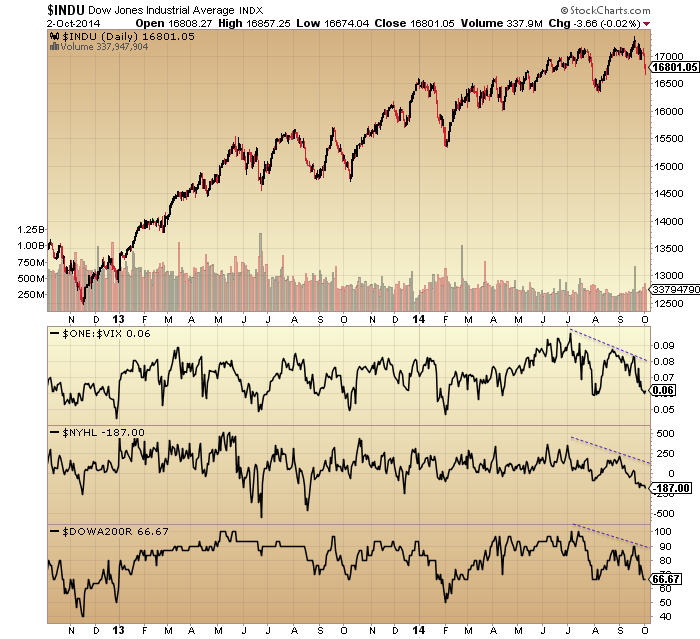
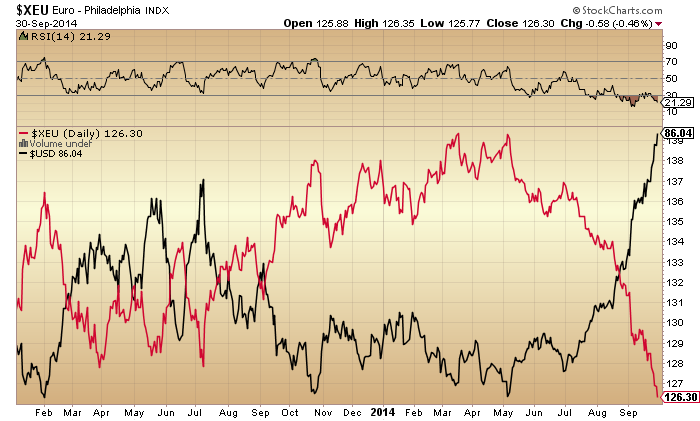
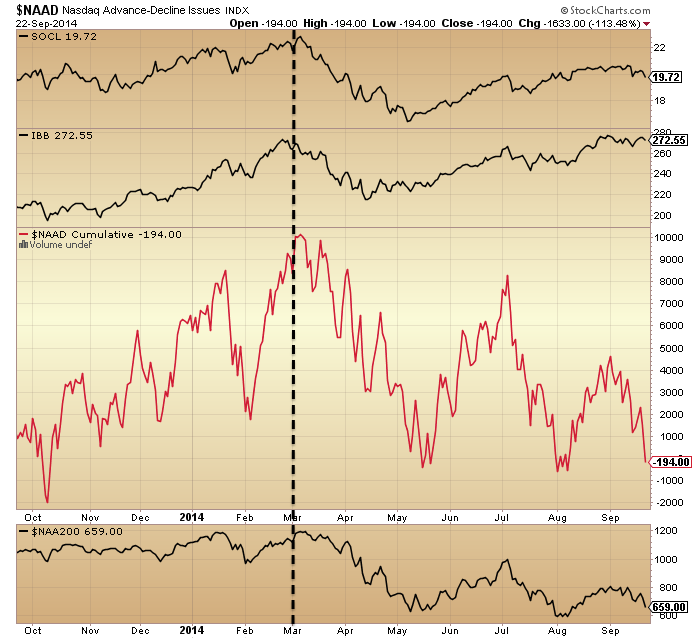
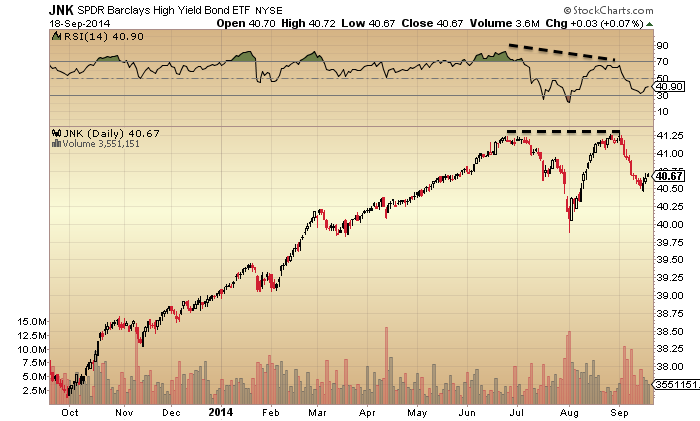
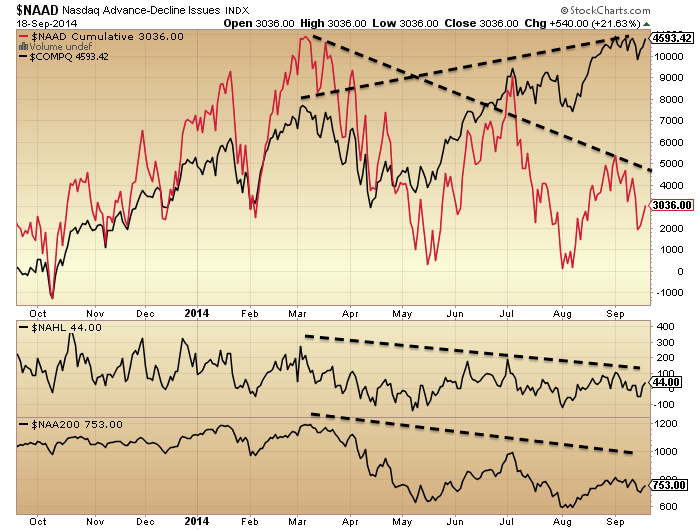
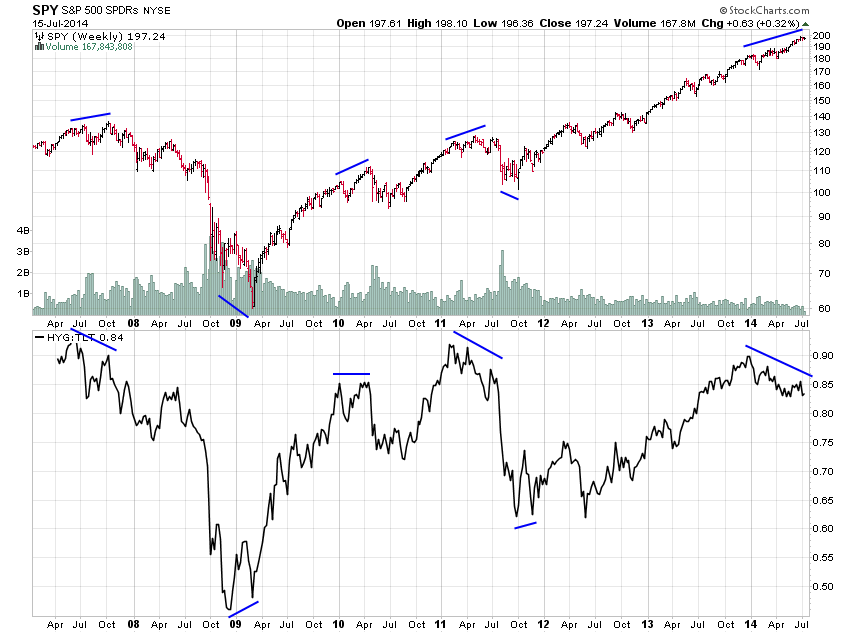
Below I present evidence of that Feb/Mar speculation peak in social media, biotech, Nasdaq breadth x2 (i.e. Nasdaq stocks started to break down here), and relative European and UK small caps performance:

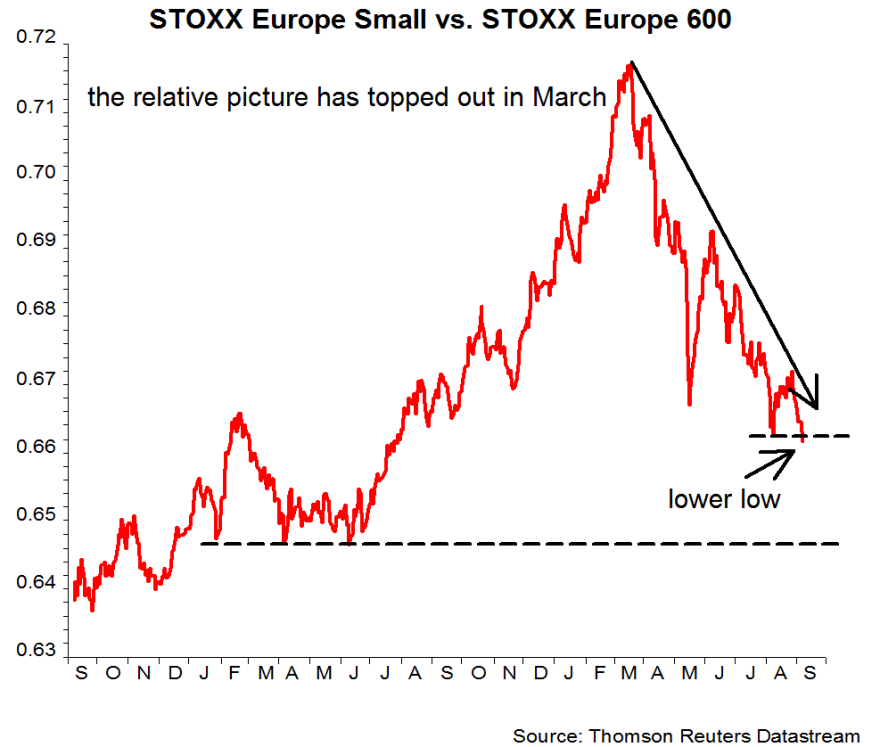
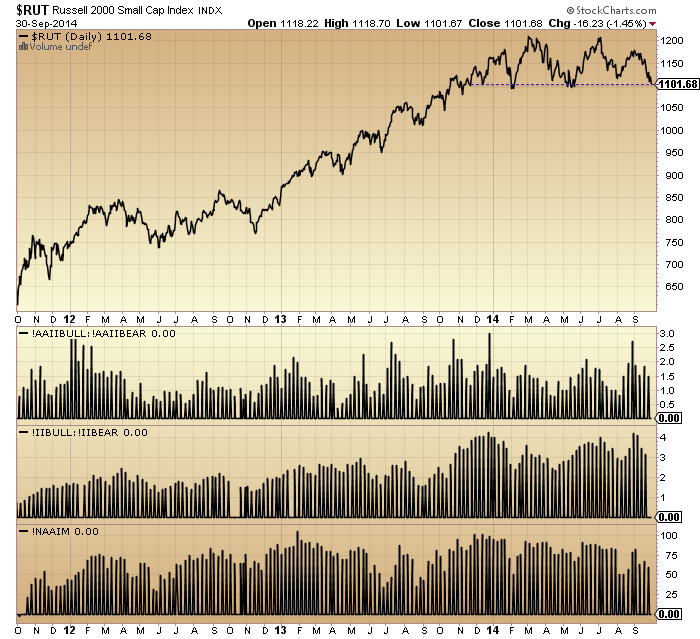
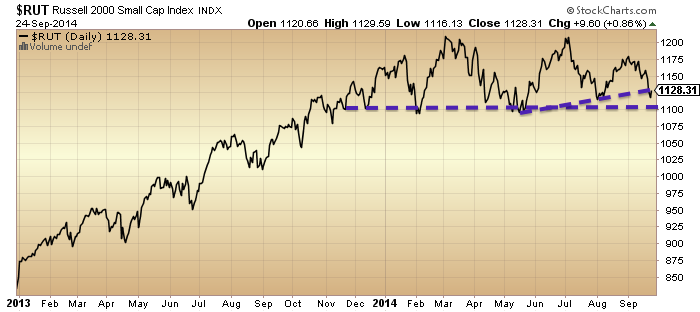
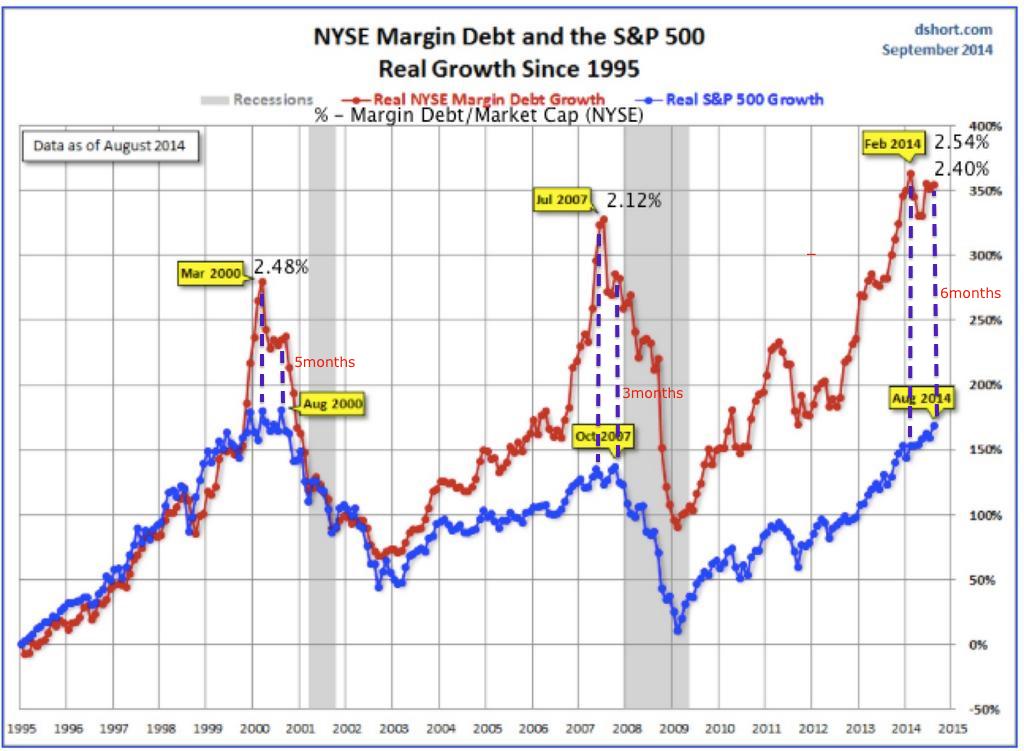
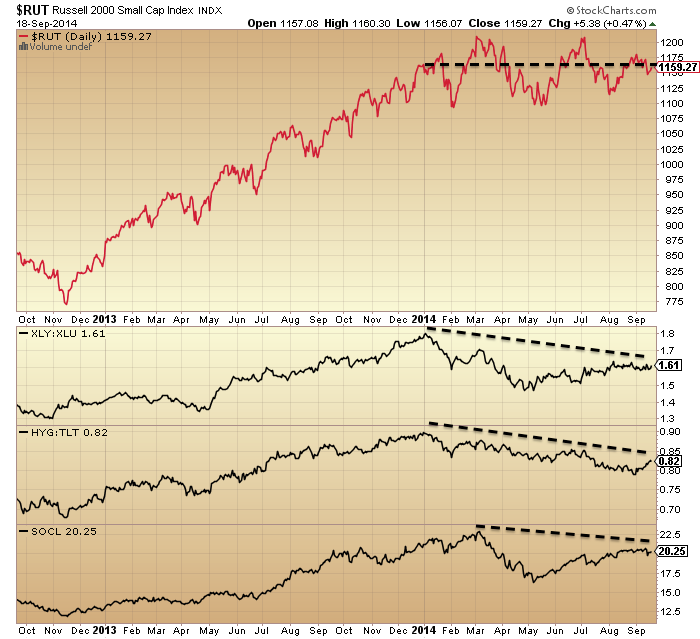
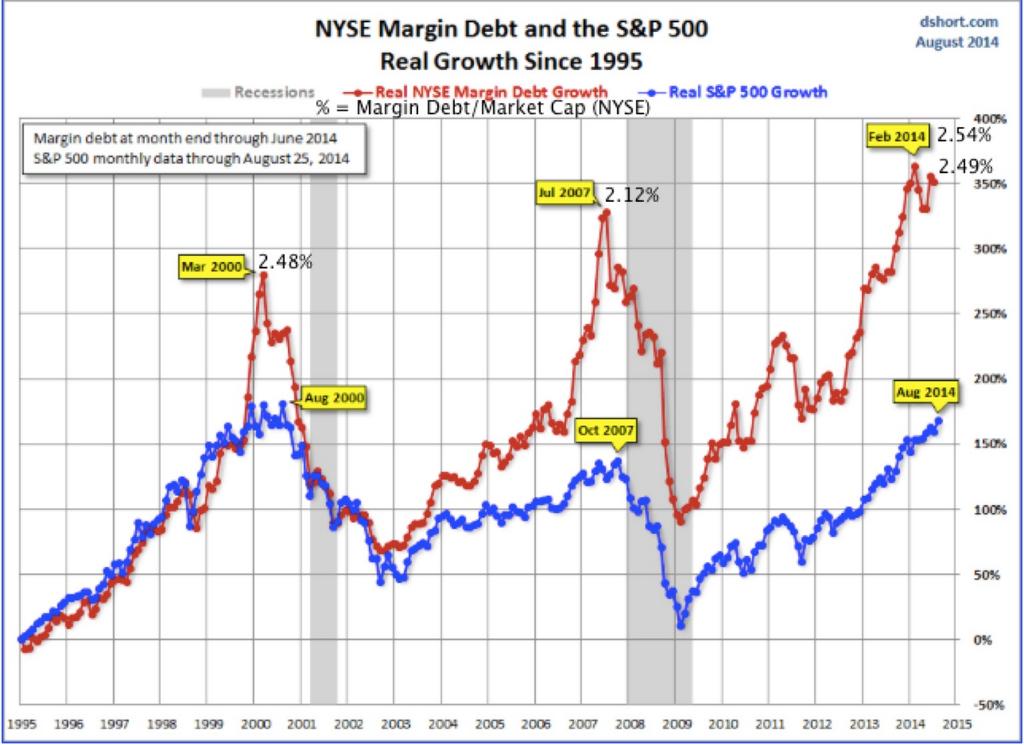
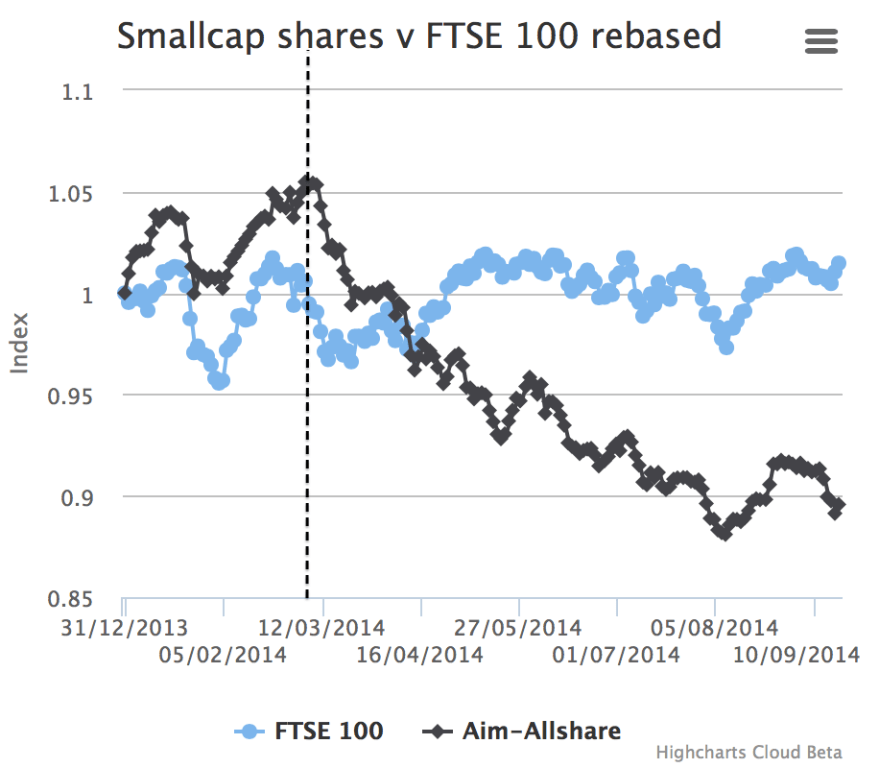 All peaked at the turn of Feb into March, and this fits with margin debt leverage which currently peaked in February. My biggest short position is in US small caps, the Russell 2000, and this index also peaked at the turn of March, adding to the collective case for speculation and the solar max to have peaked at this time.

In a recent post (click) I detailed the comprehensive case for the market peak but stated we were missing a technical break. That R2K chart above shows the likely trigger for waterfall selling. A decisive break below 1100 would confirm and seal the topping process.
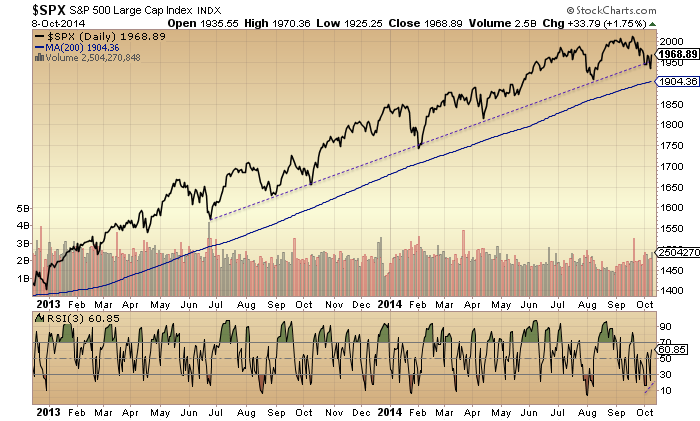
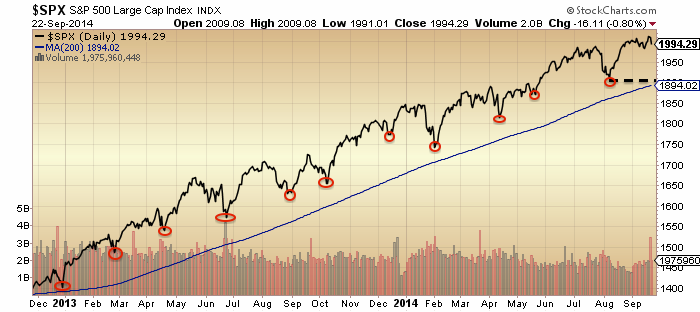
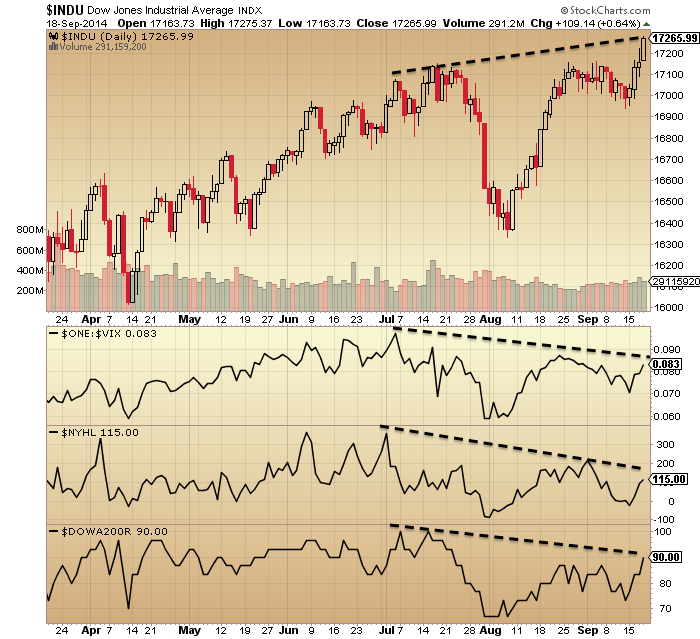
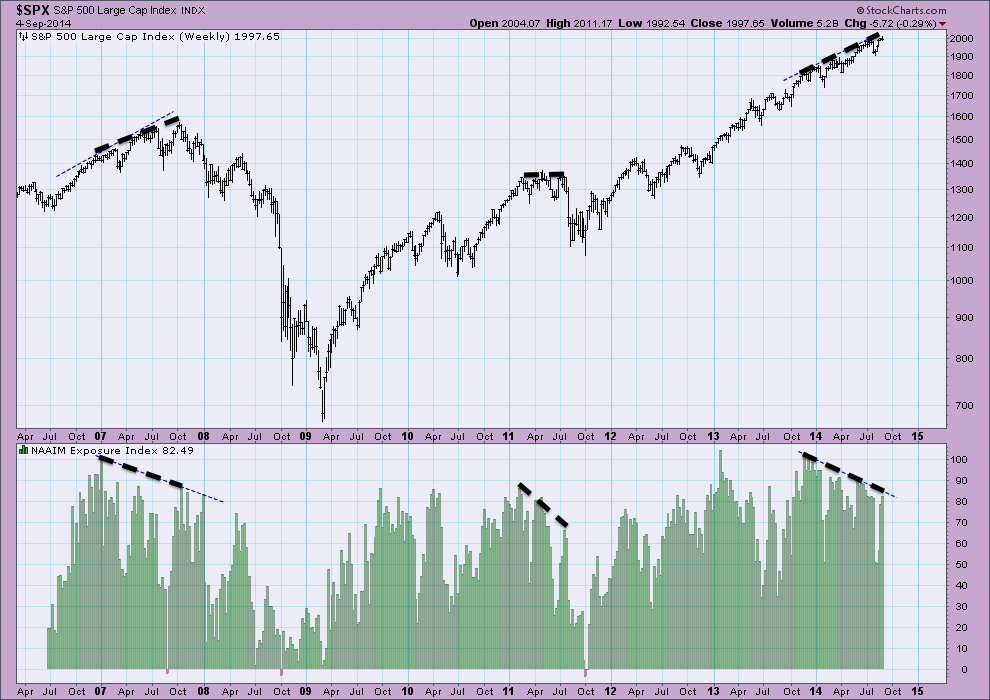
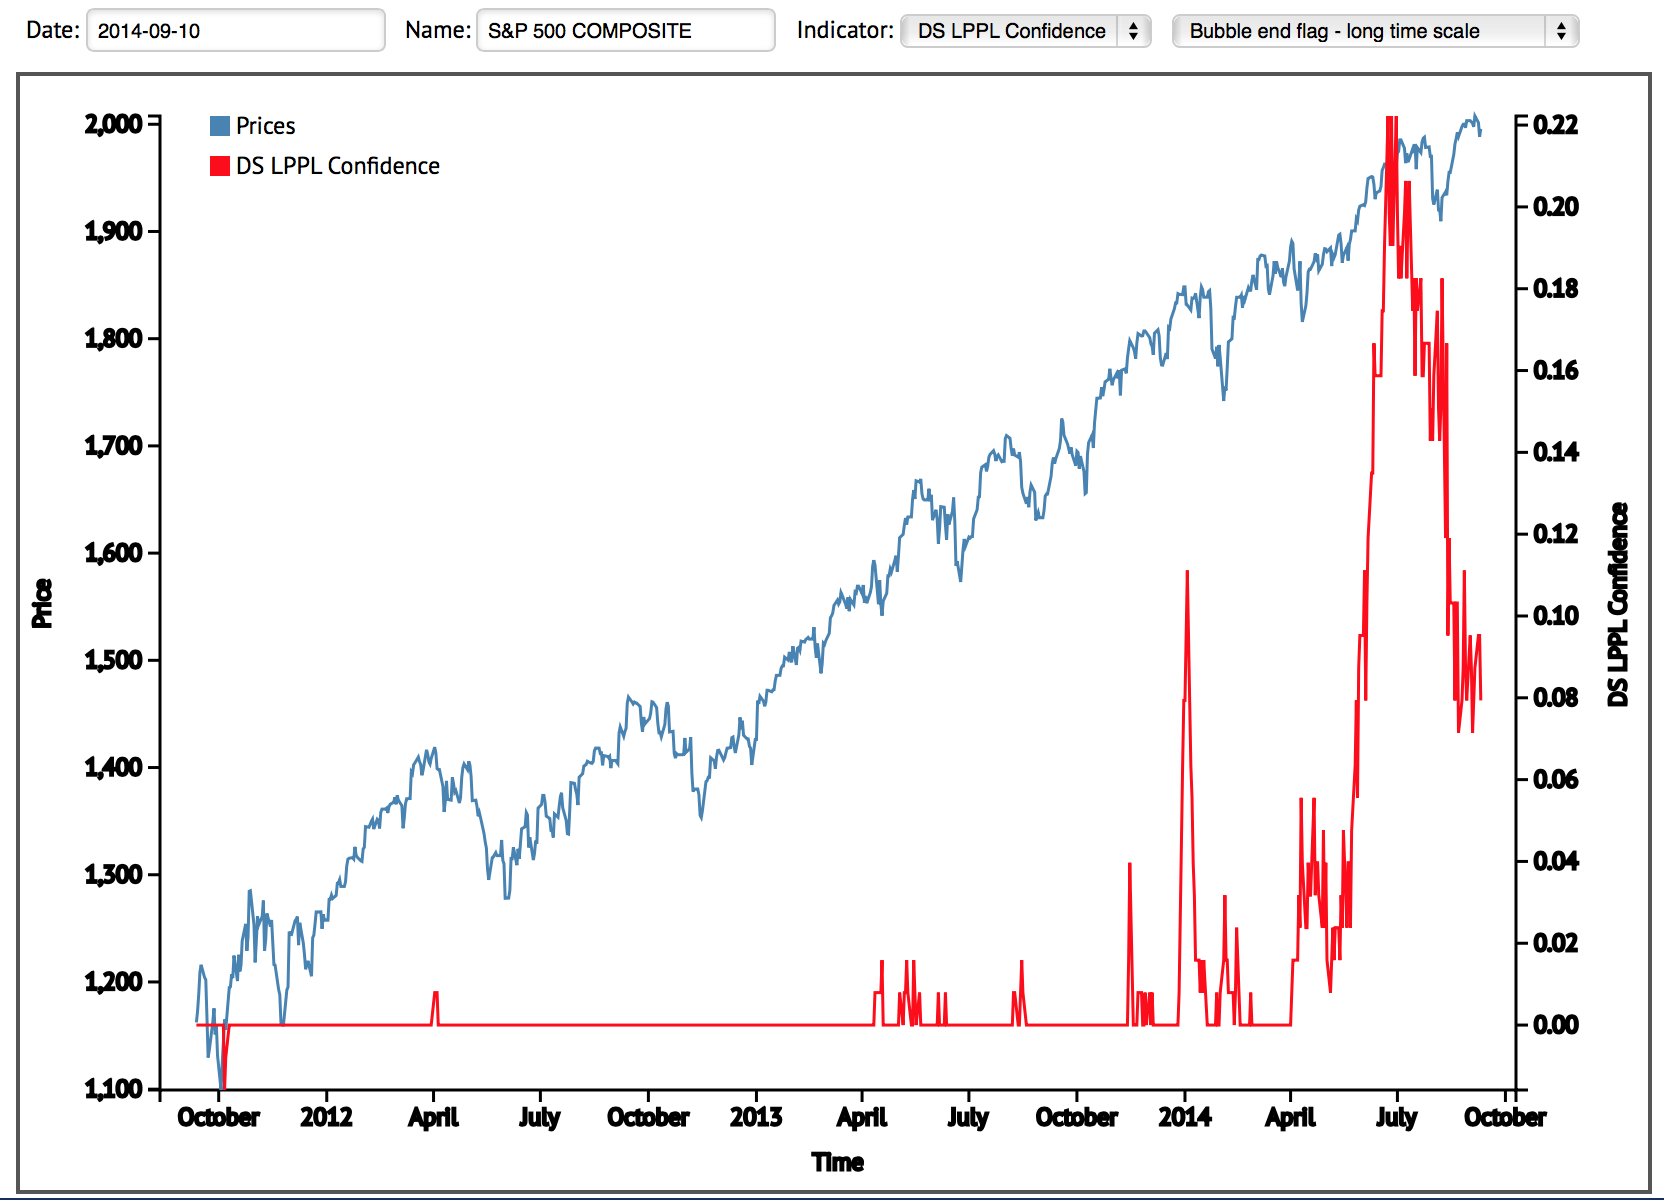
Meanwhile, on the SP500, I suggest the technical break is around 1900, where the 200MA and August low now collide:
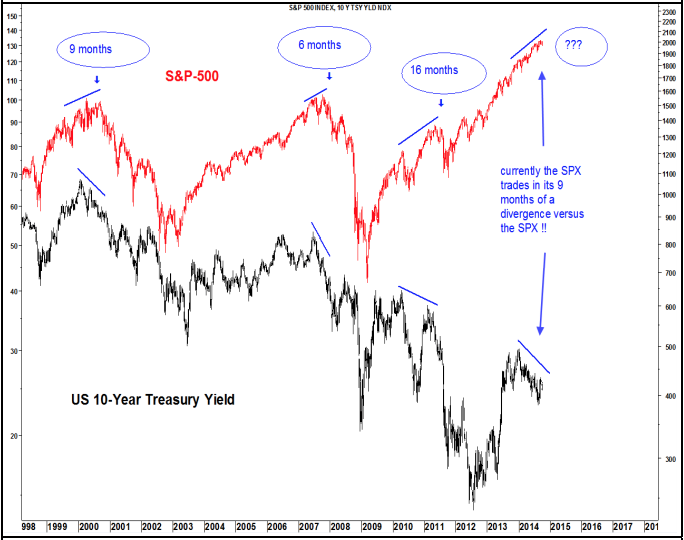
 A decisive break below 1900 would produce a lower low, a move under the 200MA (after 2 years levitating above it) and a break in the pattern of v-bounces. When I look at that chart I see clear evidence of the sun-inspired speculative mania, whereby every dip is swiftly bought up and levitation is sustained. Could Elliot Waves or other pattern techniques really predict that chart, and its ultimate conclusion too? I find that hard to believe, as I see a mania which is only predicted by the solar maximum, and the chart does not have a more ‘usual’ ebbing and flowing of sentiment waves. However, something sustained the speculation in large caps between March and now, so what did?
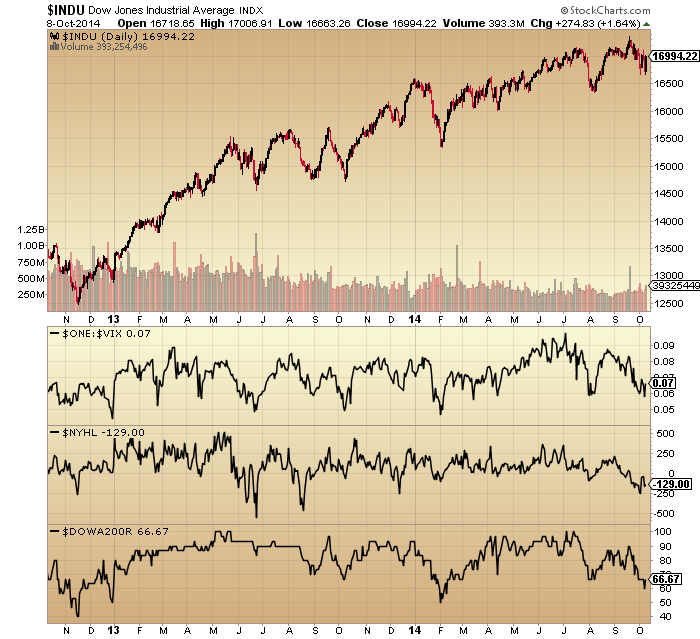
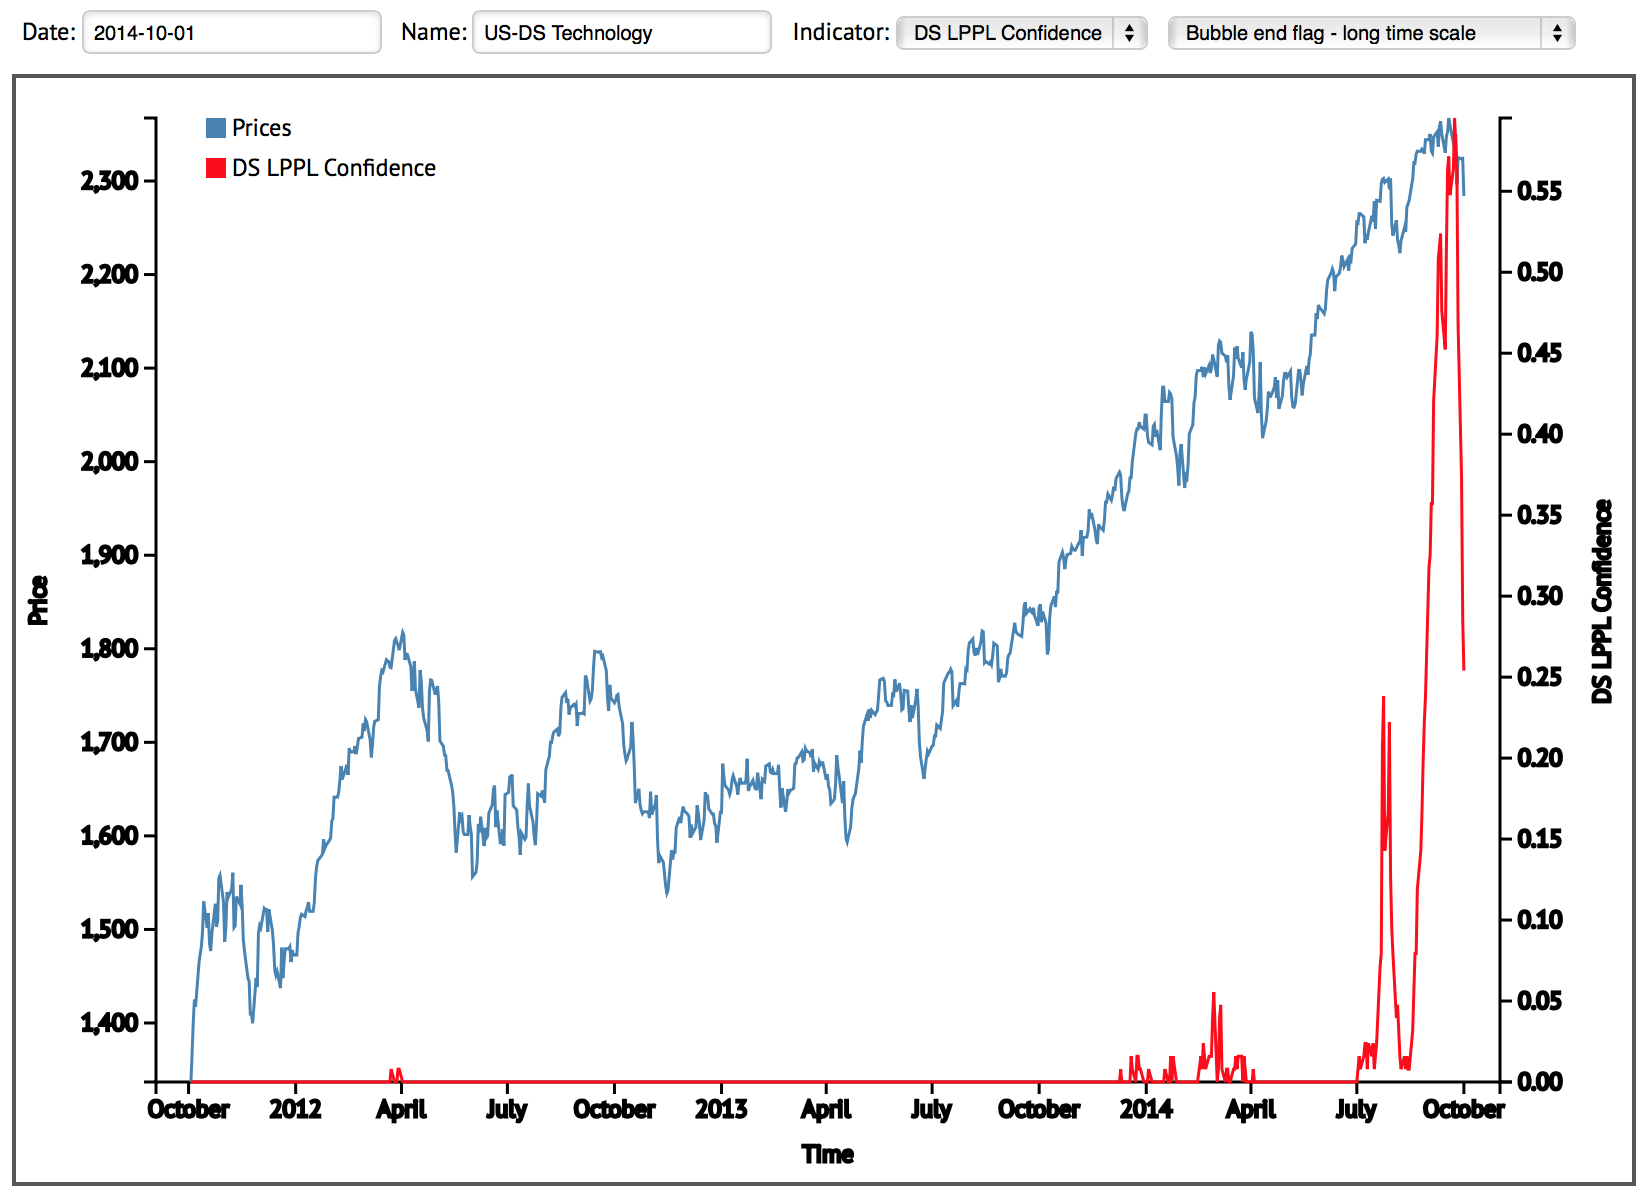
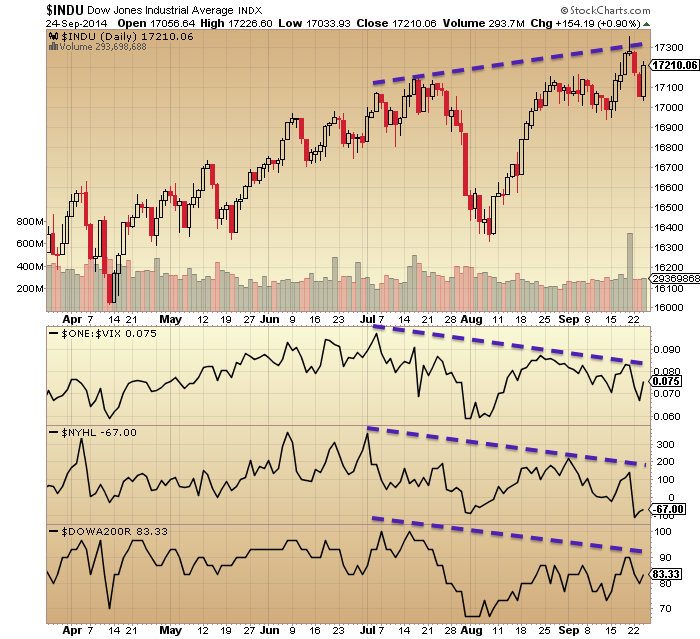
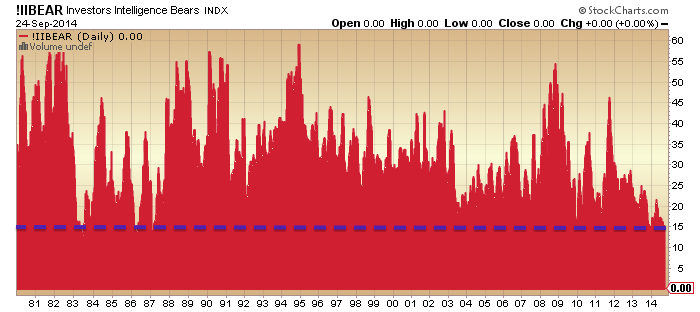
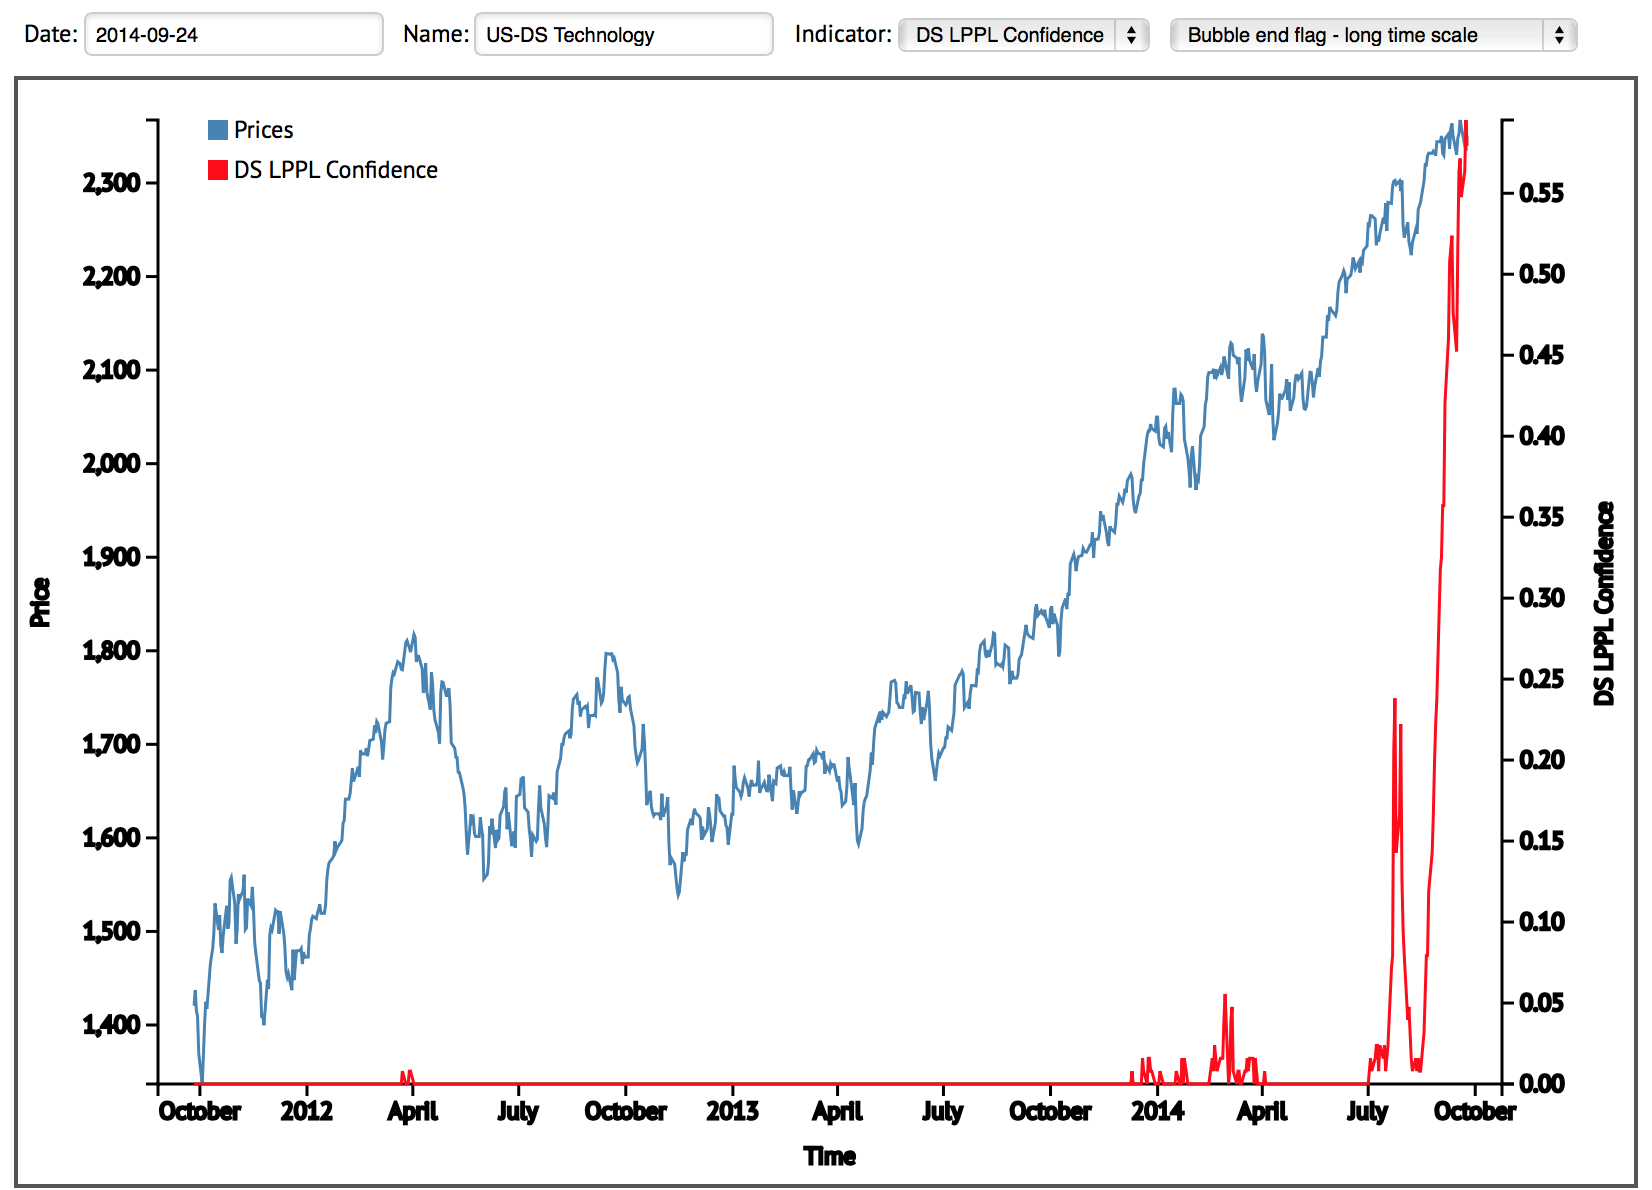
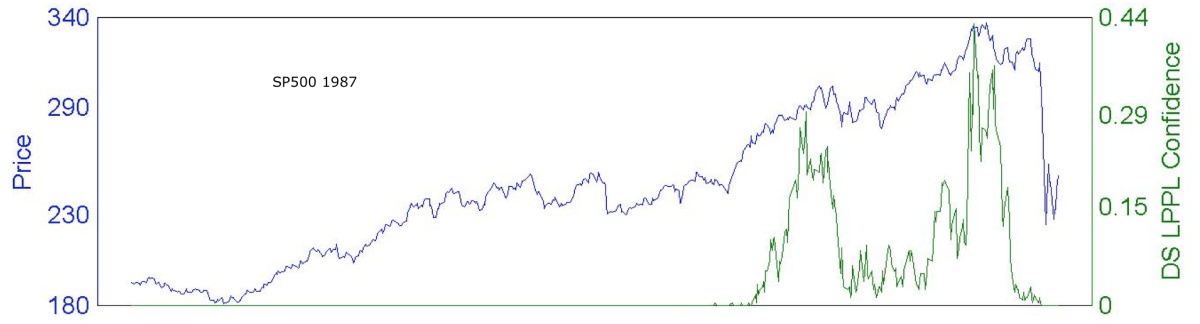
Certain additional topping flags have congregated in the last 2 months: vix divergence, extremes in volume, more negative divergences, higher Sornette bubble end flag intensity. But none of these offer anything revolutionary to what was present at the start of the year. Certain divergences were not so mature in January, but equally certain divergences are now too mature (versus historic norms). In short, I don’t see anything major now present as a topping flag that was missing before, but rather only a few subtle additions which add to the case. However, I put that out to you readers for your views.
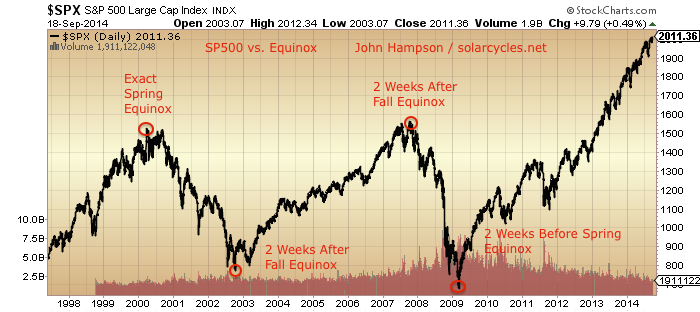
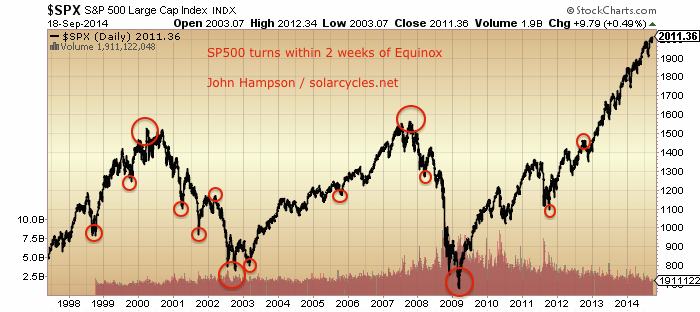
The Nikkei did not top until 5 months after the smoothed solar max in 1989, so a top at the turn of August-September in 2014 fits that kind of lag, though here we could argue that the speculation targets were RUT, SOCL and IBB and have conformed to a tighter fit with the solar peak. Either way, I believe the market is on borrowed time since the March speculation peak, which now looks fairly clear. This window around October is the most likely for the falls to erupt, and various measures of ‘fuel’ suggest continuation of the bull market to year end is unlikely. Friday and Monday action looks very promising, and now I look for further follow though to confirm it. But I’ll stick my neck out again and say I believe this is finally it.
So a reminder of targets. Falls were swift and nasty under similar historic conditions:
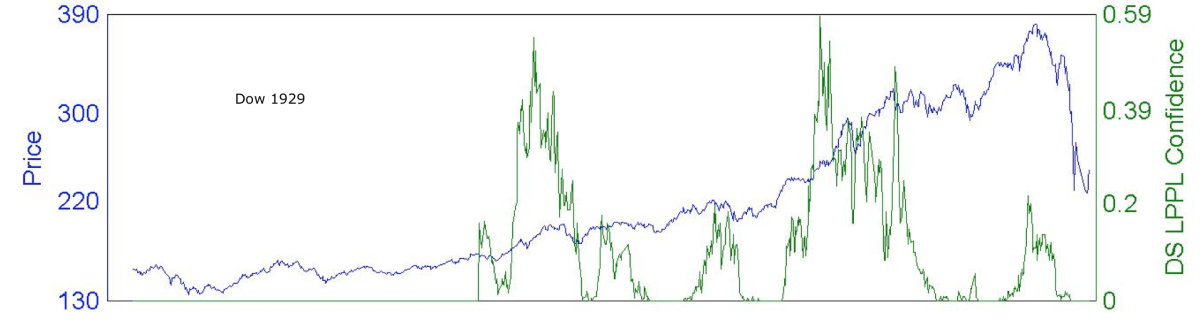
Dow 1929: 3 weeks 44% declines
Dow 1937: 8 weeks 38% declines
Dow 1968: 8 weeks 18% declines
Dow 1987: 2 weeks 34% declines
Nikkei 1989: 6 weeks 27% declines
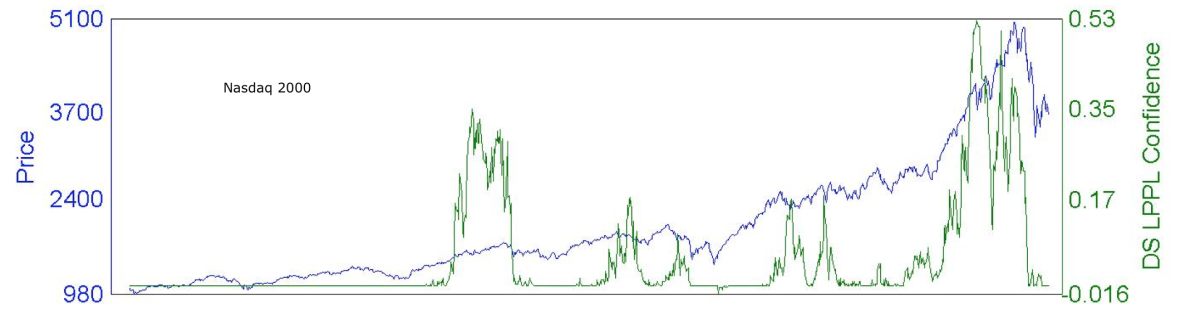
Nasdaq 2000: 3 weeks 35% declines
SP500 2011: 2 weeks 18% declines
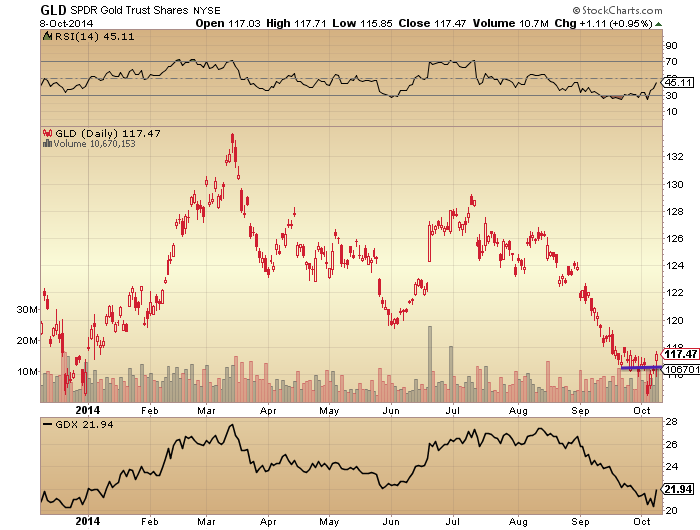
I am therefore looking for a minimum of 18% declines over a period of 2-8 weeks. I believe such waterfall selling will kick off once the technical price breaks noted above are made, and I expect precious metals at that point to accelerate in the opposite direction. However, history is not clear on which way gold mining shares should go at that point, as they may only take off after the waterfall declines, and precious metals could be held back to some degree by forced redemptions under cross-asset selling.
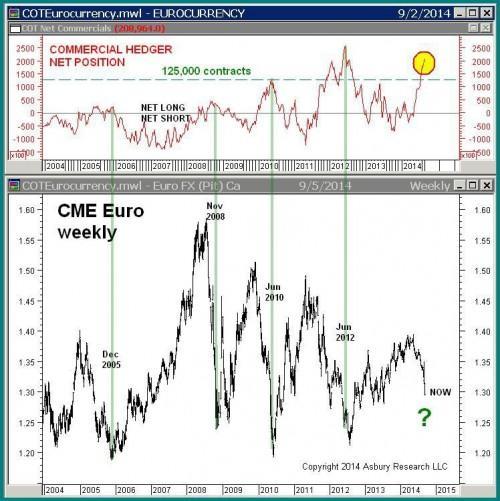
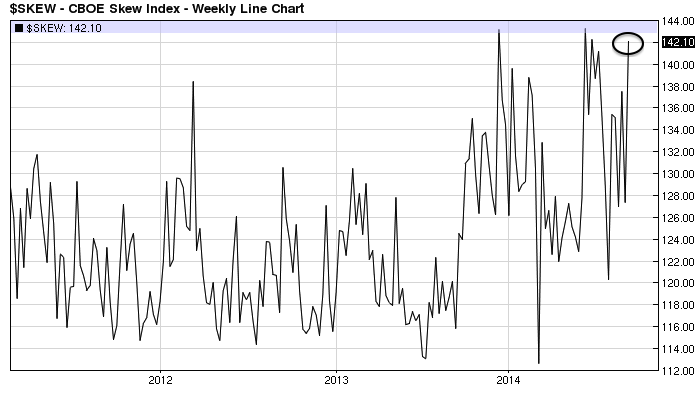
I believe Friday kicked off the downward momentum in stocks, and that what looks like a breakdown in precious metals will now become a fake-out that is reversed. The very skewed positioning in FX completes the picture for an all round reversal in assets.
Indicators put us at the end of the topping process in equities. This means no ‘second chance’ ahead. Rather, we can see the second chance peaks already on RUT, IBB, SOCL, European indices and in behind-the-scenes indicators, so I believe US large caps are displaying a false safety in their price trends and that those who think a topping process has yet to form from here will be mistaken. If I am correct in where the markets are in the timeline, then bears should remain firmly in control now. Not every day will be down, but the trend will be fairly unforgiving, with little chance for anyone to get out or in. The technical breaks should then trigger the panic selling and the devastation will be through by November. From there the market should begin a slower partial retrace of the falls into year end. This is all based on historical analogs.
My aim is to close out of shorts once the panic selling leg is through, as the partial retrace of the falls should be multi-month. So I’ll be doing my best to use indicators to try to gauge where and when the bottom is in the waterfall selling. Might selling be more measured, say like after the 2007 October peak to year end? I don’t believe so because of various factors: the solar max, leverage, sentiment, allocations, skew, levitation above 200MA / pent up correction. Rather, the set up is for particularly heavy waterfall selling, and the closest analogs listed above. They average at 30% declines over 4-5 weeks.