
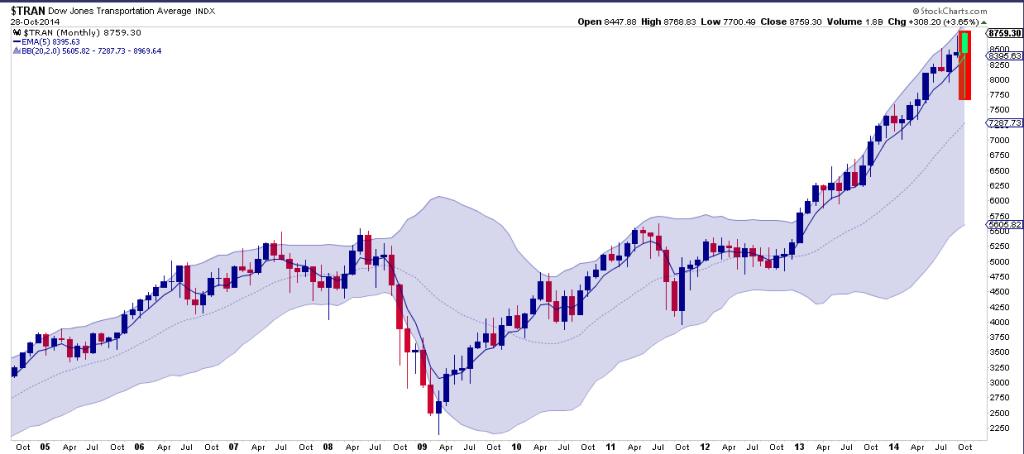
Another surprising day. Strong bullish action in US stock indices with leadership by cyclical sectors and small caps putting new highs within reach on most indices, and actually achieved by Dow Transports. The monthly candle on TRAN is something to behold, fairly unprecedented in the last 2 decades.
 Source: Northman Trader
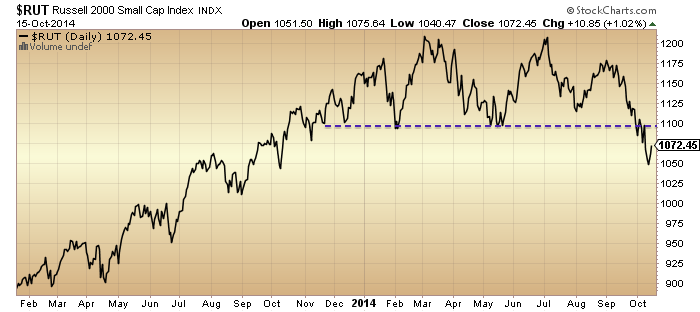
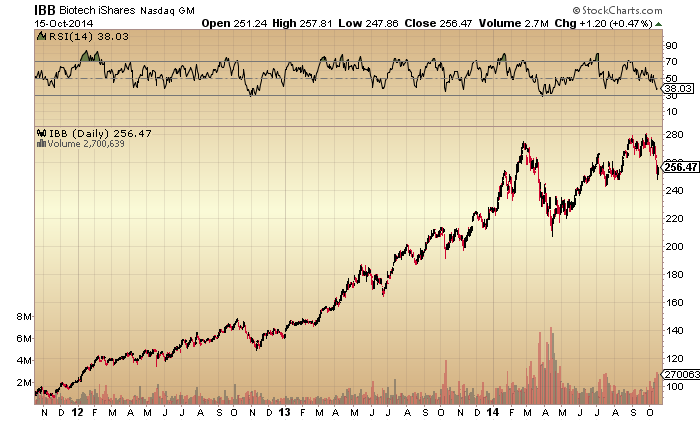
Ditto on the other US stock indices, which makes drawing on a historical analog for guidance difficult. With 3 sessions left in October, we would need to see a significant reversal to negate this current candle. Should that not occur, then I have to allow for the prospect of a continued bull market into year end, given the seasonal tailwinds, breakouts in Biotech, Apple and a decisive move back upwards in the R2K. However, I still rather see the weight of evidence as supportive of the wider markets having peaked, putting us in the early stages of a bear market.
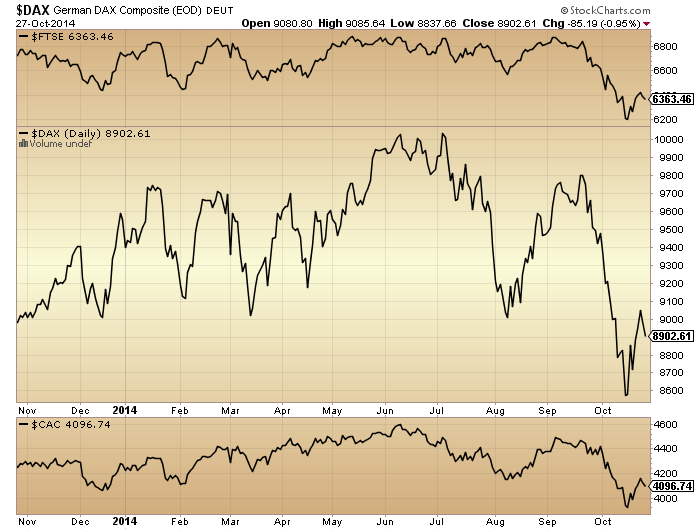
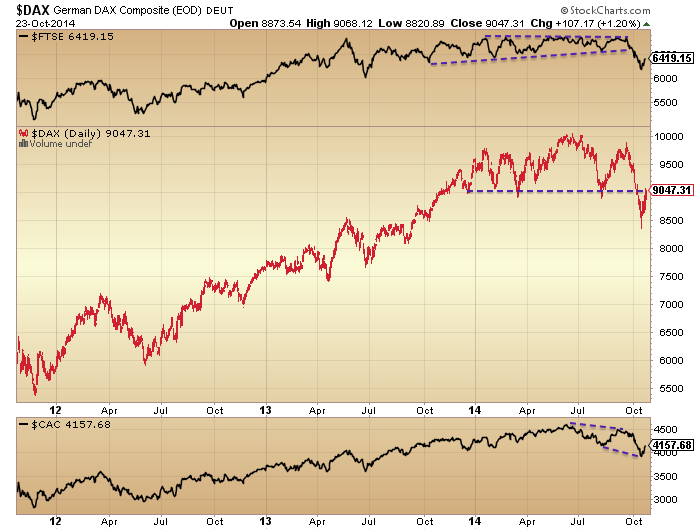
European indices show a fairly clear lower high and lower low, and the October rally looks like a relief rally and nothing more:
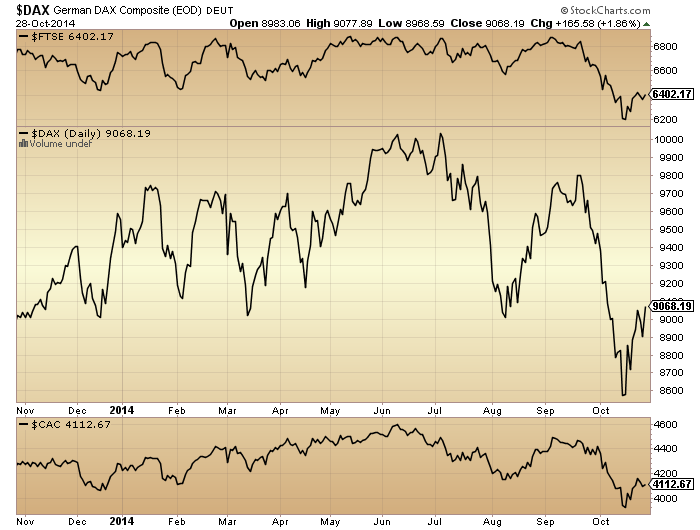
Source: Stockcharts
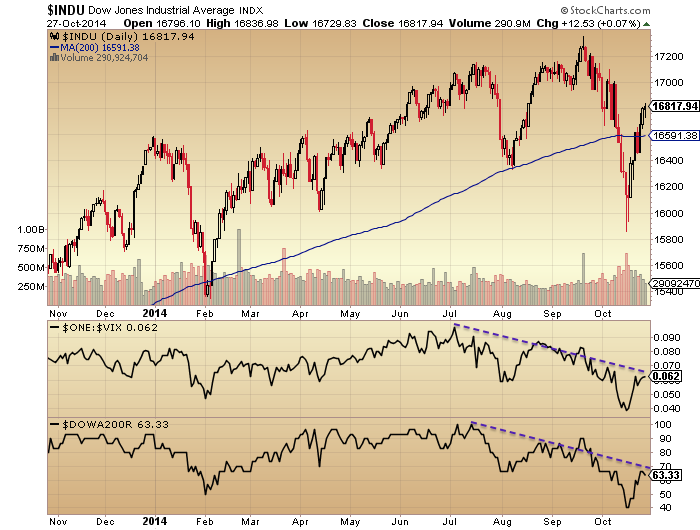
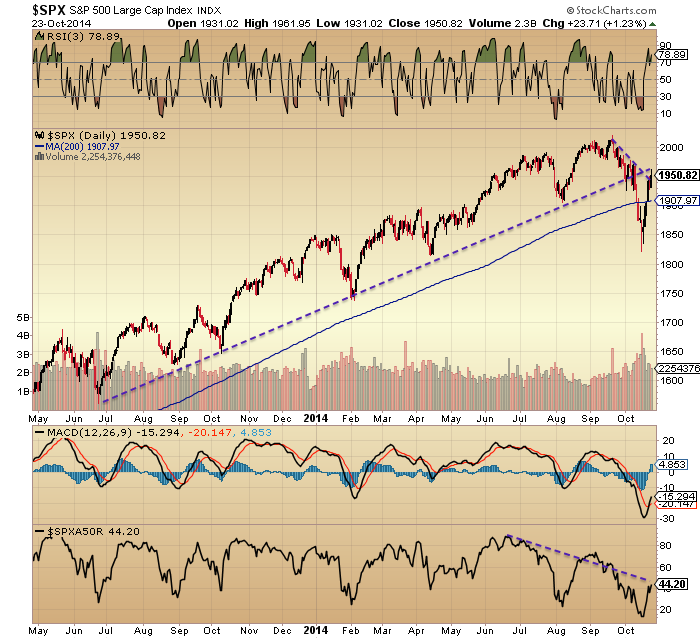
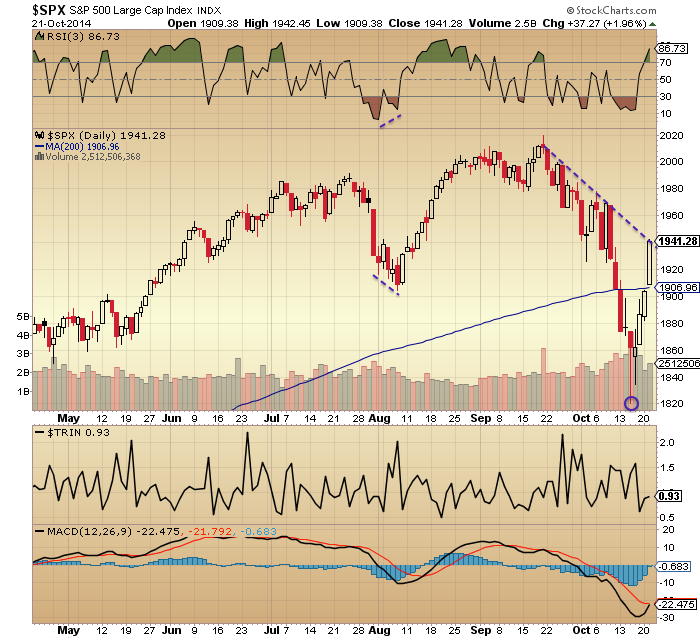
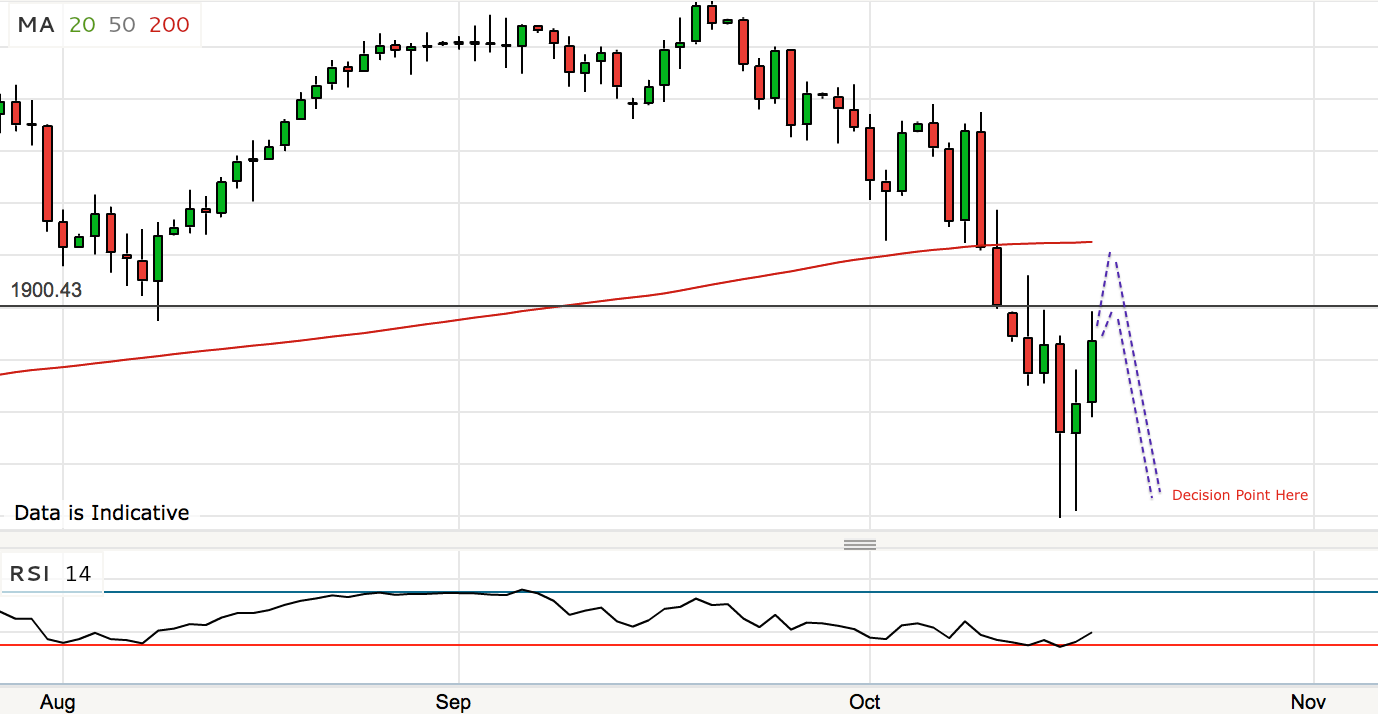
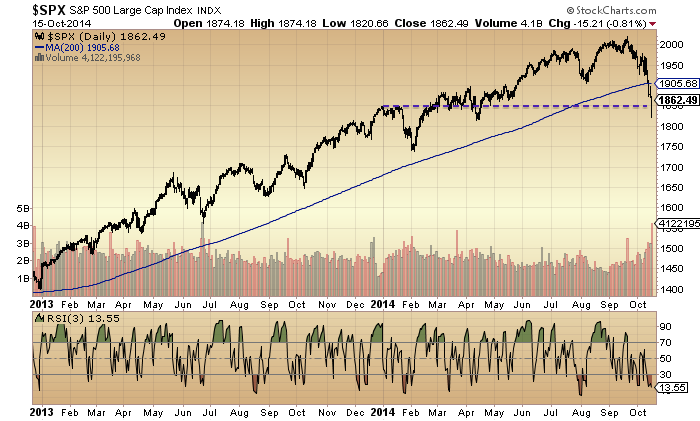
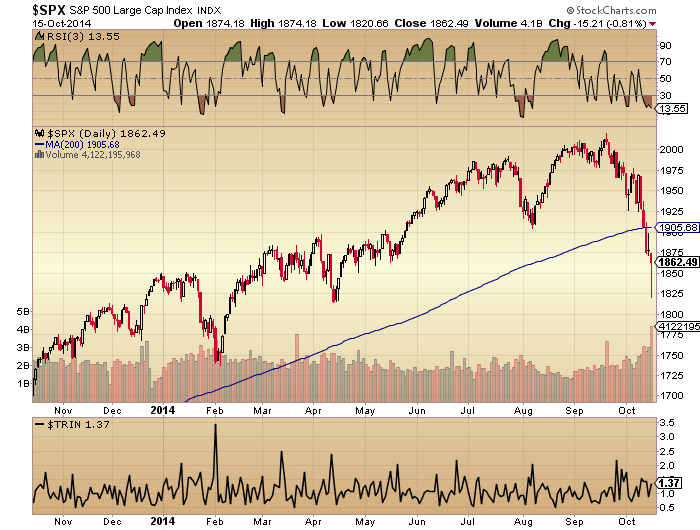
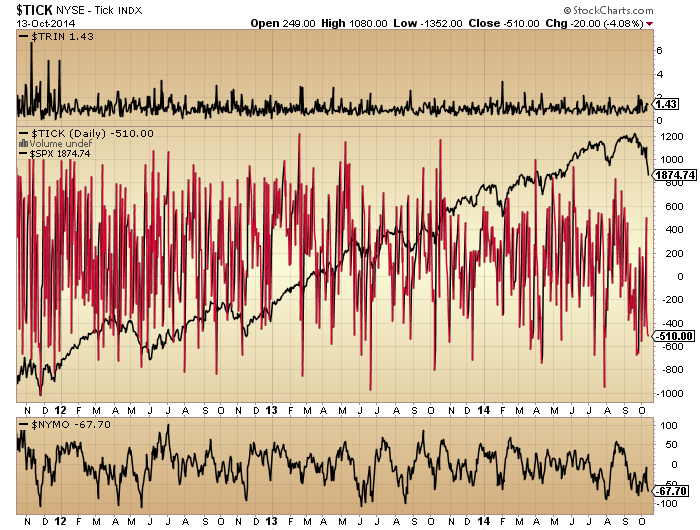
Turning to the US, here is the Dow (Industrials). We can see clear divergences in breadth and the Vix that still suggest we may have indeed made a switch from bull to bear at the start of July, but the price action is nowhere near as clear cut.
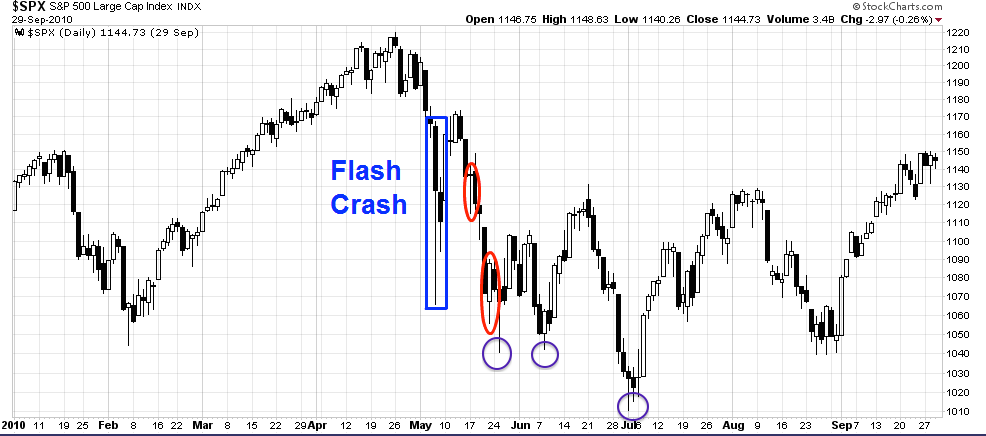
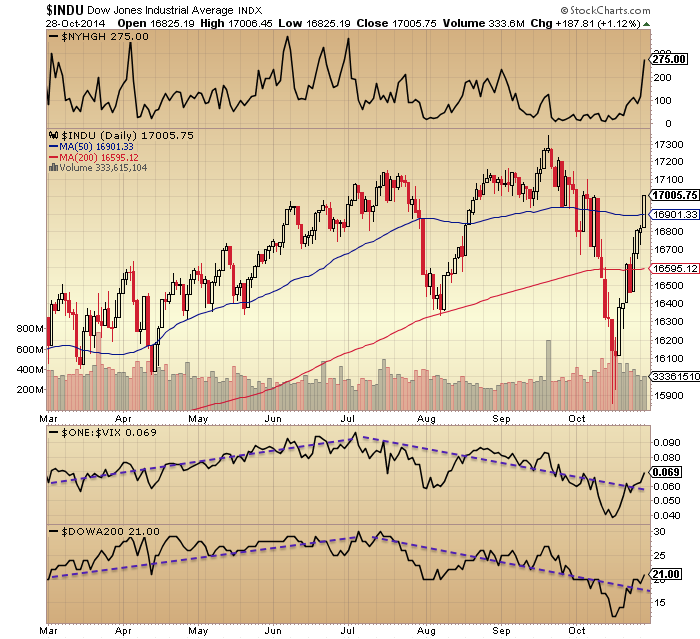 The trajectory of the October rally is powerful but unsustainable. Nymo over 80 is a measure of how overbought we have become and previous such occurrences shown below led swiftly to significant reversals 8 times out of 9:

Source: Jack Damn
Therefore, the rally ought to reverse today or tomorrow and the FOMC output may provide the trigger.
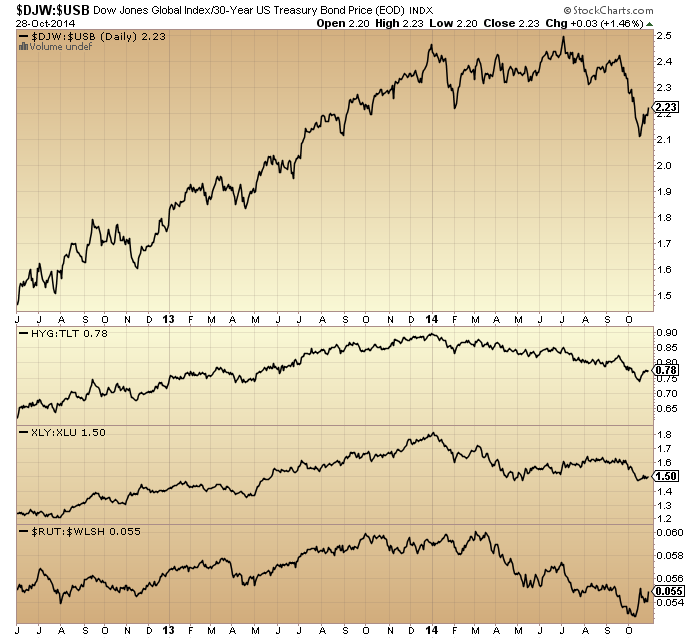
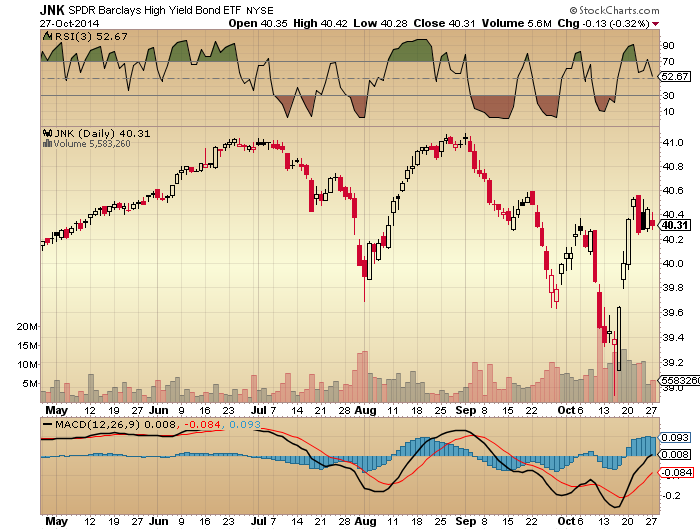
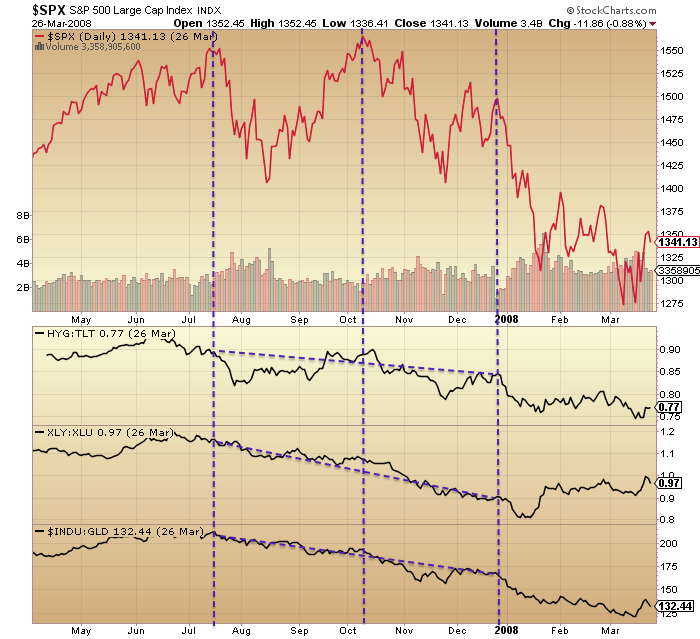
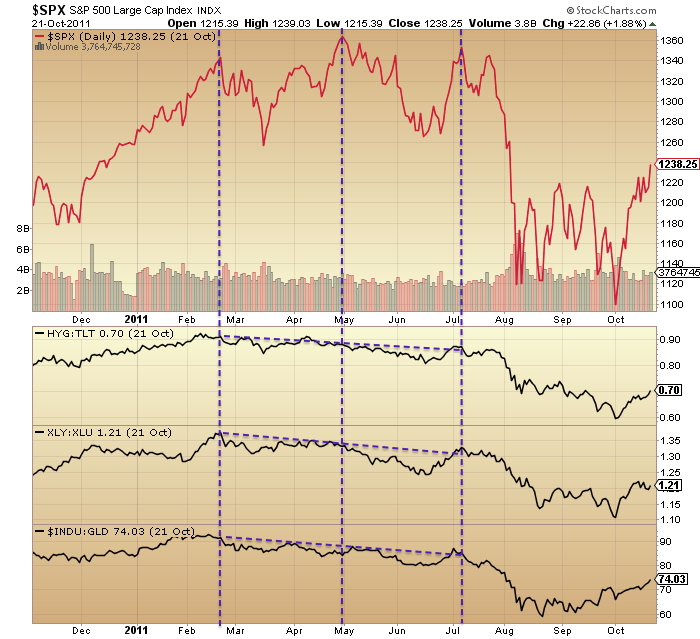
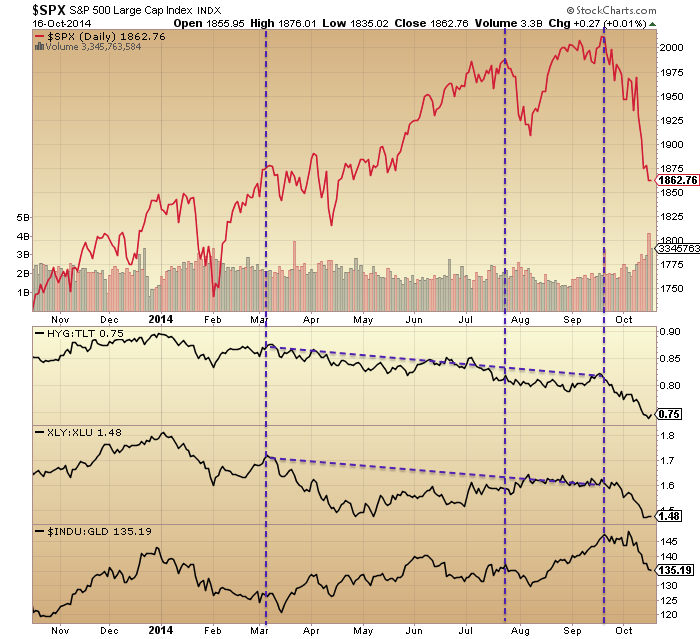
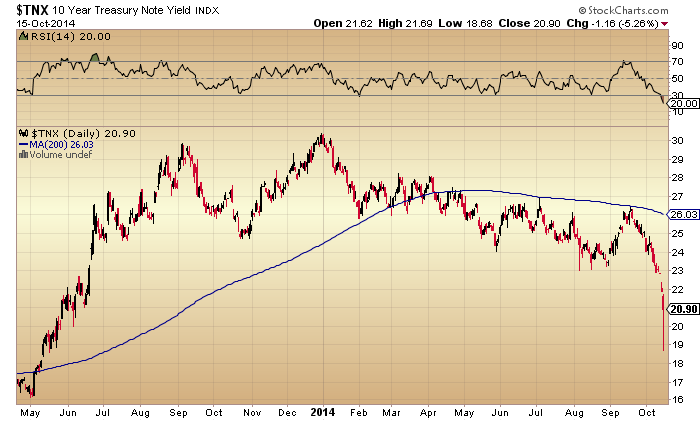
Credit spreads have not confirmed this rally and are also showing a peak at the start of July:
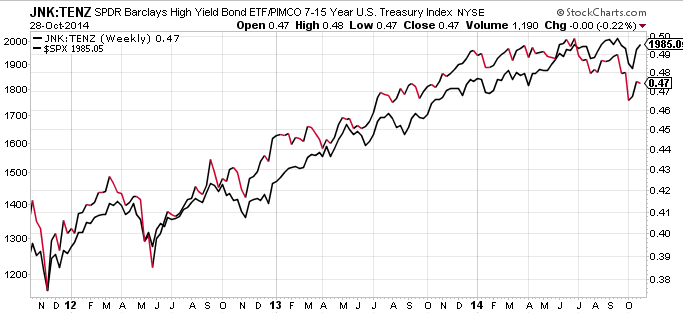 Source: Michael Gayed
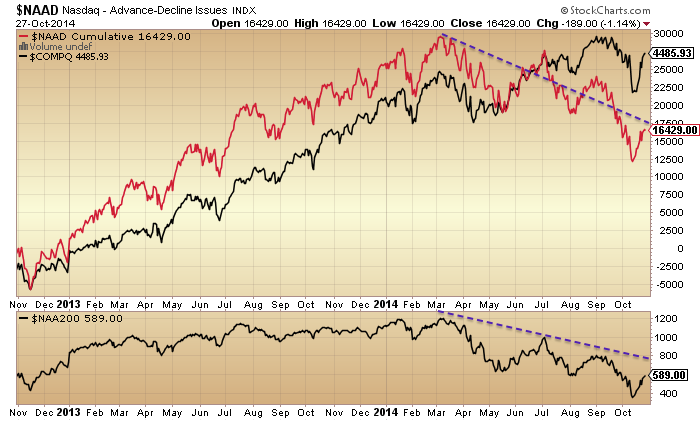
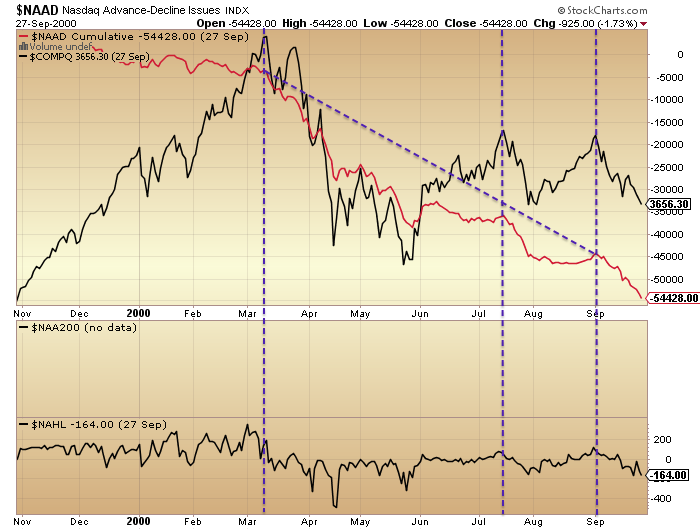
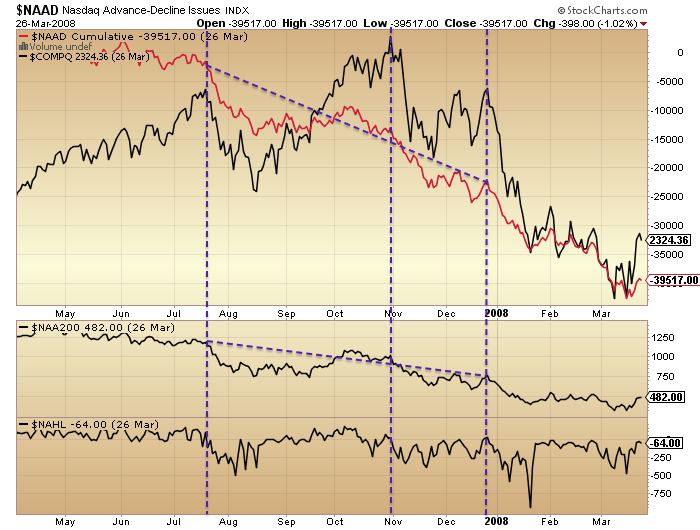
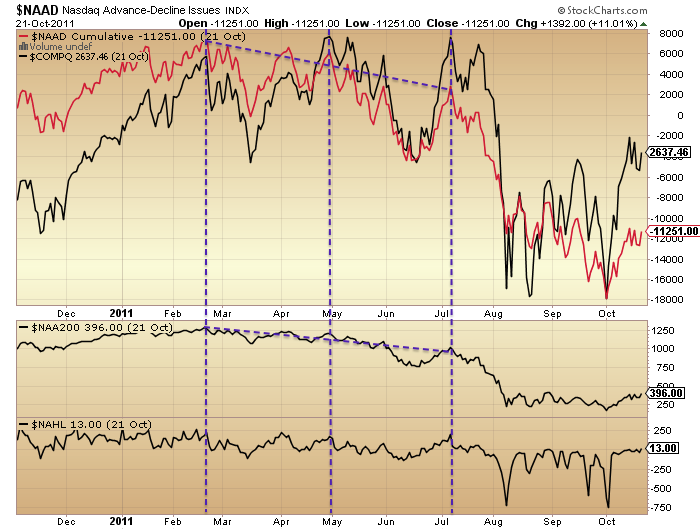
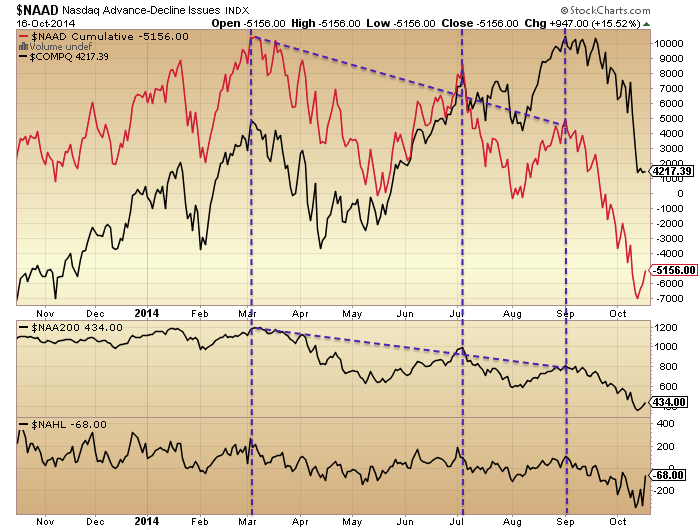
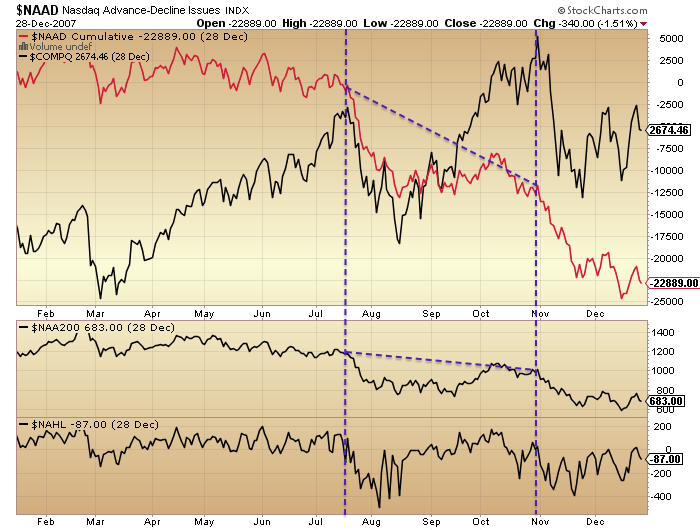
Nasdaq breadth diverged significantly at the same time and remains non-confirming of the October rally:
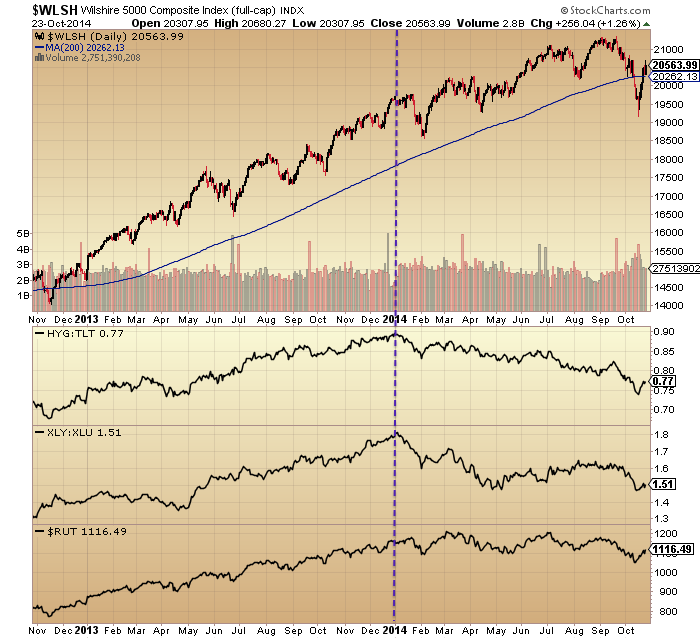
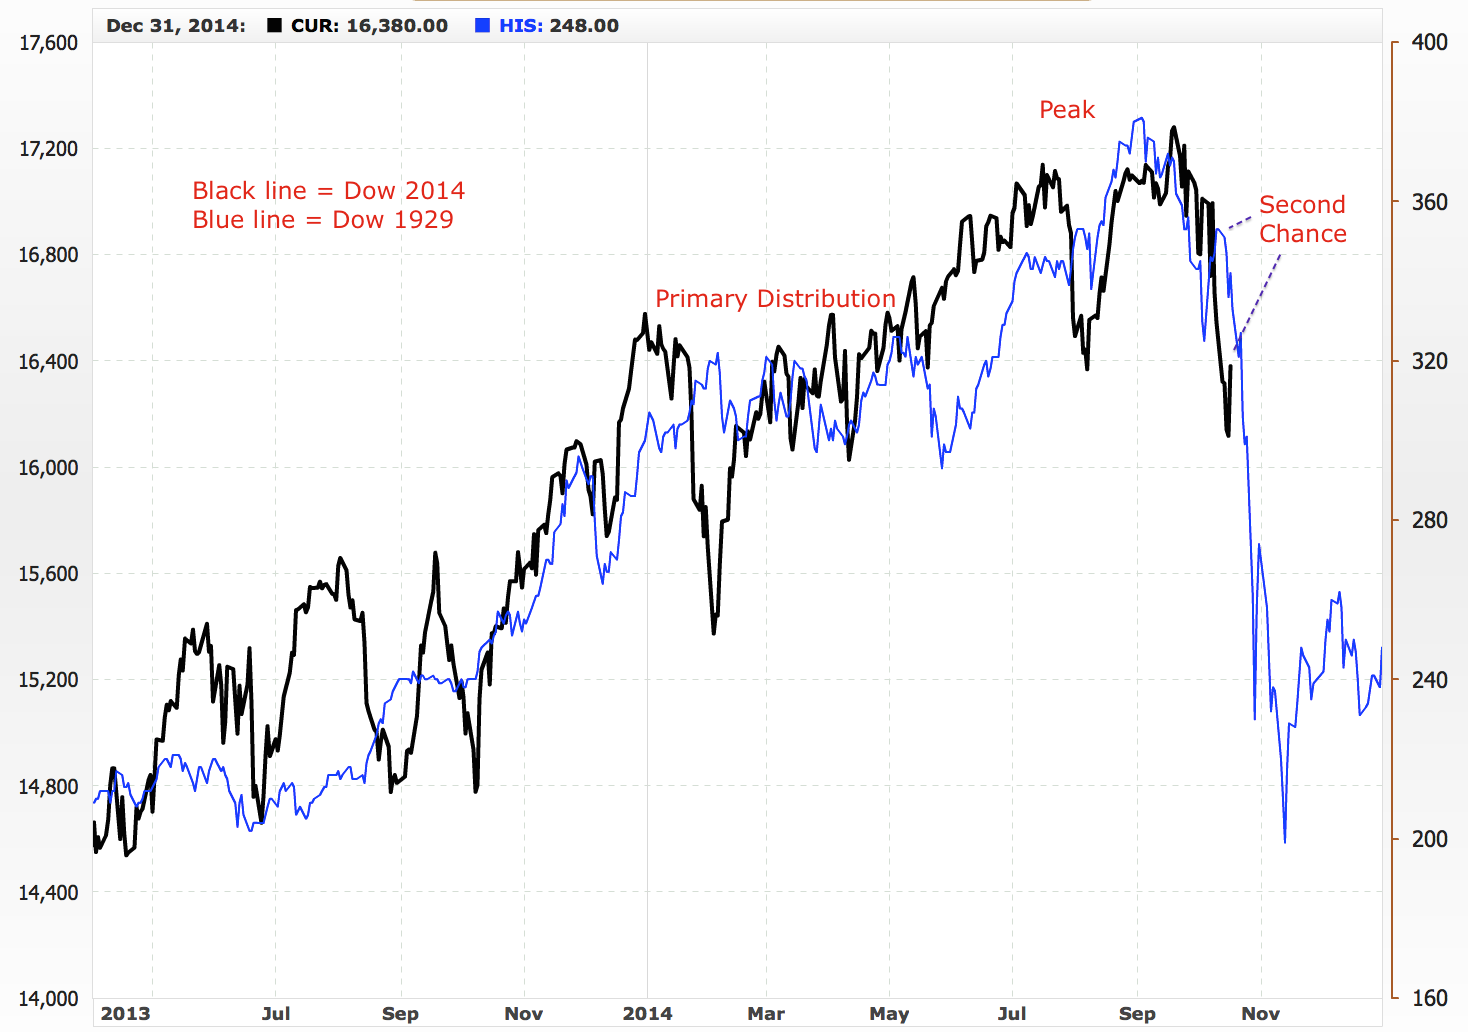
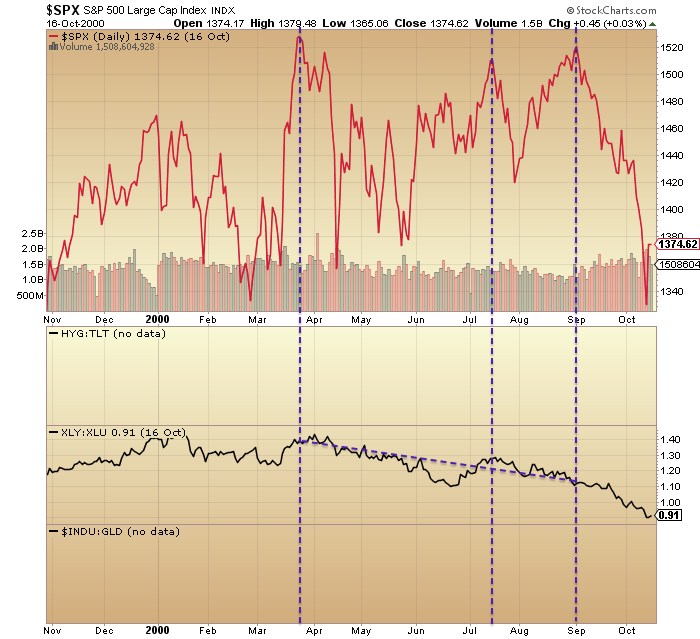
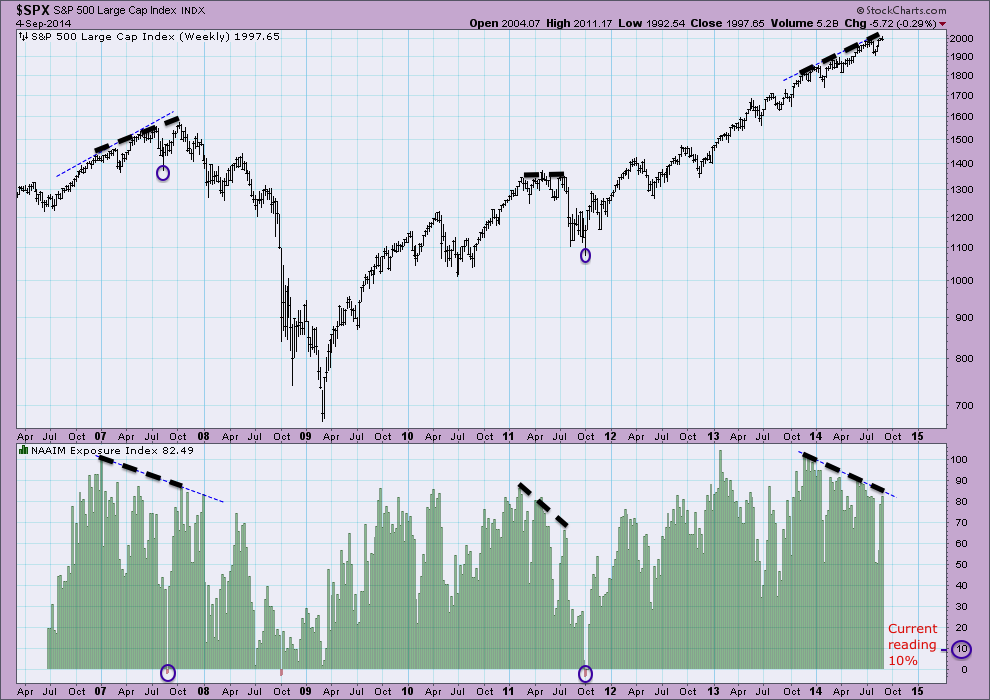
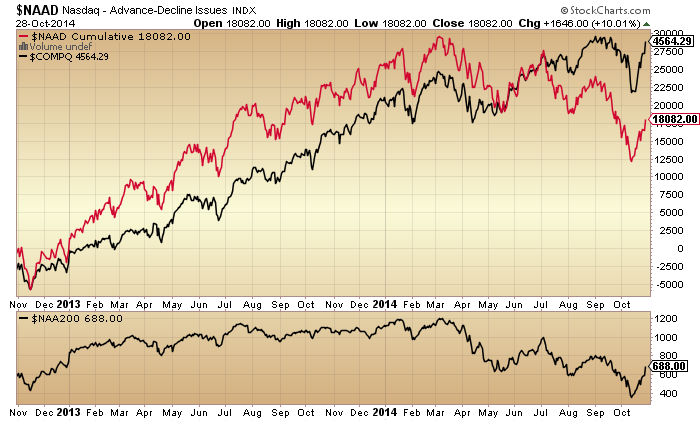 An overall topping process in equities still appears to have begun at the turn of the year, with various angles on this:
 Again, there has been little repair from this powerful October price rally.
Skew remains in an extreme high band since late 2013, warning of an outsized move in price.
 Source: Barcharts
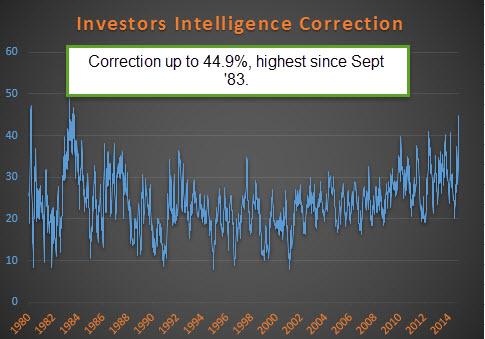
Investors Intelligence sentiment has been in a similar extreme high band over a similar period. Ditto Rydex allocations:
 These are all particularly mature flags now.
The key question is whether US stock indices can rally to new highs here and squeeze the bull market into year end. I have kept this as my worst case scenario for some time. Given the mature divergences and topping indicators that have been in place since the turn of the year, it remains questionable that they can extend that far. When we add in the additional non-confirmations that have been in place since the start of July, the probability further shrinks. However, given the breakouts in certain stocks, sectors and indices and the power of the October rally, I have to respect that it could happen.
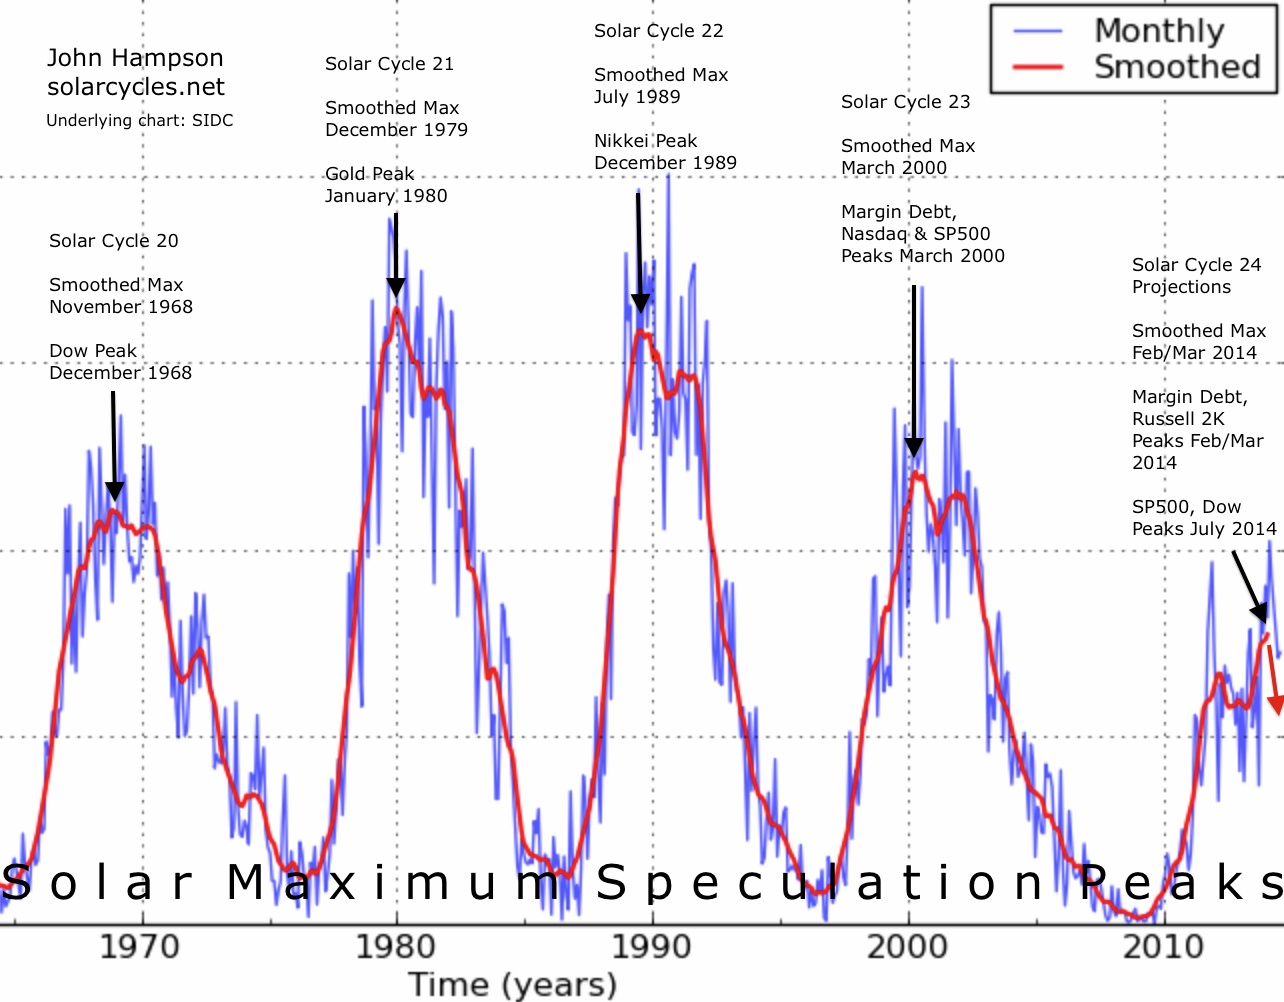
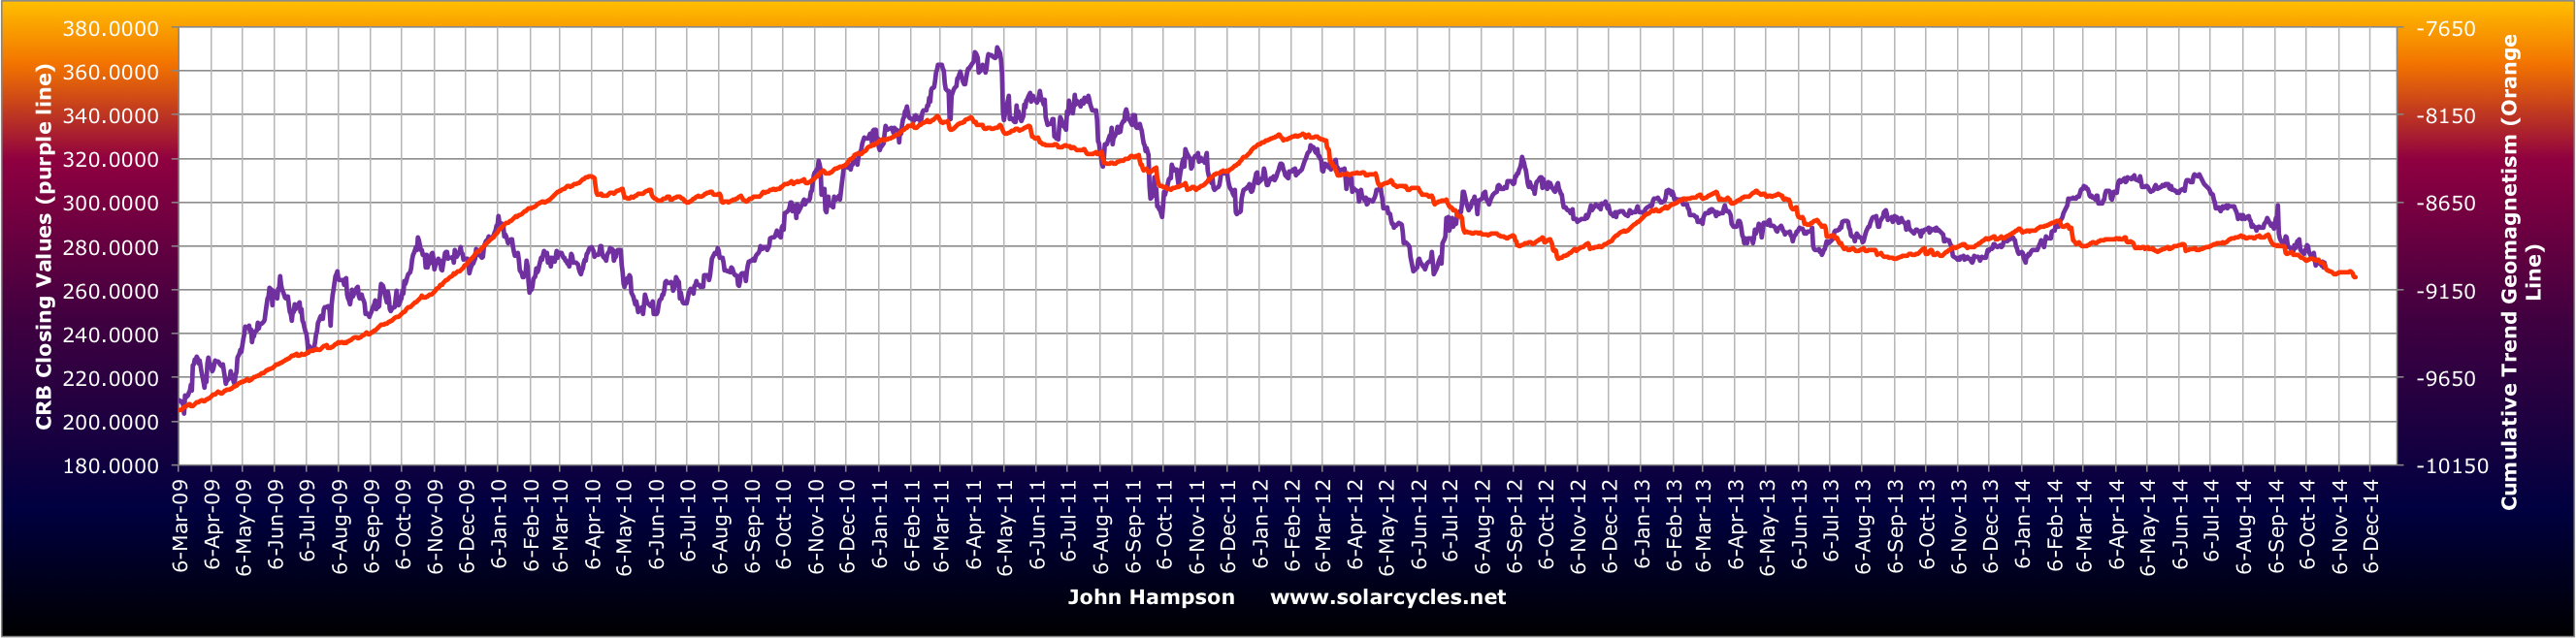
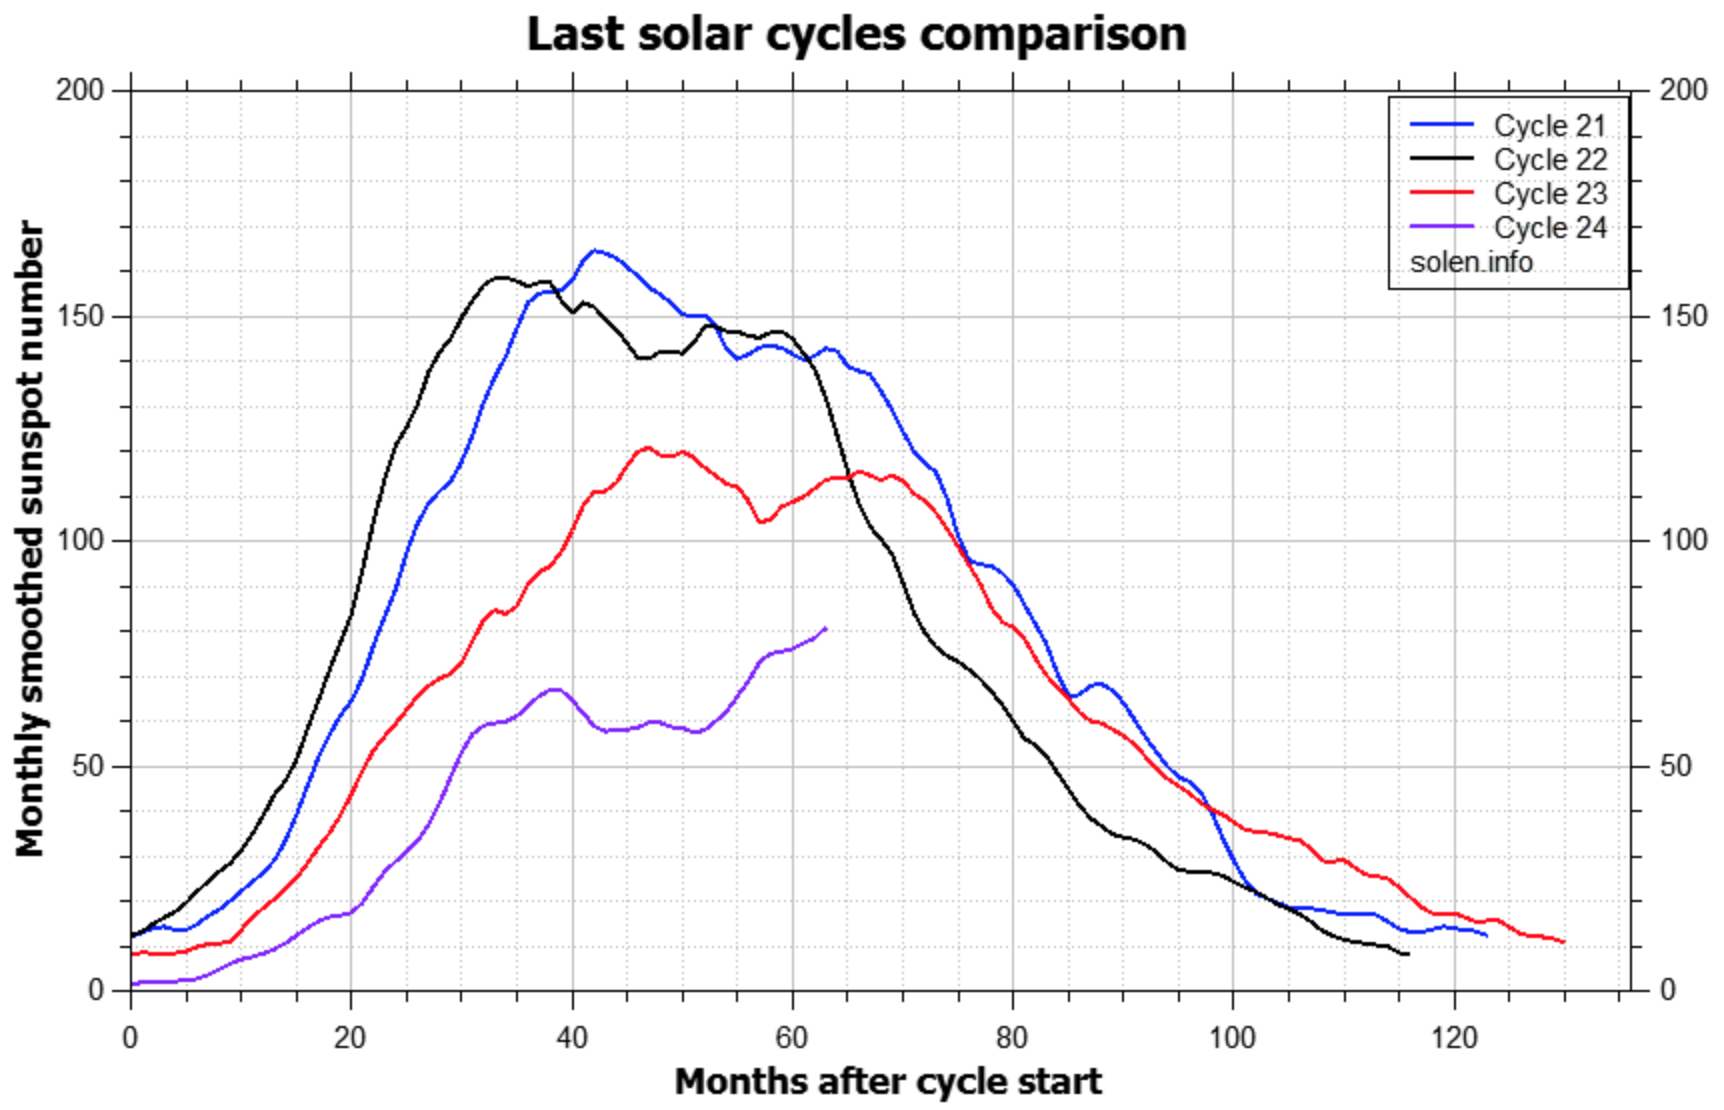
The sharp rise in the Vix into early October and the subsequent collapse is unprecedented in speed, magnitude and reversal. Like the monthly candles on the stock indices we don’t have a mirror from history to guide us. If we are set for decisive new highs in stocks then I believe it will be clear with hindsight that the solar maximum was not through yet. If so, maybe that October spike in solar flux holds some weight:

Source: Solen
For now, the weight of evidence still supports the smoothed solar max being behind us, along with the speculation peak in equities. The weight of evidence supports a topping process in stocks that began at the turn of the year and peaked in early July, and a bear market being in progress since then despite wild oscillations in price. If instead price can make new highs here (in US large cap indices), then indicators suggest that much like the September marginal highs they should be short-lived. However, given how overbought the rally has become, it appears likely that price should retreat before this week is out, which would likely create the missing lower high in US large caps. After that, we would then turn attentions to whether price can base above the October lows.
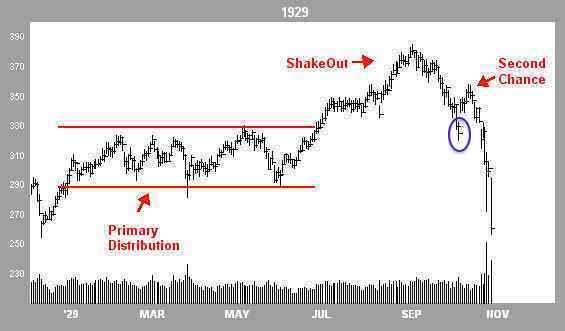
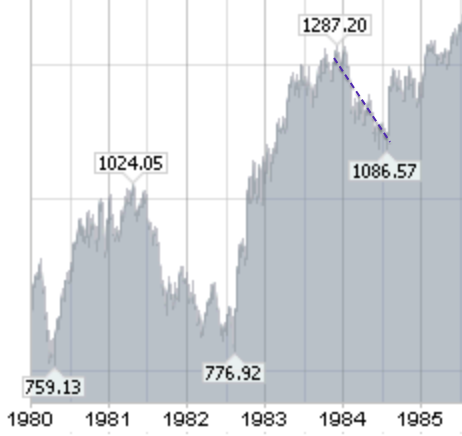
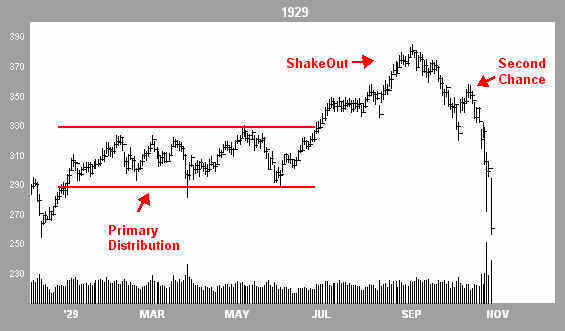
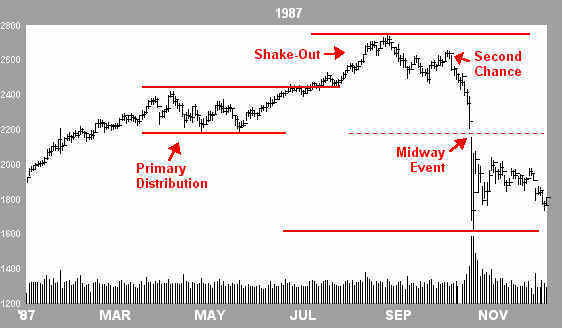
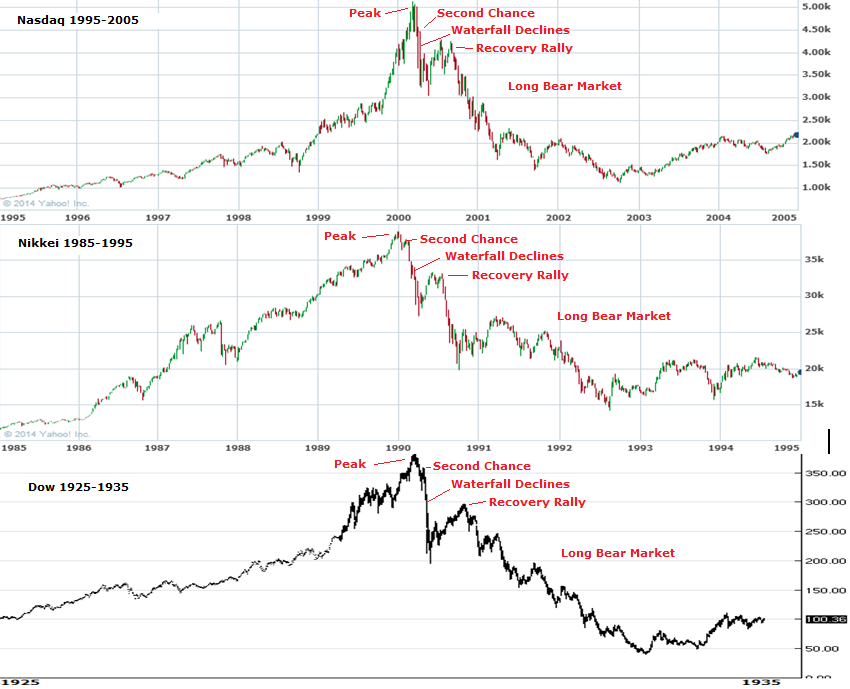
My opinion on today’s FOMC is that it will be a market mover, and that they will stick to their QE exit. It seems the likely point for the markets to reverse back down, in a sell-the-news scenario, but given the power of the October rally, we will just have to see. Either way, the power has generally been in price, not in health. I see no reason to be bullish here unless many of those indicators and divergences can be repaired. However, we are once again at a crunch point, as this is about as high as we could expect for a ‘second chance’ lower peak. We have currently retraced 83% of the October falls on the SP500, exactly like the 1937 second chance lower peak. That, plus the Nymo and FOMC provides a set-up for a reversal here. No change in my positions until we see if that materialises.


