

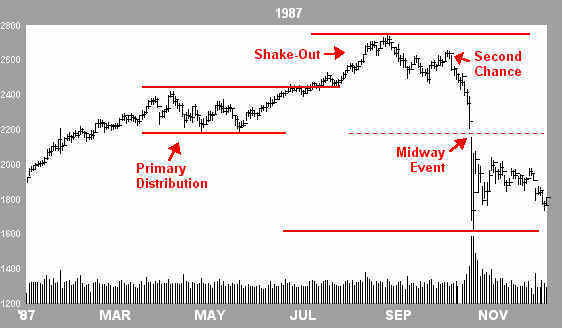
Here’s a reminder of historical analogs (manias of similar valuations, leverage, bullishness extremes, etc), and their common topping pattern:
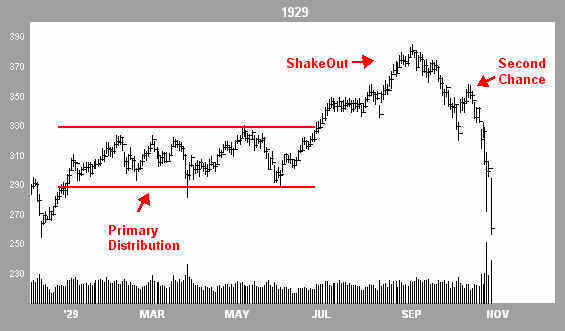
Source: Financial-Spread-Betting
Here is the Dax in 2014, with a similar topping pattern:
 Source: Stockcharts
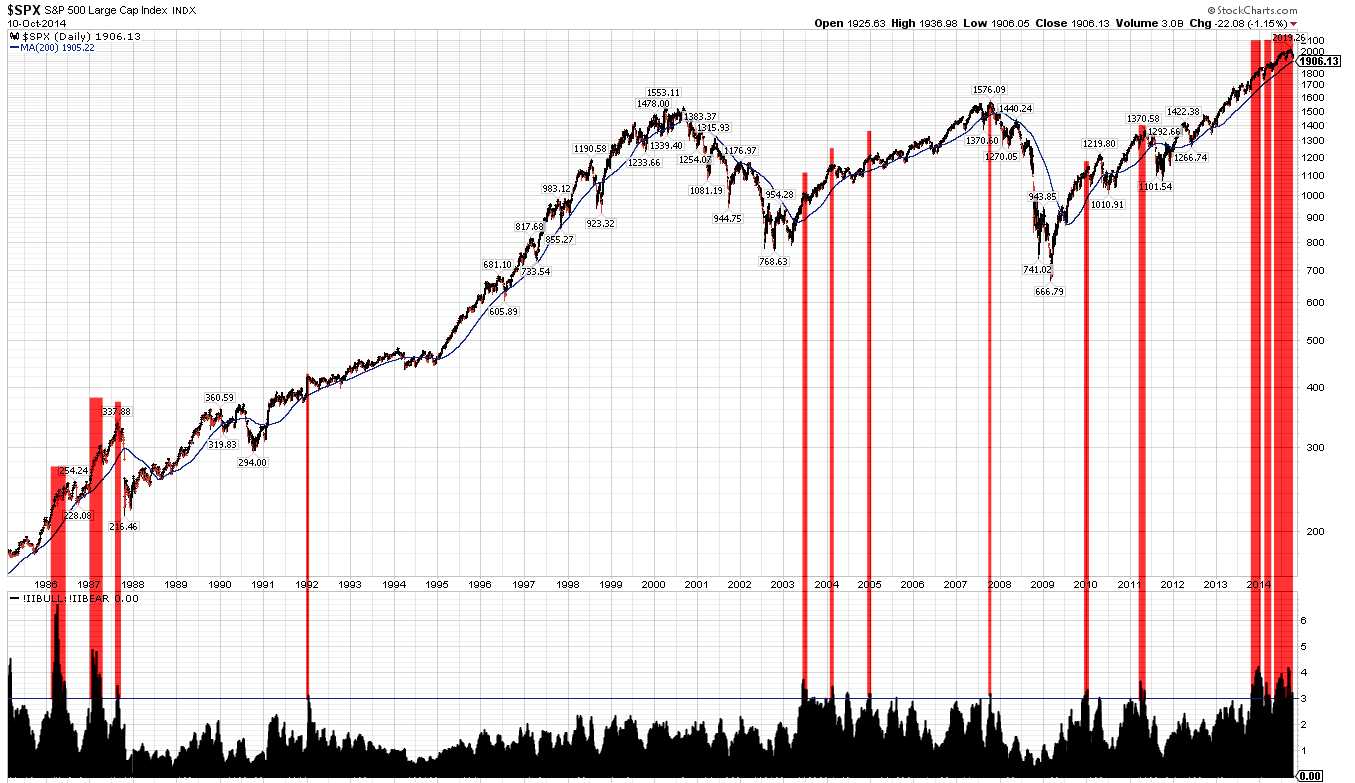
If we look at the Wilshire 5000, the broadest measure of US stocks, then these developments over the same timeline look like this:

The ‘second chance’ sticks out, being a higher high, so there’s the question mark.
That WLSH chart shows the importance of last week’s action. After 18 months of higher lows and levitation above the 200MA, we now have a lower low and a break of the moving average.
The SP500 ended Friday pretty much on the 200MA and at a double bottom with the August low, so hasn’t broken yet, but the leading action in RUT, DAX, FTSE and others, plus the selling into the close on Friday suggests the SP500 should follow suit and print the break and lower low.
Historically we have seen a phenomenon of strong selling into the close on a Friday bringing about major Monday sell-offs due to weekend stewing. The Nikkei chart above shows some examples. Meanwhile, the waterfall declines post-second-chance on the historical analogs occurred when a technical breakdown of a key level in price took place. Combined, they present the potential for this Monday, 13th Oct, to be a panic selling day, if buyers do not step in early and defend the SP500 $1900 support. So back to the question mark of whether we are post-second-chance.
I’ve shown before that various behind-the-scenes indicators suggest we are indeed post-second-chance, e.g. HYG:TLT, NAAIM, Investor Intelligence, Rydex and margin debt. So, despite US large caps having made higher nominal highs through to September, these indicators plus charts such as RUT and DAX suggest the September highs were rather a second chance peak. If so, then a quick look back up the page at the historical analogs show things rapidly fell apart after that point. Bears engulfed bulls in a steepening trend which snapped once key supports were broken and became several days of panic selling. It happened very fast. The steepening engulfing trend is what we saw in the markets last week, which adds weight to us being now on the cusp of the panic selling.
Therefore, if we are indeed post-second-chance and closed Friday under strong selling at the key twin support on the SP500 of $1900, then there really is a compelling set-up for Monday to be a major sell-off – a crash – should that support fail to hold from the outset, as weekend stewers press sell. So, all eyes on how the markets open overnight Sunday-Monday. If we do see the panic selling on Monday then the analogs suggest a rapid collapse could ensue over several days, taking us very swiftly to my targets. As a reminder I am looking for a minimum 18% off the peaks and large caps closed Friday about 6% down.
If, conversely, we are not post-second-chance on US large caps, and price needs to make a true lower nominal high, then we should instead see no panic selling and either the SP500 defended at $1900 or at a lower level, before being bid up again to perhaps make a ‘right shoulder’ beneath $2000. Whilst this may be considered the more likely option by many, I just reiterate that indicators and other indices instead position us post-second-chance, with the September higher nominal high in large caps being the ‘red-herring’.
Below is the longer term picture for the historical analogs. After the swift and devastating waterfall declines came a multi-month partial retrace of the falls, before the long bear market kicked in properly.
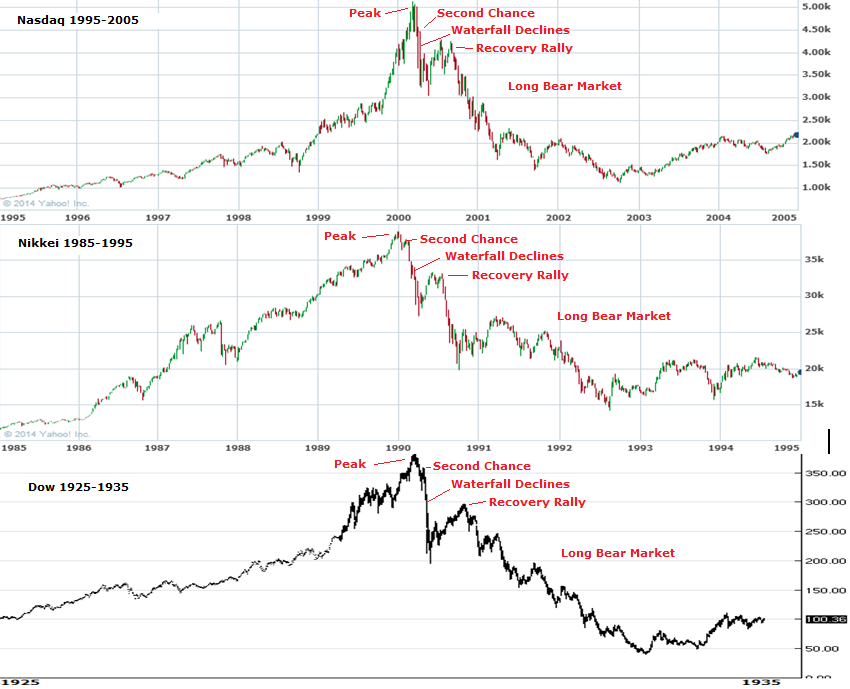
My aim is to try to exit my short trades after the waterfall declines and before that recovery rally erupts. To this end I will be looking to indicators for signs of exhaustion. At the end of Friday, capitulative breadth was still below 10 so the short term does not look washed out, whilst indicators such as stocks above 50MA show we would need to drop some way yet for a true correction:
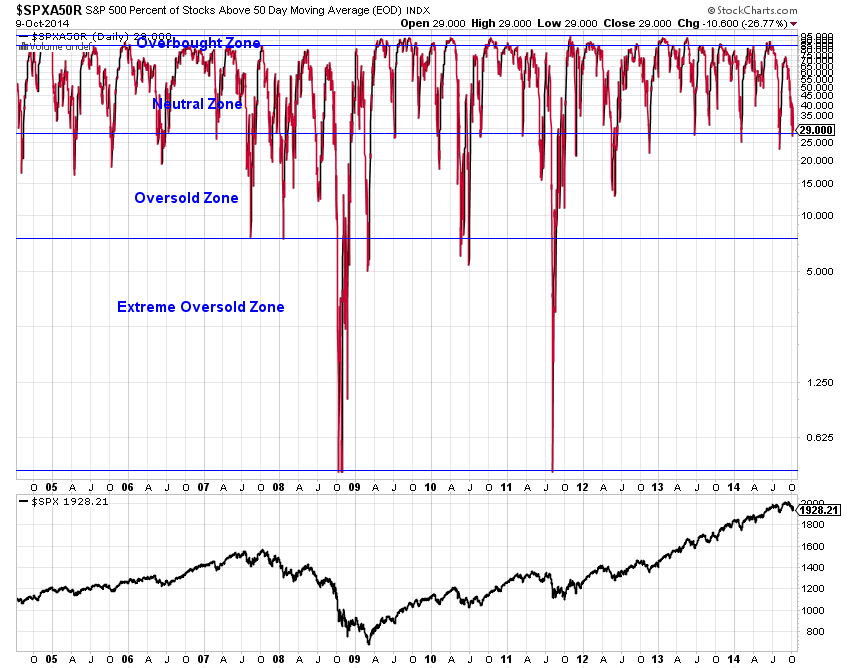
Source: Charlie Bilello
Because we have levitated in a mania for so long, postponing any meaningful correction, I believe the correction has to be nasty when it hits. For example, with this intensity and duration of investors intelligence skewing can we really avoid a repair like 1987?:
 Source: Fat-Pitch
If we draw in the 1937 analog we see a less panicky decline post-second-chance over a more measured 8 weeks:
However, I believe the odds favour a more sudden collapse like the other historical analogs, because we can see in asset allocations, leverage, sentiment, volume and complacency that a limited group of buyers are all-in and leveraged with no bears left to convert, in an extremely lop-sided positioning historically. Therefore, if selling erupts it will be like an exit through a key hole and margin calls will quickly generate further selling in a series of forced redemptions.
Nonetheless, we can draw a range from the various analogs displayed of anything up to 8 weeks for the waterfall declines to complete, whilst the average falls were 30% with a minimum 18%. With this time and price guide in mind I am then looking to cross-reference with indicators that can signal exhaustion (e.g. CBI, II, stocks above MA, positive divergences, a volume surge etc) and see if we can pick the bottom before the recovery rally emerges. Important to get these parameters in perspective in case things occur very fast this coming week. If they don’t, then maybe the bulls can come back and generate a lower high in large caps. Anything more bullish than that now looks improbable, given the breakdowns in RUT, JNK and others.
So a big week ahead. Opex is usually positive, but this week’s proper kick-off of US earnings ought to be negative. If the panic selling erupts on Monday then neither will matter.

Hi John. This is Norway and my scenario the next 6 months. A bounce into Nov ~1, sell off in November and a rally to ~Feb 2015 and sell off to summer.

Bounce next weeks may fail and we crash. But if we bounce it may be similar to June 2011 for SPX.
Lunar filter.
There are 2 ways of analyzing gravity:
a) Indirectly; by analyzing tides
b) directly; by analyzing the moon.
– The tides are final, but I’ve learned a thing or two this week:
1) There is no such thing as European tides. I use 3 different tidals stations, but it really is one system with global sampling. Combined the tides gave a high on Monday, a low on Wednesday and another low on Friday. Not bad.
2) The regular turns were out of sync this week. I saw a low on Tuesday, Wednesday and Friday. So the rule is that with significant turns the regular timing must be synchronous. As the low on Wednesday was unconfirmed, it was the low of W3. And the low on Friday was W5. Synchronicity is the magic word.
– Direct analysis of the moon should confirm the tides as there is only one moon. Looking from a gravitational point of view, I designed a new lunar filter that features 3 lunar phases : positive, negative and neutral. This reflects the 3 market modes. The negative phase started September 30th, and lasted until October 10th. So this filter said this whole week was down, which is consistent with out of sync tides. I did not ‘fit’ the filter to market timing; it was created from logical reasoning. The perfect correlation was expected, but still a surprise.
Remarkably, this filter is consistent with lunar declination timing. So this is the third confirmation as declination and apo/peri movements are really different things. The next declination extreme is Monday. So the low on Friday/Monday would have been a better forecast, with triple confirmation.
Look at the declination table I saw a 109 day cycle. And that is exactly 4 times 27,5 days; the apogee cycle. This tells me the 27,5 day cycle is way more important than the 29,5 day cycle. 2 times 27,5 = 55, an important fibo number.
Yet another thing is the rate of change of apogee and perigee. Usually, you see that the rate of change of apogee and perigee have different signs. This indicates earth is moving within the elliptical course of the moon. But here is the surprise : every 12-18 month, the rate of change has the same sign, meaning something significant is happening to the elliptical course of the moon. So this should be another lunar cycle. Is there such a thing as an apogee-perigee inversion? Every inversion is in another month, so I doubt this is solar.
So I have a lot to think about and only have to connect the dots now.
Next week I have a positive lunar phase. And the US tides give no inversions all week; this is special. The European system gives inversions until Wednesday so I expect a lot of volatility next week.
So; Monday declination inversion, tides up and lunar filter positive. The tides give a high on October 17th, the lunar filter gives October 18th. After that we get a neutral phase (is sideways-consolidating) until October 28th. Then another leg down into November 7th, confirmed by a declination inversion.
As a closing remark I saw yet another funny thing. Carolan’s spiral calendar uses the 29,5 day lunar month. Inspired by the 109 day declination cycle, I changed the spiral calendar into a 27,5 day apogee cycle. Suddenly the 29th spiral gives 54 years, which fits the 9/54 year cycle structure. The important 12th spiral gives 330, exactly 3 declination cycles.
A lot of content for one post. Criticism from people that don’t make their own forecast will be ignored. Different views are appreciated.
Have I nice Sunday.
André
Additional note
Apo-peri inversions give a 165 week cycle. This seems fairly constant in time. Only the last one was extended to support the double top the moon is making.
165/3 = 55 weeks. So now we have 55 days (2*apogee cycle), 55 week (1/3 of aop/peri inversion cycle) and 55 year cycle (Kondratieff\K-wave).
The stretched AP-inversion cycle combined with the double top in the 4-something year quasi cycle and the oct/nov synchronicity all signify a major turn is coming. But I wouldn’t be surprised if the current low is the setup for one last exhaustion leg up.
Andre, thanks for your posts!
You mentioned roc extreme. What is that? What do the letters “roc” stand for?
PrimaCanyon,
ROC stands for rate of change.
Cheers,
André
thanks. Have a great week!
Andre’,
Lots of good direction in your post. Could you clarify a couple of points for me? What do you mean by “rate of change of apogee and perigee”, is that the distance moved per day between apogee and perigee? What do you mean by “usually…the rate of change of apogee and perigee have different signs.”, is that astrological sign, is it the moon is in a different astro sign so that the next apogee or perigee occurs the moon has moved 30 deg to a different sign?
On another point, I would agree with your view that “Criticism will be ignored”. People are either interested in your approach/research and get it, or not. To the extent they are dismissive, for you to respond requires relating to their non-constructive negativity, which is not good for you. Your getting good results, and it is satisfying to you, so you don’t need more than that.
SC
Steve,
With rate of change I simply mean the difference with the prior value. This can be positive and negative; that’s the sign. When the perigee distance goes up and the apogee distance goes down, it means the earth is moving within the course of the moon. This is a natural thing. The key point is that only once in so many months both distances can decrease in the same apogee cycle. So now the ellipse is contracting from both sides in the same apogee cycle. I don’t know what causes that, but I see it as an inversion. And it seems stable around 16 months/70 weeks.
That’s it occurs harmonically and seldom tells me there is something to it. Haven’t seen anyone doing this analysis but I think it is significant. There is so much you can read from the moon!
The 165 week I mentioned above was a calculation error, so forget that. But the 70 week cycle will be the basis for a new cycle structure, as is the 109 day cycle.
Cheers,
André
Thanks. Agreed, I have never seen that approach. I believe I understand. The approach is to compare apogee to next apogee (it expands +, or contracts -), and similar for perigee. Sometime they both are + or -, or opposite signs. Hope I have that correct. Interesting analysis, and I know the declination relationship is key. Thanks
SC
Steve,
Just discovered this technique, but it is significant. Also : look at the roc extremes. They cycle with a 3 to 4 month period. The negative roc extreme in Apogee gave the February low. The 2009 low was also a negative roc extreme. So this is a second type of inversion. October also gives a neg roc extreme in apogee, supporting the analysis I gave above. Keep this analysis to yourself; it’s very powerful 😉
Ha,ha, I won’t tell a soul!
I mean it!
Now I understand; negative roc extremes in Perigee give highs and negative roc extremes in apogee gives lows. Never seen something like this before. Try it!
The 2007 high was a roc extreme in perigee; the feb 2009 low was a roc extreme in apogee. It works!
Thank God most people don’t take my posts seriously!
You are right, a lot of content. A bit over my head. But that aside, What you are saying is a choppy rise to Oct. 17th or 18th. Then a sideways move till around 28th Then a down to Nov. 7th low. Then a rise to the Major turn. Andre, please correct this , if i am wrong or clarify this , please Thanks…n
Nicola2910
You are correct but read the other analysis above. I now understand October will give a significant low (this weekend) and then a next high around the end of January 2015. In this period there will be several local high and lows.
Don’t worry about understanding everything in one go. I will come back to these issues in the future.
Andre,
You say that this weekend in October will be a significant low and then new all time highs in January – so, we will not make a lower low on November 6 ?
Also, you mention 2007 and 2009 for the roc extremes – have you tested the roc extreme theory for other highs and lows – eg. 2000 or 1987 or 1929 ??
Finally, how confident are you that we did not make an all time high on Sept. 19 and it is all down from here as John says ?
Would appreciate your response.
BR,
I found this analysis recently in my continuous review and adjust strategy. So I am merely scratching the surface. But what I have seen is mind boggling.
I am very confident this is not the turn yet, for the simple reason that it has now been proven – at least to me – beyond any reasonable doubt that gravity is the mayor force that drives the market.
In general : on this site I share what I find in my little project to find a lunar forecasting tool to complement John’s solar analysis, and I don’t give investment advice.
My forecast for next week goes boldly against the general sentiment. Let’s see how this week plays out.
thanks Andre. Could you please give one example? I’ve calculated perigee ROCs for 2014 in both km and longitude and get extreme negative ROC in the interval between Oct 6 and Nov 3 (-5390 km and -36*27. must be misunderstanding? tia
Nicola2910
I am pretty sure the top in January 2015 is the major turn we are waiting for. So this October low is significant and we will see new ATH’s.
The details of this last wave up will come in my next Sunday post.
And for your eyes only : early March 2018 will be the next major low.
I promise , I will keep it to my self ……n
Andre’, is there a website or way to calculate ROC. By the
way:
http://www.astrologyforganntraders.com.au/main.html
is a really cool website with a theory that as the moon moves thru the
12 signs of the zodiac it effects market either + or – each month. The take
away is that if you sell each month when moon enters leo and buy back
when moon exits sag, you will avoid the weak price zone of each month.
This really works with almost a two fold annual return( some years less, some more) by being out of the market for these 96 days per year. For me, this
is going to be the bedrock of my trading strategy. You can prove this yourself by looking up the moon ephemeris for any year and circling these 8 days. You may be amazed by the results!
Andre’, just read an article on this subject. Maori NZ fisherman would not fish on perigee because the water was too energetic and the fish went into deeper water, and the farmers would only sow seed plants on apogee because the soil was more harmonious to the germinating seeds. In honor of your discovery I would like to coin a new word: apogetic (to replace apathetic) same definition just applies to people (or markets) during lunar apogee.
Steve S.
I didn’t research this, but I doubt you will find these calculations anywhere else.
The moon travelling through the zodiac is basically an apogee cycle. So I prefer to call it what it is : distance.
Cheers,
André
thank you Andre. not sure I’m calculating ROC correctly – do you take perigee km distance and subtract next perigee km distance? (also for apogee) If so, max negative ROC in perigee for 2014 is between the perigees of Oct. 6 and Nov 3. thanks in advance,
Peggy
Peggy,
Roc is just apogee now minus apogee T-1. Same for perigee.
Cheers,
André
ahhh ok I got it. thanks! ex: current perigee distance km minus previous perigee distance km. The extreme negative ROC for 2014 was 6/15 – 5/18 = high (came near next perigee 7/13. looking ahead, the extreme negative ROC for 2015 is 1/21/15 – 12/24/14 – with a high possible at next perigee 2/19/15. now, on to apogee ROC! thanks
Extreme negative ROC for apogees 2014:
3/11 – low came in on prior apogee 2/12
10/18 – high came in on prior apogee 9/20 – low 10/18 or next apogee 11/15?
As Andres has mentioned – he expects a high in January (extreme negative ROC perigee) – which could be as late as 2/19 (next perigee). And then headed down to extreme negative ROC apogee 4/29/15 (4/1 is prior apogee and 5/26 is later apogee).
Andre and Peggy,
Regarding Peggy’s last post on this thread about the ‘extreme negative ROC apogee 4/29/15’. Does that fit your calculations as well Andre?
For what its worth I have a major date from fibo and geometric time analysis on 4/27/15. I had been thinking about it as the final high for the 2009 rally, but maybe based on your work it is the initial W1 swing low for the decline into 2018.
Your work is very impressive and thanks for sharing with us.
Great work John. Im heavy short at SPX1901 as of Friday just before the futures close.
The contrarian trade here is short imo. People are coming around to the idea that a correction is in the works. The market always inflicts the most amount of pain. So chances of a lower high so that every man and his dog can short the market is a low probability event. That coupled with October volatilty means we move signifcantly lower from here.
Im expecting sunday night futures to open lower than where they closed friday. Then markets to move lower still when Europe come online. The the bear party to really get going when the US come online.
In case im wrong, elvis please have my pills at the ready 😉
Dubai stock index down 7% today currently, may be a clue for Monday
Thanks John. As you know im no permabull nor permabear having played the long side last in august / september. All my analysis is pointing to lower next week. Id be supprised to see the market give longs an oppotunity to get out and shorters an oppotunity to get in.
Yep, many thanks, John. Also reloaded Friday afternoon, based on the failure of the nascent up-fork on RUT 2 hour. Seemingly vindicated by the selling into the close.
FTSE monthly breaking down out of a very long-term classical bearish wedge, the target for which as I am sure you are all aware is the origin of the pattern: http://screencast.com/t/iDR3stNs
Thanks John again. I am inclined to think we are not yet post second chance. There is still too many BTD’ers. I think we make a lower low Monday then a short term bounce and lower highs and then the gates of hell open as the realisation that no new all time highs are coming.
I’ll be taking profits VIX longs on this dip expecting a VIX pop to perhaps mid 20’s but won’t be going long market or short VIX under any circumstances.
Cheers
fantastic post john, thanks. have you not considered learning EWT and then including that in your analysis, its the best trading tool that I have found on any time frame.
I didn’t get on with EWT so far, but never say never.
For me, EWT is like economics. Great in retrospect. While it still informs my broad expectations for wave structure and so on, I find (at least my practice of) it far too subjective to be useful as a primary decision tool.
EWT has had this market nailed like no other TA, and during absent fundamentals. It also predicted this correction as Primary IV. Its OK to poopoo it. Your money is much appreciated. The bear does not start until EWT is satisfied, this being even beyond the Feds influence.
I noticed DFM earlier, yes down 7% this morning. I often watch it as an indication of what might happen next week.
I have seen it 4% down in the past only to see the wider markets rally the following day, so not sure how much impact this has.
But it’s the volume, I noticed it’s way larger than normal.
http://www.dfm.ae/Default.aspx
Thanks for the link. So 7% down today, oh Lordy!
John
Just to say a huge thanks for sharing your research & thoughts. I find your logic incredibly compelling & persuasive.
Also a thanks to all posters of all views. Good to get a view of all angles to weigh up the evidence.
You mentioned Dubai down 7%, is that YTD or today?
Thanks all
Down 6.5% today, up 40% YTD
http://www.bloomberg.com/quote/DFMGI:IND
bond market closed on Monday, so liquidity is limited.
also, VIX futures term structure is inverted, usually it means trouble for weeks ahead.
and finally, just read an interesting piece by a Mideastern expert who claims that the reason Saudis suddenly cut prices for Asia delivery is to put pressure on Putin for his support of Assad (not Ukraine war, which is a big deal IMO). this mean we will probably see much lower oil prices going forward (for awhile), which will put pressure on energy companies that contribute a great deal to the indices.. But overall, totally agree with John on one thing particularly- the excesses been tremendous, it is about time we swing in opposite direction. thank you, John!
Dubia 7% down today on close that’s 25% drop against years gains approx. But it is a small exchange 35 companies I think.
Not a major indicator.
Oex-call-put-ratio of 3.8 to 6.9 on Friday after 3.0 to 4.7 on Thursday –
http://www.cboe.com/data/mktstat3.aspx?Dy=13&Mo=1&Yr=2014&selid=OEX –
clearly supports a decline on Monday. As there is a huge amount of put-open-interest at the spx 1900 level expiring next Friday, put-sellers are expected to hedge by selling spx-futures the more 1900 are undermined – see
http://www.schaeffersresearch.com/commentary/content/ezines/as+support+bends+bulls+should+exercise+caution/mondaymorningoutlook.aspx?id=122973.
Therefore I have difficulties to believe in a bounce next week. Nevertheless the analogies to the topping levels of the Dow 1946 – http://www.mrci.com/special/ddji46.php – and the technical support of the Dow at the 19400 region make me cautious as to a possible snap back rally from this level to around 16800-16900. Maybe a bounce is necessary to destroy the too rapidly growing bearish confidence. Further I don’t know whether it is a realistic option for put-sellers to defend the 1900-level until Friday instead of hedging by selling spx-futures.
Interesting, Theo. Thanks —
Saudi Arabi crashing as well. Panic monday is starting, imo. My charts are saying 30% down, 1400 level before the retrace begins and before I remove my shorts. that can change, but that’s what i see right now.
Great post, John.
Cheers
Allan, on ebola, do not underestimate this.
Look at the news this morning from Texas,
how are these infections happening if the virus
is so difficult to transmit?.
What a fascinating week in prospect for markets.
I was ready to throw in the towel on Thursday and
move back in to stocks following Wednesday’s US
close, the initial morning mark ups prevented this
and we know what happened next.
Luck, not judgement on my part.
Hey Phil, look at Nigeria. They controlled their outbreak with just basic practices like advising those that couldn’t afford soap to wash their hands to use ashes instead. If Nigeria can control it I am certain the US and other developed nations can.
Cheers
http://www.businessinsider.com/how-one-country-stopped-ebola-2014-10?utm_content=buffer55bf6&utm_medium=social&utm_source=twitter.com&utm_campaign=buffer
John,
I wonder if you would share your thoughts on the following:
– what type of investments are safe to buy as bear positions?
– what type of investments will be safe to buy as bull positions at the bottom?
by safe i mean ability to collect fully on the position you risked your money on.
If the coming downturn is as bad or worse than 08/09 as many here and elsewhere think:
are derivatives going to pay out? get bailed out?
are all etf’s the same, what do you own?
Thanks for your generousity.
Good questions, something to address once the first set of declines are done. I don’t think immediate trouble will hit, but problems will brew once there has been a hit on the wealth effect.
John
I am looking for your thoughts on a positions security in actually paying out. When you own an etf, what do you really own? If a downturn and volatility is coming that is some way related to faith or lack of faith in the fed the desperate measures will be taken, shortingmay be banned, etf companies may go under just when you are ready to get paid or have just loaded up at the bottom. Just a thought, but now seems the time to consider it.
Thanks.
Agree there will likely be rule changes and domino effects in certain assets/sectors. I’ve said before my aim is to front load my short gains before we get to that point.
John,
Thanks for all your research.
As I have stated several times in the past, it’s my opinion that we are not yet at the top because the market goes up in years that end in 5 (2015) and because of the presidential election cycle (up in 2016).
Also, notice the 98 percent correlation between the current stock market and the 1955 market 60 years ago which is a Kondratiev’s cycle: http://www.mrci.com/special/wspi55.php
This correlation indicates that the market is still in the Primary Distribution phase and has yet to top around July 2015 with a second chance around July 2016.
If the correlation holds, while there may be a sharp correction after July 2016, there may not be the decade long gloom and doom scenario in the markets that has so often been predicted. After the correction, there may instead be a run up to even higher highs in the market.
If my opinions are correct, the market will start to bounce before Jan 2015 and head for new highs around July 2015.
Jack
Thank you to the poster you brought the work of Ken Ring to our attention.
Click to access 4357544-Predicting-Weather-by-the-Moon.pdf
Seems like there is a connection between velocity of the sun, moon, and earth and angular position? I would reference the above link beginning at the the bottom of page 72 and continuing on page 73. More food for thought. I think this also ties in with Nelson’s work?
http://www.rfcafe.com/references/popular-electronics/radio-waves-sunspots-planets-6-1959-popular-electronics.htm
I have read and tried to process all the valuable feedback from contributors on the gravity topic. Thank you all; although I have not mentioned you each individually.
Eclectic,
Thanks for the cites, saved, and on reading list, starting tonight after Boardwalk Empire.
SC
Allen, fair enough and appreciate you have a different
take on this which is hopefully accurate.
It’s the current lead story on the FT site,
so it’s now beginning to get some serious comment.
So far this looks like a simple a-b-c EW decline (corrective) and projects to SPX 1884 = 2019 – 93 (1926), +51 or 54% (1977), -93 (1884) for 135 pts. Corrective wave should at least have a strong bounce, 50% would be to 1950 and 75% (1987 scenario) would be to 1985. I expect this to be last chance rally with 200+ pt decline to follow to SPX 1740. Net is 10+% (Dow)-15% (COMP) decline with SPX in middle, RUT may fall 18-20%. Other factor supporting a strong bounce is that each time SPX has closed outside bollinger band (4 times last on Friday), there has been a bounce of 30-50pts (twice the next day spiked lower so bounce is from that low).
I was expecting market lows in Nov but after reading about hedge fund liquidations, I have been wondering if this in-part pre-election selling to emphasize futility of Democratic bailouts and Fed policies, so may happen sooner. Rumors are that Republicans are pushing for Bush III as next president and are planning significant corporate tax cuts, taking over Senate is step one.
Where VIX makes it’s peaks and valleys will tell alot about where we are in topping/crashing sequence. Compare VIX turns to last two major tops for clues.
Just had an intuition about the Shemitah cycle of 7.25 years perhaps it coincides with the Saturnian 29 year cycle. Each time Saturn passes the Galactic Center at the border between Scorpio and Sag, to occur in 2015, or is opposite the Galactic Center 2001, or squares the GC 2008, 1994, this ushers in the Shemitah. These 7.25 year event of Saturn opposing, conjoining, or squaring the GC seem to match up neatly with market selloffs.
2015?
2008, 2001, 1994, 1987, 1980, 1973, 1966, 1959(late), 1952-3, etc.
Requires a bit of curve fitting to get an exact correlation for the steepest decline in prices but not the less there is a repetition of a downturn about every 7.25 years.
NICE!
Blckrock makes interesting point here:
http://www.zerohedge.com/news/2014-09-25/why-blackrock-and-every-other-bondholder-freaking-out-1-simple-chart
Fed sucks up liquidity by removing good quality bonds from the market, so people chase HY and high quality stocks for yield, but hedge with lower quality stocks and vol (should explain RUT under performance somewhat). This leaves whole thing unbalances and any shock (PIMCO withdrawals, EM or Euro sovereign shock?) can tip whole thing over. According to Blackrock liquidity is at historically lowest point and while corp leverage is increasing, spreads go ever tighter and are tightest ever. Same situation with leverage and spreads happened in 2007 and Greenspan rate hikes tipped the whole thing into a spiral. What will it be this time, hmmm?:))
key point from the Blackrock pice mentioned:
How this ends… the hedges start to fail (i.e. MTM differences between portfolio delta and hedge delta grow large), someone else decides to “sell” and throw in the towel and prices gap down in HY… and the avalanche begins…
Chinese say on Saturday: No QE for you:
http://www.zerohedge.com/news/2014-10-12/china-central-bank-crushes-hopes-large-scale-fiscal-or-monetary-stimulus
what? no more air (easy money) from anywhere? the stock market might demand it tomorrow while the bond market is closed:)
Slim, where do you see good investment opportunities next 12 months?
Steve
i happen to agree with John- no good investment opportunities over the next 12 months. Short and hold. The excesses have been tremendous, we need to flash them out of the system if we want to carry on in a normal fashion. I am in banking and think it is unacceptable that risk seem to have disappeared. Credit anyone? We’ll have central bankers with free money for all! This is no good and should be stopped, hopefully the time is now. I like that the Chinese seem to have recognized that their credit excesses are abnormal. The US and European credit problems are a walk in the park compared with Chinese, imo.
I also think that the US will be off the QE addiction for awhile (maybe they will keep the ZIRP though). The reasoning behind it is that the Fed got the US banking system in a strong position to withstand the incoming shock- the average leverage dropped from 20-30 down to 7-10. This is good. Unfortunately, the Europeans did not get there. Europe and China will be a problem. Europe tried to build a new society of different cultures just like the Soviets tried, well, it did not work out for the USSR, and likely will not work out for Europe.:)
Jonathan thinks that there will be a rush of money out of Europe to the US, but I view it more like a rush of troubles out of Europe to the US- we saw it back in 2011. It will be interesting. The market will sniff it out and the great unwind will begin. Maybe it already has started.
Thank you Slim. I look forward to how these economies and markets shift around over the next few years. With the Solar Max behind us I have a downward bias and we are due for the seven year reset. I guess day traders who have an efficient system or swing traders using some edge (such as the Lunar Edge that is mentioned) will do pretty well until the market resumes it’s bullish ways. David Gurwitz of Charles Nenner Research says Dow 5000 in a few years based upon cycles. I sometimes wonder if the india stock market may outperform into next year as it is up something like 25% so far. And of course there is the Gold sector which can exhibit unusual strength at times. Right now I am in cash, will try to make a few % short into the Oct. lows, and if the Gold sector breaks out may try to get a 10% move when the MACD crosses over. Thanks.
Sunspots at 35 maybe the solar minimum is here.
Thank you for sharing the information about the lunar cycle that suggests stocks do not do well when the moon transits Leo thru Sagittarius. If I’m reading the emphemeris correctly, that transit begins on October 17 and lasts until October 29. October 17 is this coming Friday, which means that if this transit holds true to form, the market has only 4 days this week to mount a counter-trend rally before another decline begins.
Question: In your research, how far back did you go to test this lunar transit?
I tested in back to 20000 BC. Just kidding. Back to 1990, seems to work 9 of 10 months, with most of dramatic sell offs during this window. Good job on following up on this.
9 out of 10 months, that’s excellent! Many thanks. Here’s wishing you a very profitable week!
I looked at the ephemeris a little more closely and my dates were off by a day. The Leo to Sag period goes from October 16 thru October 28.
Thanks Steve S. Appreciate your original research. Pl continue posting.
Now if I could just understand Andre’s A & P rate of change system, my profits would be to the moon!
Ran a test of this back to Sep 09 to Jul 14. 71 months of Leo to Sag. 17 up months, avg gain during 8 days 1.75% (almost all of the gains were during venus retrogrades which are like cat nip to the markets). 54 down 8 day cycles, avg. loss 1.24%. Net benefit of being out 37% (and if you exclude venus rx much higher).
Keep in mind this was during a market trending higher from the 2009 lows. The results are sure to be much more compelling if you look at the year 2001, and 2008 where most of the deep discounts were applied during the leo 8 days cycle.
Any one have idea p5 target ?
Thank you
and futures are down big, S&P -2%. lets see what tomorrow brings.
oops, i take it back, futures are down but not 2% big, my source is referenced to the thursday close. sorry, folks.
Bears fight back! 🙂 …. come on bears.
Click on the chart icon for current emini S&P500 futures DEC 2014:
http://www.cmegroup.com/trading/equity-index/us-index/e-mini-sandp500.html
Looks like they’re currently down about 0.5%
Long 1880-95
sir
sir you stayed with your position when it looked iffy above 2000. i hope you get paid well for staying short —-congrats
Thanks
Hi bn market extremely over sold ,
Rebound b wave 1948- 68
Then c wave 1656 -1738
Gl
View recent downturn as a healthy test of 200 days moving average. I may take a opposing trade to some of the voice on this site. Let’s see what it may bring the next few days.
Im posting FREE analysis on my twitter account after calling the top recently. Helping out smaller traders. Financial freedom for everyone. https://twitter.com/tradingtweetPRO
$SPX Low
1st scenario 15-17 October
2nd scenario 27Oct-3rd November
Overnight futures are not giving me the impression of an imminent waterfall decline. Better be prepared, that put-sellers and bulls will make the Monday decline look like a fake-out break of support lines and entice everyone to go in all over again. That rally strongly desolating bears and reencouraging bulls could finaly prepare the ground for a 10%-correction.
True Theo… Looks like this could be another false start for a Monday collapse. Certainly not following the narrated path of the analog is it? Interesting to see where we are when the US opens.
im long 1889, I think we get a right shoulder to around 56-76 level
Adding short SPX 1893
id be surprised if it doesn’t get back to 1905 as a minimum
Id be very supprised if it does. Just my opinion.
Reason i say this is because i want to a gap down at the US open and pressure to stay on bulls.
few stops hit then
http://www.irishtimes.com/business/economy/draghi-weidmann-fight-intensifies-as-ecb-debates-action-1.1961552?utm_source=dlvr.it&utm_medium=twitter
closed1/3 1904 stops to 1895 on rest
seeing strength in chf and yen
1906 more stops getting run
For what it is worth I believe the major test comes at around 15,150 on the Dow. This is the moving average level that hasn’t been breached since Sep 2011. Directly below it (c14,800) is some major support to work through. It is also the mid point of the 4780 point ‘FED is God’ rampage the Dow went on off the November 2012 low. That moving average has only been pierced once (Sep/Oct 2011) since it turned up. As a longer term bear, I have a minimum target of 13K but 10K is definitely within the realms of possibility. That takes care of the price component. In terms of time, I have a low window starting anytime from mid-2017 to Q4 2020. I use everything that has been of use to me over the years – including but not limited to common technicals, GANN, astro cycles, mkt geometry and other cycle studies. Feel free to bash me over the head anytime from 2017 onwards!
Duncan, you appear to have taken an aggressively bearish
stance, this this based on last week’s price action?.
were seeing the same price action so far as seen on the early august low
Ben, looks to be wider technical damage than then.
DAX, RUT, UKX, MCX .. a long list.
I agree, im talking last night today so far. im moving stops up, it could all fall apart again. ive added another short dax
Fade the open. We are going back to the May congestion zone.
All (smart) eyes on the SPX 200 SMA. where fortune (bulls/bears) will be made.
yes this week will b crucial, imo
More support in SPX 1880s. Previously I posted that the EW abc extension was to 1884 (-93,+51,-93). This AM I noticed that the 250 dma is at 1881. Along with congestion from Mar-May around 1880, this a logical area of support. Why 250 dma, all SPX declines for last 2 years stopped at 125 dma – so logical extension is 250 dma.
Since there was no sharp selloff this AM, we may be setting up for a “turnaround Tuesday” frequently seen on options exp – selloff Mon aft into Tues AM, then rally.
the bulls should have let the market open down 4 or 5%
now, with this opening pop, the decline could become cataclysmic
With all the focus on the 200dma people have forgotten the 50wma’s. Just broken on the DOW and Nasdaq and very close on the SPX.
slow moving train wreck which is good news for the bear case.
Looking at the carry trade unwind (usd/yen) market is still in denial far from accepting reality that this round of the global leverage binge has probably crested. Good news is that the rising wedge over-shoot has settled back inside the wedge from 3/2013 around 107.8 with the lower trend line around 102.5. Once this breaks the pair targets 94. That is when bulls will have capitulated. This shows that there is plenty of road to chew through before this market will be over-sold or in panic mode. Again I prefer a climbing the wall of worry bear rather than a quick sell off which is usually bullish.
I am trying to find the bullish case for a sustained bounce here but I am seeing bearish flags on the intraday charts EVERYWHERE.
Bulls putting up a fight here as you would expect.
So everyone appear to consider this the key week,
for both bulls and bears.
John,
are you expecting a slight bounce this week considering its an opex week.Did you check CBI is it over 10 now.
Bill,
Quantifiable Edges tweeted that will likely be at 12 —
http://stockcharts.com/h-sc/ui?s=$NYA&p=W&yr=10&mn=0&dy=0&id=t27740136720&a=370927705&r=1413218114800&cmd=print
sure looks like the broad market has reaffirmed the secular bear
The high tide effect worked again today. The DJIA SPY QQQ all trend down significantly intra day during the hour of the high tide. Hi tide at 1PM, QQQ trended down during the entire hour. Want to figure out how to profit from this. Maybe eminis in the futures market.
Closing all shorts SPX1903. Reason – no follow thru by bears and looks like we go higher from here.
looking at 2 tidal stations – the next tidal cit (using the 3 tides method – tide before extreme, extreme and tide after extreme), the next cit is between 10/15 8:16 am and 10/17 10:19 am.
Hey Peggy so what does did tell you can you share your thoughts here?
I.m still holding on my prediction we will see the lows around 6-7 November and later on after lots of volatility November 20-22.
thanks Carpediem, I’m in agreement with you – expecting a low 11/3-5.
I think the small bear rally today is probably done, as the ABC wave looks complete. If my read is correct, we’ll shall see SPX back in the red by the close today and tomorrow morning.
No follow through by the bear today has been definitely a disappointment.
Sunspots down to 26 today.
added to longs.. bull flag
long nazdaq 3861
fwiw
i think closing shorts or going long is not going to work here
Bull flag me behind, wild swings are just knock out positions and weak hands, on both sides
Loads more volatility could be in the pipe line before this finds it’s next 5 year direction.
5yrs!!!!!!!!!!! im a day trader
I don’t understand why anyone would close their shorts or go long without 2 of 3 indices failng to break above thier 200 dma’s?
There was virtually zero show of strength the whole session. These indices will close the day out at or close to their lows of the day.
Sorry should read
“with 2 of 3 indices failing to break above their 200dma”
Just to add,……..check the 15 min charts. All 3 indices did a back test of resistance and failed
will u join Duncan in being wrong
Then day trade for another 5 years then, or approx 1200 trading days ,as long as you day trade in the right direction and park emotion their is no reason not to make money..
I presume that’s what your doing now, and proberbly always have done as a day trader.
probably is not spelt like proberbly! please learn English before commenting
I am going to start using the word proberbly. It sounds very cazual.
Very s/t SPX 15 min seems to be forming a truncating 5 wave (ending) from last Thur with (-55,+20,-45,+20,??). Possible projection with e -35 from 1910 is 1975.
arthur, I posted a target on Friday of 1870 on a double bottom break of the 15 min but to be quite frank I am not prepared to say at this stage that we are not headed for a crash so I will be holding long VIX until I see evidence of a reversal.
All markets are beginning to look extremely vulnerable.
Well played here, Allan.
Thanks Gary and a big thank you to John of course for keeping us all so well informed. It really helps when you have conviction on top of being so well informed and in over 30 years of trading I can honestly say that John’s research is second to none.
Opps sorry did I het a bed nerve 🙂
Now 200pts down
I love the smell the smell of burnt bulls S in the evening.,
Like I said bull flag my behind:)
looks like a bear follow through. whats next? more panic, margin calls?
If there’s no respite tomorrow morning, all heck could break lose. The multiple day sell off has been rather orderly up ’til now. That will start to change with panic setting in…
That’s “loose”. But perhaps “lose” is the better term.
Square of 9 with start date of 3-6-2009 and start # 1 = 10/13/2014 at 1871 on the west arm.
nice call! came within 3 points of 1871.
well no crash today
i’ll hang up my puetz window
10/2-10/13 no crash but did some damage
according to one definition I have of the Puetz crash window, the recent lunar eclipse did not qualify. The window occurs around a lunar eclipse that follows a solar eclipse. This particular eclipse series has the lunar first and then the solar, so I don’t believe it qualifies.
next sq of 9 turn is 11/5/2014 – possible prices 1807, 1723. If it’s a high, then 1893, 1981.
Oh lordy, this looks like it’s actually happening.
Fantastic day for the bears.
All over the day I already had lost my faith, but obviously an unequivocal oex call-put ratio is a reliable indicator most of the times. I’m curious what today’s ratio will say. Stocks down on Monday, up for the rest of the week ? In any case there was a positive divergence: In the evening the DAX future didn’t touch last night’s low, while the Dow clearly undermined his Sunday low. Who is leading ? The benefit of the doubt is in favour of the DAX
Wow. VIX is spiking again in the big way. At the same time, divergences have disappeared. If the bulls don’t fight back early tomorrow, I think the current impulsive wave down will get worse and all hell will break loose.
Congrats to John and all of the bears for your resiliency.
http://stockcharts.com/h-sc/ui?s=$NAHL:$NATOT&p=D&st=2014-03-14&en=today&id=t40459465746&a=369189956&r=1413227459080&cmd=print
secondary short signal here
this is the chart THAT NEVER LIES!
BBE, what does a “secondary short signal” mean in this context?
means that if you are short stay that way and if you aint then get some
Got it – thanks
Great calls by Allan today. You are on fire!!!!
Thanks erick, an interesting session coming up tomorrow and it’s only one of two scenarios. We are near a sizeable bounce or John’s waterfall declines are upon us, which means very little respite from the downside. I can’t see us having an uneventful day tomorrow.
Allan: Agreed with you wholeheartedly, that tomorrow alone could potentially be the most important date in 2014 for the bear case.
If the market is going to bounce, it has to do so immediately and forcefully. Otherwise, a larger cycle is dominating and the market can continue much lower, maybe 18-30% off the top established on September 19, as John has brilliantly projected.
If there is no bounce tomorrow, the waterfall sell-off – if happening, imv could set a record for a single day of largest drop since 2011, which in turn will set up SPX for the next support level in the 1700ish range and more selling for weeks.
As regarding to VIX, the potential of the spike is extremely high, assuming the crash indeed takes place. Obviously the risk of holding the VIX vehicles is also quite high.
According to Nathan Bueler, a regular Seeking Alpha contributor on VIX vehicles: “Futures are currently in 5% backwardation. In 2011 they reached over 27% backwardation and historical data from 2008 shows it reached a high of 48% backwardation. These levels typically will not hold for more than a few days to weeks. If a similar situation occurred than I would look for a rise in UVXY equivalent to 300% or 1000% respectively”.
Erick,
http://econocasts.blogspot.nl/
This is great Peter. Thanks.
It’s not clear how accurate his forecasts are. The VIX charts have shown an imminent upward move all year – look at all the previous versions.
I had posted this earlier on the Trending Waves blog. The target is within 20 to 25 points on the S&P. So I guess the next ‘big’ trade has got to be to the upside.
https://www.tradingview.com/x/426PaUMd/
My view is nearer 1990 – 2000 BUT NOT ATH. So set your ‘take profits’ accordingly.
Of course there is also the ‘waterfall’ down call so set your STOPS accordingly too please.
its possible that a bounce will start tomorrow – note the UI is higher that ever since 2013
http://stockcharts.com/h-sc/ui?s=$WLSH&p=120&st=2014-07-10&en=2014-10-13&id=p51008124558&a=368755255&r=1413233916473&cmd=print
UI needs to peak and then be confirmed by other indicators like
THE CHART THAT NEVER LIES!
There was a huge purchase by large block traders today in the SPY
(buying on weakness). I guess up till Friday. Then watch out below.
Cam Hui, http://humblestudentofthemarkets.blogspot.com/
is mid term bearish but believes that near term going to have a earnings driven bullish move. He has a good track record picking turning points. We are in the positive lunar period, seasonality should support higher prices, and mid term elections coming up are usually supportive.
SPX 2 hr – http://screencast.com/t/Zozwnvnw4o
Was waiting and watching all day – saw it go up, then drop and drop it did…needs to go below 15 K on DJIA to make me think of it as more then minor correction…
Allen, do you really see Tuesday’s potential price
action as that back and white, either hard down or
hard reverse?.
Thanks all, new post is up