
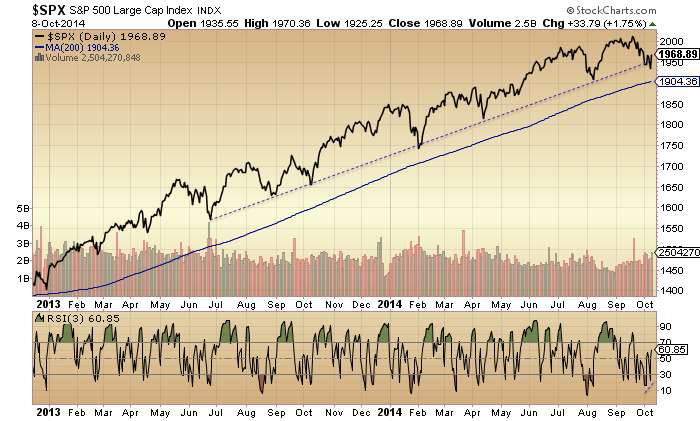
Tuesday’s selling to a lower low delivered the missing positive RSI divergence on the SP500 and out of that we saw a strong rally on Wednesday.
It was a necessary stick save for the bulls at key support in most indices, particularly the Russell 2000. So we are back to: is this another v-correction or just a save before a true breakdown?
There were clues behind the scenes yesterday.
The best performing sectors in the rally were the defensives: utilities and healthcare.
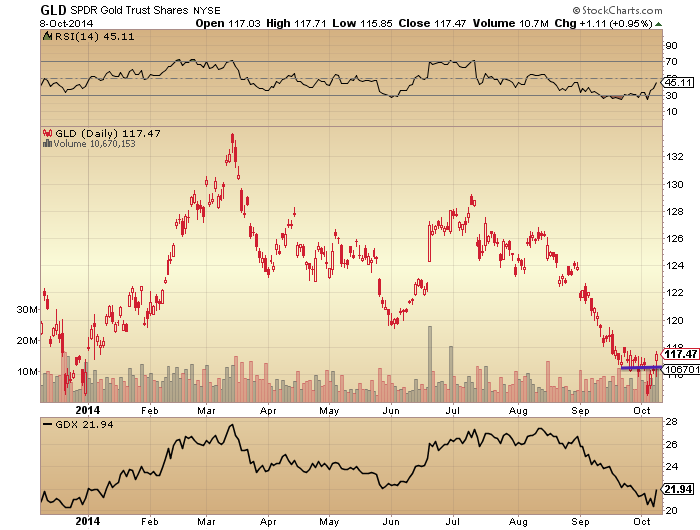
Gold and gold miners rallied and appear to be turning last week’s breakdown into a fake-down.
Treasuries also rallied, so either risk or defensives have it wrong.

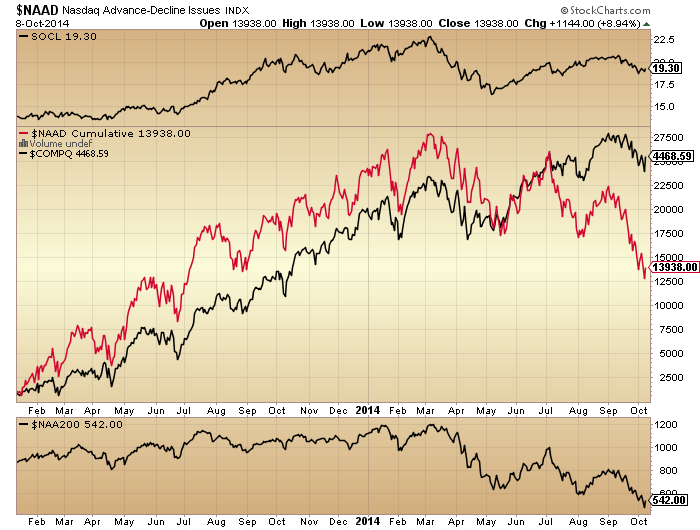
Breadth weakened rather than strengthened, casting doubt that equities have it right.
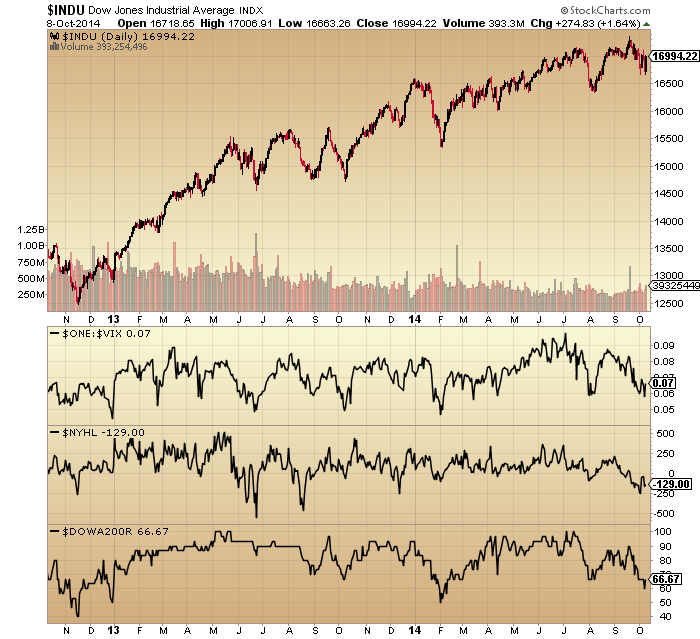
The above chart shows Vix remains divergent too.
Investor Intelligence % Bears are at 14.1 this week, still at the historic extreme, so there has been nothing remotely resembling a washout. Complacency rules.
The US dollar’s parabolic has broken.

Lastly, to respond to the point that this chart may be cherry picking the RUT as it fits time-wise:
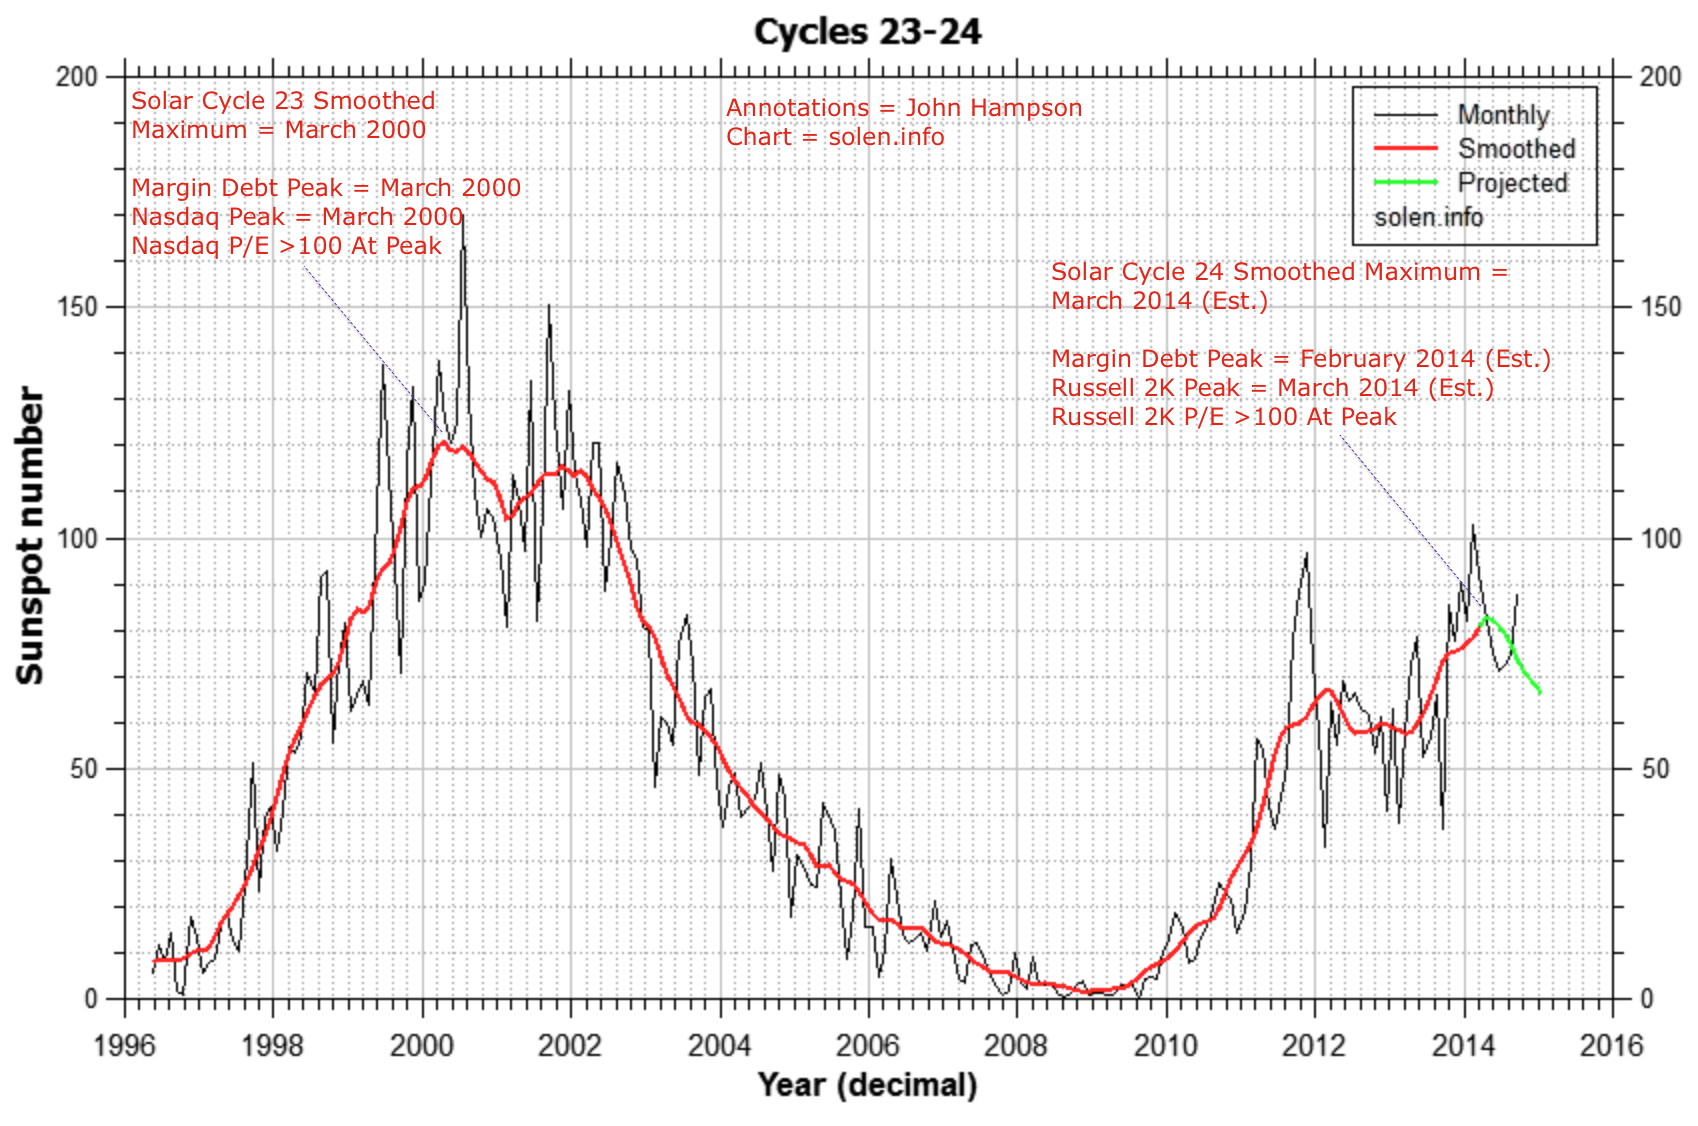
My case is that the RUT was the speculative target as evidenced by the p/e, hence the epicentre with RUT and margin debt right at the smoothed solar max. However, the point is that all stock indices should top out close to the solar max, without any cherry picking. So, the last solar max peak looks like this:
March 2000 = Smoothed solar max
December 1999 = FTSE peak
January 2000 = Dow peak
March 2000 = Margin debt peak; Hang Seng peak; Dax peak; Nasdaq peak; SP500 peak; Russell 2000 peak
April 2000 = Nikkei peak
So, the epicentre was March, and all major global indices topped out within 4 months of this. Now, if you assume here in 2014 the smoothed solar max was March and that all stock indices have now topped out (for which there is a strong case), it looks like this:
March 2014 = Smoothed solar max
February 2014 = Margin debt peak
March 2014 = Russell 2000 peak
May 2014 = FTSE peak
July 2014 = Dax peak
September 2014 = Hang Seng peak, Nikkei peak, SP500 peak, Nasdaq peak, Dow peak
So, the epicentre was March and all major global indices topped out within 6 months.
However, this can’t be validated until we are sure that the smoothed solar max was then and that stock indices do not make new highs from here. Nonetheless, with every month that passes odds are that this is correct and that stocks were on borrowed time since March.
To sum up, by the looking under the hood, the probability is that yesterday’s rally in stocks is quickly reversed again. This could happen as soon as today, or perhaps more upside can be squeezed out into the end of this week. But the signals point to ultimate failure, which means the stick save at support is just a temporary reprieve for the bulls. To those who think yesterday’s save means waterfall declines aren’t going to happen this year, understand that this was a crucial save at the final support on the RUT: it was unlikely to break without a fight. Traders have become conditioned to buy the V-bounce at support over the last 18 months, but the clues are that this time should fail, as covered in recent posts. 6 of the top 10 biggest Dow down days occurred in the window right ahead:
19 Oct 1987
26 Oct 1987
28&29 Oct 1929
6 Nov 1929
15 Oct 2008
And I believe this picture nicely sums up the Q4 2014 scene:


Likely we head up (save a few pull-backs) into OpEx next Friday would be my take John.
Options writers still have a pretty good hold on this market at the moment and we have lunar positive (or the apogee – perigee gravitational positive?) to assist.
I think yesterday’s (fairly predictable reversal) will likely provide sufficient momentum to to squeeze out a lower high/ double top.
Could be miles out so DYOR & WTFDIK.
Thanks, Sp500 usually up into OpEx. Appreciated for reminding me that . Could long on this Friday or next Tuesday after Columbus
“Could be miles out so DYOR & WTFDIK.”
Yep, that just about sums it up! 🙂
Thank John. Markets too volatile so I focus on short term. Statistically, when SP down 1 day and rallies next day , subsequently it down (after a day, a week or a month). So today Thursday it could be down as well. Usually the low or the High of Monday is also the Low or the High of the whole week. So the high of this Monday 1977 (sp cash) could be closed to the top of the week. Additionally, the fist 9 business days of Oct often down. It want to buy intraday, buy on Friday. The day -1 before Columbus, SP highly likely up
Thanks for the great analysis John. I love that picture – a picture says a thousand words! Bulls have been lulled to complacency, low VIX. But they will be in for big a surprise; Especially if the wave count is right – a (3) of (iii) of 3, which is a waterfall decline within the next couple of weeks.
Mchugh is now showing a fractal relationship between this time period and the time period right before the crash of 1987, lots of similarities in which there were strong up and down days indicating an unhealthy market getting ready to throw up and crash. This looks like a high odds bet to me.
Mae, this fellow doesn’t look particularly reliable. Has your experience been different?
http://www.cxoadvisory.com/3373/individual-gurus/robert-mchugh/
Hi Gary, someone had recommended him to me because he is good at pattern recognition and Elliot Wave counts. I am not an active trader, so can’t really say how accurate he has been. I have been subscribing to him on and off for the last couple of years and generally he is pretty good. He was one of the first to come up with Jaws of Death idea over a year ago – that the major indices will trace a big megaphone pattern before they top out and that is what has been taking place. I think no particular market analyst can have a solid track record, so take your pick. I tend to be a big bear in the long run, so I think we go with what resonates with us – like this blog. :_)
“…the crash of 1987, lots of similarities…” Therein lies the problem Mae.
Today we all have the priviledge of being able to see those similarities. Back in 1987 no-one had that priviledge – that’s why very very few saw it coming.
The essence of a crash is that it happens by surprise, apparently out of the blue when hardly anybody is prepared for it – that’s why they all try to sell at once.
At the moment, just about everyone is expecting a crash…
Good to see your comments mark. Looks like S & P 500 bounced at 8th Oct – turn date mentioned by some posters who follow Mahendra Sharna and bradley turn dates. Past pattern i use also suggested 8th Oct 2014.
Now my pattern says up trend till 23rd Oct (diwali- last day of indian calendar). Around 24th/27th may be for just (2 sessions ?) it suggests again sharp down. Surprisingly QE ends near that date as well.
Secondly, Steve S made good observation that in a decade “year 4 4Q to year 6 1Q” US Equity gains. Can I request Steve to elaborate further?
I remember you mentioned your 8 October date several months ago Jigs. Close to mine around 5/6th, and several other commenters here. But I get the impression these analyses are diverging from each other after this week – so maybe further wild swings in both directions over the coming few weeks could give investors a good shaking before US stocks make a meaningful move..?
If you look at a decade chart of DJIA from:
http://www.seasonalcharts.com/zyklen_dekad_dowjones_100j.html
you can see this shown on a chart. Year 5 is the best year.
Love ya, man. I disagree on everybody expecting a crash. Actually, “everybody” is long term bullish. In fact, the permambulls on CNBC, have switched from cautiously optimistic to buy the dip, healthy correction, long term secular bull, etc.
Oh, thanks Kent!
If you were invited onto CNBC, either as a market commentator or as a representative of a financial institution, would you tell the world that the stock markets are about to crash? You’d need a once-or-twice in a lifetime crash to come along pretty quickly, or your TV career would be over. The sales director of your financial institution wouldn’t be too happy either.
The vast majority of TV talking heads are permabulls by definition.
https://pbs.twimg.com/media/Bzfg7ZDCAAAlwco.png:large
We’re on the same page John.
As I said yesterday, nothing has changed. The Fed minutes was merely an opportunistic time to take the indices higher at a very critical technical level for the markets.
The problem for the bulls is that the Fed no longer hold the upper hand. They are now committed to ending QE unless there is some black swan event, which is what will likely happen, but until that happens they now have no option but to follow through and end POMO or lose credibility big time.
As well the US has to contend with ever imploding economies from the rest of the world that will certainly drag the US lower.
My outlook has not altered one little bit. There may be a little after glow from yesterdays bounce left today but markets will reverse back down hard at any moment. The US indices are right on the underside of resistance and will find it hard going from here getting much higher.
Lastly, the reversal in gold and gold stocks was no flash in the pan IMO and despite the current commentary had nothing to do with yesterdays Fed minutes and everything to do with the bigger trend and picture. Fed minutes may have been the trigger but it was by no means the real reason as I believe that a gold and dollar reversal were certain.
Gold is now bottoming or bottomed, whilst markets are going much much lower along with the dollar, just as they did when the dot com bubble burst.
The real winners over the longer term will be gold and gold stock holders and those short stocks.
Cheers, another great report.
PS. The comments directed to Jonathon on the previous thread are shameful and embarrassing. Please accept my apologies Jonathon
Thank you for the apology Allan but honestly you have no personal need to do so, as you know. But I appreciate it and that makes you a gentleman in my book. I have a fairly thick skin as I deal with Saudis every day 🙂
Another wonderful write up by John and it keeps me thinking critically, whether the roadmap you both share can in anyway ‘marry up’ with mine. I have no real edge when trading short term and I’m looking 12 months out as you know. But I’m intrigued about the way the end of this week plays out and October in general. Personally speaking, a minor correction such as we’ve had up until now is what I factored in… 5-10%. I don’t think a deeper correction (10-15%) would invalidate my thesis, but a crash certainly would. Therefore, my thesis could be completely invalidated by the end of this month if we see falls of 20% or more.
I realise I invite criticism but it’s not my intention to troll as one or two obviously think. I try to bring something to the table in order balance things out a little. I come here for the same reasons as it helps me to keep focused and to always consider the flip side, so to speak. I agree 90% with John’s analysis but like I said, just my timeframes differ.
Anyway, keep up the good work John and thank you for providing all of this for free. It’s incredibly generous. And best of fortune to you too, Allan. Hopefully it can be a prosperous Q4 for us all.
There is an edge for any short term trader who committed to learn, Jonathan. Like this Wednesday, a day trader could make a home run if the market up and down crazily. 70 years ago the guy named Gorgeous Douglass Taylor wrote a master piece to analyze the footsteps of market makers and specialists and he suggested a set of strategies to follow them accordingly. Linda Bradford Raschke also very successful in term of short term swing (keeping a position for 2 days only). Larry Williams also very good in short term. Bob Buran the guy doing 2 day swing is only a trader update his stock analysis daily on youtube. You must know well what you doing when you publish things daily in public especially you talks for years. Of course for intraday trading, it is crazy, I have no idea at all
Well Le if you don’t understand intra day trading then you should learn from the best…he’s posted daily results going back to 2005. Bit OCD I would admit but certainly gives enough evidence to support his case lol.
http://www.thestrategylab.com/tsl/forum/viewforum.php?f=147
http://www.thestrategylab.com/ftchat/forum/viewforum.php?f=20
Thank Bert but intraday too fast for me even if I understand it
Well I see the web you give me, I think actually he and me doing the same strategy for volatility breakout but I consider it not intraday at all.Just 2 pending orders long and short at a distance from yesterday close or high or low based on ATR.IMHO, for day traders to be successful he or shed need to know how to combine 2 opposite strategies: volatility breakout and testing trading
Yes, I agree that you have to trade your personality and what makes you money. The WRB method can be used trading on any time frame that fits your personality. Mr. Perry trades it very skillfully on an intraday basis normally using three minute bars but the most impressive part is his money management technique which is probably the most important and difficult part of speculation in the markets. As you can see from his daily performance dating all the way back to 2005 he plays the market like a fiddle and by doing so fills his coffers with profits. But this is a very difficult way to speculate (short term) in the markets and not anything I would recommend to anybody unless they have a lot of money and time to burn as it take many years to learn how to profitably play the markets on a short term basis.
An obvious place for the DAX to pause. Would not be surprised to see it put in a flag before taking out the double bottom but I wouldn’t bet on anything more than a minor bounce.
And when it takes out the double bottom it brings into play the large head and shoulders of course.
http://stockcharts.com/h-sc/ui?s=$DAX&p=D&yr=1&mn=0&dy=0&id=p35194396372
Seems DAX failed in terms of TD Set up
Giving up most of its earlier 145 point gain as I type, FTSE negative. Is that all the bulls had??
Love the picture John. Lol. Took me a few seconds to spot the figure in the doorway.
Another point, from my personal experience, was these kinds of exaggerated movements within a few minutes which happened in early 2008 before the bottom fell out. Round trips of 200 to 300 points each way on the DJIA within a matter of hours were not infrequent.
Wow any Swiss natives out there that are able tovouch for this? It appears to be legit.
If it is good luck getting your 1040t back anytime soon. As I have said previously I am not a huge conspiracy theorist or am I a “gold bug” but as the saying goes. “where there’s smoke there’s fire”.
I have always been more than a tad surprised why Germany had to wait until 2020 to get back its gold and why the financial markets hardly batted an eyelid as that being even slightly bullish. In fact quite the opposite, days after the announcement back 2013 gold got hammered. And I mean hammered.
Funny that?
http://news.sharpspixley.com/article/switzerland-about-to-purchase-1500-tonnes-of-gold-/212898/
John,
This postman in Canada confirms your picture, reason package not delivered:
Bear at Door
Thanks John
Thanks for making me laugh!
Great pic!
Nothing has changed in “currency land” as we’ve been short USD / risk for a couple of weeks now – catching nearly every point of this recent turn.
Bounces are expected as nothing moves in a straight line for too long.
Roll with them, but as per John’s outline, my framework sees further “larger” losses ahead for global risk.
FK, what is the first major target you see for the USD/YEN?
105.80
Thank you –
I’m worried that even though market is destined to crash, there are market tools designed to limit bull losses. This is frightening to bet against. The house has the edge. On the flip side, it might be worth the risk since if it breaks through these loss limiters the drop will be epic.
Another thought provoking piece John, thank you.
The early mark ups have largely been reversed in Europe.
6,400 on the UKX and 1,900 on the SPX are the levels
I do not expect to be breeched.
If we trade below those levels for 2 consecutive days
then my personal relatively bullish outlook has been invalidated.
My Sunday post said Wallstreet a low on Wednesday and Europe on Thursday. Wallsteet higher low to day.
If you don’t believe just check the Sunday post.
Andre I can’t remember whether it was yourself or Steve T who said some sort of a mini crash on 10th. Please would the relevant person confirm or revise. Many thanks.
I wrote it down and was very impressed
thank you Andre
Andre, Thanks for posting. I read all your posts and I believe your gravity logic has some strong correlation with markets’ turn dates.
i WROTE IT DOWN ALSO, i CHECKED YESTERDAY S&P’S LOW ABOUT 4 TIMES TO DAY!!!!………
Despite yesterdays huge reversal many indices remain bearish. Weekly amd daily Indicators remain negative
http://stockcharts.com/h-sc/ui?s=$NYA&p=D&b=5&g=0&id=p30011537004
Yesterday was a “bull trap”
Those who seek attention for one good call in every ten,
do not impress me in the slightest.
I read Steve T with interest though, and he’s also humble.
Allan, you may be correct, interesting day.
I have to be honest and say I did not expect a rapid
sell off in Europe today, some of the gains lasted minutes.
Still all in cash.
Am now maximum long on ftse. Looks to be bottoming out around this area and it’s far better value than the Dow or dax which I believe are overvalued compared to their respective economies.
Looks like this will end up being a down week for ftse after all. I expected a very positive finish today which hasn’t occurred.
I do not subscribe to conspiracy theories,
can’t remember ever believing even one of these.
However with ebola I think the transmission risk
is being underplayed.
This does not mean it’s mutated or will cause mass deaths,
seasonal flu will be far more dangerous for the vast
majority.
However for markets if some sense of panic develops
with increased cases outside Africa, this has the potential
to hit certain sectors very hard, just my take.
Only way we can really understand this crazy world Phil is to look for the “Conspiracy Facts”. This is the only way the dots connect when the Psychopaths are in charge. I didn’t believe much in the conspiracy stuff until after 9/11/01 when it became obvious that it was a false flag. And more to come too because the same Parasites are still in charge.
prepare ye all for the Mario in Drag bounce that will surely lead to the bleed (not of the nose kind!)
So has the dollar broken out to the upside and completed the pullback to the breakout ready to really take off
or
Has the parabolic rise in the dollar ended and it has rallied back to back kiss the breakdown level before it crashes
Something is preventing DAX support breach.
here we GOOOOOOOOOOOOOOOOOOOOOOOOOOOOOOOOOOOOOOOOOOOOOOOOOOOOOOOOOOOOO!
1937 will be key as will xrt and rth
I’ll say it again – THIS CHART NEVER LIES…no bottom until these indicators turn
http://stockcharts.com/h-sc/ui?s=$NAHL:$NATOT&p=D&st=2014-03-14&en=today&id=t76409342030&a=369189956&r=1412870367433&cmd=print
Glad i extended my Puetz crash window to Monday 10/13/14
That is some reversal, wow.
Phil, like I said yesterday the markets rallied on NOTHiNG. The fed is no longer the driver of these markets until QE 4 is announced, but we’ll be a lot lower by then.
My asset allocation
^.^
I hold 55% TPINX (Global investment grade bonds),45% cash
secondary painted face war cry while sucking down WCCG! AYEEEEEEEEEE!
Mario you failed me!!!!!!!!!!!!!! lol
1937 on tap
Allen, great call, well done.
There is no way I expected this.
I also have to admit that I may have bought
stocks from my watch list this morning,
but the initial sharp mark ups prevented that.
Luck rather than judgement.
Thanks Phil but nothing compared to John’s BIG call. I believe hindsight will show that John was correct about the speculative top. He saw through all the smoke and mirrors, froth and bubble and hype of higher highs in other indices to nail the real speculative top and then stood firm whilst all doubters tried to convince us that it was not ending. Amazing work by John.
Here here Alan
Regards
Mat
Thanks chaps
http://stockcharts.com/h-sc/ui?s=$WLSH&p=120&st=2014-07-25&en=today&id=t64353132329&a=368755255&r=1412871289807&cmd=print
measured death
Yeah!!! Someone else who sees the Expanding Leading Diagonal!! I was feeling a bit lonely. 🙂
it was a choppy formation because of all the social engineering going on but it is playing out and it is very dangerous pattern
http://stockcharts.com/h-sc/ui?s=$INDU&p=120&yr=0&mn=3&dy=0&id=p03242657149&a=368958338&r=1412873233474&cmd=print
gotta break support
BBE I’m fairly certain it break support. I’ve seen your posts further down and I get the impression that you do too.
Backdrop for a crash
http://stockcharts.com/h-sc/ui?s=$NYUD&p=D&yr=0&mn=2&dy=19&id=p74556505902&a=367853694&r=1412872684247&cmd=print
mid channel failure means that the lower keltner is headed through the 200ma
best bulls can hope for is a fail followed by sideways chop but it is not looking good for them as every longer term view is rolling over without mercy
http://stockcharts.com/h-sc/ui?s=$INDU&p=D&yr=0&mn=11&dy=0&id=p78969201599&a=368645081&r=1412873099442&cmd=print
still some bull room but the dance floor is VERY crowded at this point
http://stockcharts.com/h-sc/ui?s=$INDU&p=M&yr=20&mn=0&dy=0&id=p69494817865&a=367908471&r=1412873769345&cmd=print
seems inevitable at this point with RUT in bear market and economic data at its debt driven end
As I have mentioned in yesterday’s comment, I had observed several instances of previous Bradley turn dates being only a one or two day phenomenon but then have meaningless impact to the overall short/medium term trend. Granted, it was an unbelievable one hit wonder for the bulls on a 45+ point intraday rip in SPX, but it stalled at the downtrend line.
This could create a very interesting situation leading into early next week. I would speculate that the USA stock market will consolidate (higher from today’s low) on Friday and early Monday before the next big move, considering mid-Thur and Fri were “supposed” to be bullish days this week.
Be advised to stay away from this market except you are a day trader. Now I see a day trader can profit much in a highly volatile market like this. I know how to trade short term swing but lost a big picture.Thank John for balancing my view so I can focus much on my battle of day trading. This beautiful volatility happens once to 3 times a year. For Sp500 this year, Mar, Jul and this Sep-Oct. I admit that I scare of big institution activities when I do day trading and this blog and others as well help me much. So may I share with you a bit if you interested in day trading.Otherwise it still provide some useful info:
– We have OptExt nextweek, usually Sp up into this Oct 17
– We have Columbus so tomorrow Friday it usually up
– Statically, SP doing well in the 3rd and the last week of Oct
– Cyclically, Oct is the month for bottoming
Today Sp down much and if not break the double bottom and makes a higher low, then place a buy on Friday at opening then take profit on Tuesday after holiday or until Friday Option Expiration. Next short on Monday at opening after this OptEx and take profit for 2 days. Wait for the last week of Oct then try to long for the next leg rally.I just like to sau a day a day trader like me still benefit or interested to read John everyday about solar and moon things. He know how to synthesis and write beautifully.Thank for reading
Unless this is the instance when the opposite of statistical majority happens, taking day traders by surprise and compounding volatility.
also seems to confirm that the next “Terry” T is going to be a major bear T so any bounce will be bearly (yes a spelling pun) back above the falling mid-channel
http://stockcharts.com/h-sc/ui?s=$NYUD&p=D&yr=0&mn=7&dy=11&id=p68897809979&a=367854604&r=1412874188479&cmd=print
and the dippers go…
16665 on dow and 1937 spx
IT JUST WONT BREAK! MORE WCCG!
hell of a lot of support of one kind or another being fabricated here
crazy
VIX has a steel ceiling.
BBE I think I’ve asked you this and apologies in advance if you’ve answered and I’ve missed the answer. What the heck is WCCG? Its driving me crazy as Google doesn’t know it either.
Whip Cream Can Gas – invest in it at your own risk! roflmao!!!
HAHAHAHAHA!! Of course its obvious once you explain it!! Thx.
ok – now 1915 and then 1895
the cracks are widening
1905 is key
August pullback low
200 day EMA, spx already below 20 and 50 EMA
a lot of technical trading will go short and margin calls hit from earlier in the week
might happen tomorrow, who knows
if so, monday crash
finally some confirm! lol
http://stockcharts.com/h-sc/ui?s=$NYDEC:$NYADV&p=D&yr=0&mn=7&dy=0&id=p90609425033&a=368771002&r=1412879077292&cmd=print
That’s what I will be watching for – margin calls accelerating this down turn over the next couple days.
spx could close -3%
Love solarcycles.net posts in the morning. A bit of deflation and a cup of coffee “ain’t” bad either. Smells like victory.
The Dow will test the 200 dma, bottom and resume his uptrend. If such (my) complacency persists – see correlation to Dow 1945/1946, which is only 67% now –
http://www.mrci.com/special/ddji46.php.
But it is remarkable, that the relative levels of the topping process are very similar. The 10% decline of 1945/1946 from current levels could still be matched with a retardation of two month over the next few weeks
hope springs eternal!
The only sector that hasn’t folded is health care. More evidence that this is a huge underlying demographic problem. Baby boomers are buying drugs, but that’s all the economy has going forward.
Make that drugs and bonds.
no kidding – go to you local pharmacy and look at all the racks of filled prescriptions stacked to the sky – mostly BS antidepressants and mega pain killers…
Tech and perhaps “biotech” are also at the highest p/e and primed for a collapse as per Sornette bubble end flag.
My son is an M.D. I tell him that they teach him Rockefeller Medicine in Med. School – controlled by Big Pharma. Rx. R stands for Rockefeller (did you know the oil banksters also control the drug industry?) and the X stands for the X ing out of your life if you take too much of their synthetic drugs.
Fantastic comment, Mae. 100% accurate.
1929
price! not the year! lol~!!!
DIPPERS!
John and all, so what’s the view on the gold miners now ? I’m tempted to cover my shorts. By the way I was just kidding when I said I expected gold to go to 250…
So, do the miners go down with the market or will they eventually buck the downtrend ?
Congrats to the bears.
The miners are gonna to get smashed you dumb ass! Why would you cover? Jeez dude.
DA – my new handle! the kindness of strangers never ceases to amaze
Jeez, Nicolas has met his match in juvenile posting. Too funny…
I got squashed today going long JNUG on weakness (lost $400). Strengths:
Diwali in 2 weeks, they are down already, perigee was Monday and two weeks after perigee usually good, middle month usually better than turn of month, Jupiter in Leo is supposed to be good for GLD, ECB loosening, Mercury is retrograde which has been good to miners, Cam Hui(Humble Student website) and Pres. Radomski(321Gold) turned bullish yesterday. Weaknesses: GDX may tank with broad market, October is historically a weak month for miners, trend is down, some of the more reliable gold commentators are bearish till 2015.
My opinion: until next Summer, anyones guess. Try to find a system that works for you and day trade them. I am waiting for the RSI daily 14 to go positive before I will hold a miner position for more than a day or two.
Interesting summary of the effect of perigee from Richard Nolles’ Astro website:
“Perigee means closest approach to Earth. As I pointed out in my 1979 article, there are hints dating back to Ptolemy (2nd Century CE) that the Moon’s perigee is a time of magnified lunar influence on Earth. After all, at lunar perigee the Moon is closest to Earth and therefore its apparent motion as seen from our home planet is greatest. In other words, the Moon is ‘swift in course’ at such times, to use an archaic astrological term. Regarding the significance of the planets (a term he used to include Sun and Moon, following the practice of his time), Ptolemy advocated paying special attention to any planet “when it may be oriental, swift and direct in its proper course and motion – for it has then its greatest power.”1 (Emphasis added.)”
Steve S.
Excellent! Ptolemy. Next we might hear of Saphariel! I will show my Ignorance. I understand swift and direct. But oriental? Any insights? My guess is angular relationship.
Probably a reference to the movement from east to west in the sky that the sun, moon and stars perform on a daily basis.
Bradley turn date Oct 9-10 could be s/t bottom at 200 dma for SPX at 1905 with next turn date Oct 16. If next turn is high at SPX 1985-1991 that sets up H/S top with projections to 1850 then 1750. Could be 100+ pt smash then Xmas rally before second leg or just 200+ pt crash. This fits both the 1987 analog mentioned above and my 1926 analog for 10-15% correction. Following turn date Nov 20 could be bottom. Also VIX close above 18.5 sets up bollinger band buy signal on next move down. A 20+ pt drop on Fri AM might be used to compress option premiums.
Wow. What a *weak* close. And remember, the triple-bottom is an animal that doesn’t exist.
Bow planes down 20º…
In other news, is the doomsday wheat trade here?
http://scharts.co/1vPHCJx
Not a trip-btm: http://screencast.com/t/RYtzyUKo
Nicholas – In John’s previous posts, he has discussed the markets in crash mode along with precious metals’ reversal. I completely agree with his view. Gold is very close to an intermediate cycle low here, before the next sell-off which I don’t see anytime soon, at least a few weeks from now. The manipulation by the big banks yesterday to run the stops on miners before the Fed minutes is just heinous imv. The big boys already bought miner stocks at major discounts.
The question is whether the big banks start selling off when gold hits resistance at 1240 or 1270, or let gold fly over 1300. My bet is a strong reversal from here. I myself have been accumulated JNUG below $10 the last couple of weeks.
Best of luck covering your short positions.
Interesting observation…
http://tfaat.blogspot.ca/2014/10/shemittah-shemitahshmitah.html
OTOH, techs looking the most short-term bullish this evening – http://screencast.com/t/YFesedrnr
Steve S, sorry to read this. I had a bit of more luck, messed up my last 3 trades though. In this turbulent market I prefer daytrading, but it’s difficult.
I wrote I expected to see a cycle low tomorrow in the US-markets (unlike André I’m not forecasting anything, just trying to find exit and entry-points and danger-spots); Le Hong Linh pointed out a few good reasons as to why to markets may take off. So I ques I will take again a long position tommorow. John posted a chart of all the important turns during the Equinox; a same chart with all the cyclical lows in october would make a person almost dazzle.
But I can assure you, I will be nervous, especially when the DAX tomorrow should break it’s neckline from the H&S-formation. Good luck with trading; Le Hong Linh, thanks for your info. I still don’t know if this will end like John expects, but the window is here and the markets respond accordingly.
Peter.
You will be fine Peter. If you like day trading , do this but it must be fit to your personality. David Williams, a psychiatrist and also the son of Larry Williams wrote a good book on the personality of winning traders, The Mental Edge in Trading. Otherwise, you not comfortable pls stay away. John preaching much about timing then I realized that day trading is not about everyday activities but timing as well. There is a few occasions of the year for doing it. Time to plant and time to harvest not only for long terms but also short ones. As a result, it released me from bondage of day trading slavery. Thank John
Peter, I scared when placing a buy SP500 at Asia opening. Forgive me, the only thing I wait is PPT. The Fed might send PPT to boots SP futures today. Friday after noon is a perfect time to do it. Europeans gone home and Americans pack for holiday. Low volume, big volatility. It pretty weird.
Firstly, to any one who had the foresight,
bravery and resilience to stay short following
yesterday, words fail me.
That is a degree of mental resilience I do not have,
in fact it’s difficult for me to even relate to,
very well done – and not quite sure how you guys
can do it.
I stayed in cash, largely through luck only.
Thanks phil. I bet there were a lot of us.
for me it’s just a matter of perspective. Daily action is only a wiggle.
The really weird thing i would like to accomplish is realize a long term capital gain on a 2x inverse etf. that would be pretty cool.
John, I was one of those who doubted your outlook
following yesterday’s price action, thinking yesterday
was key in undermining the bearish case.
That view now looks ridiculous, well done.
Thanks
Phil, I went long yesterday and short today, but I it was more of hunch than it had to do with bravery. John is the brave one the room, I’m a coward most of the time.
But there was one thing. In the AEX there are 3 heavyweigth stocks. The ‘big boys’ prop them during lunchtime when things don;t get their way – that is the AEX is in red or not green enough. Day after day, month after month the same trick, over and over again.
Guess what? Today the AEX was more than 1 percent up, they dumped the 3 musketeers in a few minutes time, erasing all the gains of the AEX. During lunch. That was a Big warning-sign for when Wall street opened the door. I immediately sold my longs Dow and went short and still messed partially up, ha!.
http://stockcharts.com/h-sc/ui?s=$NYA&p=M&yr=20&mn=0&dy=0&id=p00863994115&a=370147489&r=1412891418706&cmd=print
another index rolls over – 2007 immediate or 1998 intermediate? lol
http://stockcharts.com/h-sc/ui?s=$NYA&p=W&yr=2&mn=0&dy=0&id=t98743992394&r=1412891775039&cmd=print
I love your charts, BB-Elvis; looking bad and bad is good for John!
2nd that ……..TYVM
$BPENER (bullish percentage energy sector) drops to 6.82% today….Wow! For long term investors, it is time to accumulate…I like the big names. especially those dividend aristocrats.
“Another lesson I learned early is that there is nothing new
in Wall Street. There can’t be because speculation is as old as
the hills. Whatever happens in the stock market today has
happened before and will happen again”—-REMINISCENCES OF A STOCK OPERATOR.
wow…Newt sounds like a guy massively long energy stocks looking to get out…
John, Great post imo, you’ve addressed the ex-post cherry picking of markets issue very nicely, thank you.
Cheers
Dear John. The crash is obviously here. All the technical and geocosmic indicators point to an imminent breakdown in the stock markets.I have no doubt in my mind that we are witnessing history in the making, as the start of the historic crash will be either tomorrow or some time very very soon. I just want to take this opportunity to say thank you to you and all the great work you have been doing over the years, which is benefiting so many of us. Your work is top notch, and you have done it with class and resiliency. Much appreciated and hats off to you!
Your site has been my go to site since last year. Very soon we will be celebrating together as you mentioned in one of your previous posts.
I think it is overdue that your site should be a subscribing site, and I will be one of your first subscribers.
Regards,
Erick
Second all of that apart from the last sentence – shhhh, man! 😉
I second that emotion.
Appreciated, thanks
On another note for John, I will greatly appreciate it if you could update us of your exiting strategy when the waterfall selling erupts. I know you mentioned at least 18% before exiting, but just want to make sure I don’t overextend my stay in short positions. Many thanks.
2-8 weeks sharp selling, min 18%, and thereafter partial retrace of the falls over several months. So I will be looking to indicators to guide us as to when the initial falls are over.
Thank you John.
John Hampson,
Do you see any other form of decline, considering central bank interventions. Do you see a slow decline for next 4 to 6 months. There is no historic precedence, but 2007/2008 was a slow decline.
I think it has to be sharp, not slow, due to the prolonged levitation and indicator extremes
One of the weaker countries in Europe also matches the solarpeak,,,
https://pbs.twimg.com/media/Bzg_vOfCIAAJu6m.png:large
Portugal…
Lets put the recent declines into perspective. As some of you know im short SPX and remain short. Although after yesterdays pop almost closed out.
We are approaching my target that i stated some weeks ago of the 200sma on SPX. I think we will hit that and will be taking profits.
We have dropped less than 5% from ATH and you would think the world is coming to an end from the internet chatter. If you think the bull will rollover and die without a fight i think you may be underestimating what has happened in the last 2 years.
Im shortly expecting a strong rally but wont take out september’s high. Setting up a lower high then comes the plunge to take markets below SPX1800.
Duncan, I don’t believe that there are too many here that think the world is coming to an end, at least not yet anyway, I do however agree with you that we likely get at least one more rally.
There is however no denying that there have been several technical breakdowns in at least a few of the major indices, not least of which are NYSE and R2k, whilst the 50dma on the SPX which has been formidable support and the launch pad for reversals and new all-time highs appears to no longer be the case.
Taking a look at action of the SPX the last two weeks price was repelled no less than 6 times off the 50. That in and of itself is a signiicant change when taken into account with the breaking down of the NYSE and R2k which have been leading.
Yes there will likely I suspect, be another reasonable bounce of 50wma/200dma but it will as you suggest be another selling opportunity.
I have said it a couple of times the last few days. The Fed are no longer the principle driver of this market and will not be until QE4 is on the agenda, but that will be at much lower prices. Until then the Fed will take back stage to an imploding global GDP and declining earnings. The US will NOT be able to hold the rest of the world afloat or stay afloat by itself, any more than Germany can hold up Europe, as is being continually suggested.
The problem I have is being long at any point from here on because the bottom is so close to falling out of this market that any bounce we do get could trap even the most spritely short term bulls.
Not a very pretty chart if you are a bull either short med or long term………
http://stockcharts.com/h-sc/ui?s=$NYSE&p=W&b=5&g=0&id=p47206738604
That is possible, but according to Elliot Wave counts, we have been going down 1,2,1,2,1,2 and so soon will be a Big Collected wave 3 soon. Watch out.
Duncan, as you are aware the SPX can drop
nearly another 15% without violating most peoples
definition of a bull market.
Interesting to read your latest views.
The DAX is now within 4 pts of taking out the floor at 8900. That will open up the door to hell for Europe
http://stockcharts.com/h-sc/ui?s=$DAX&p=W&b=5&g=0&id=p23666268569
“Thar she blows”….
The DAX dropped nearly 60 points within a few minutes of taking out 8900 and weighing heavily on the FTSE. I don’t see how US indices will get any foothold whilst this is occurring.
I would be very careful entering any new longs on any index anywhere.
The FTSE, DAX and CAC are now down YTD ~ -6%, -7% and -5%, respectively.
What you say is what you get.
I think it now depends on when draghi unleashes full QE. It is inevitable unless he is happy for Europe to reenter recession. US markets have a lot more to fall though as john predicts but may bounce in the short term. 2015 will probably be a horrible year for US stocks!
Krish, be very careful. I can see European indices easily losing another 20% from here. There is huge amount of opposition toward Draghi unleashing further QE.
I am not saying it won’t happen, I’m saying it won’t happen until there there is unified cries for it. That will come when European indices are really hurting and in conjunction with US QE 4.
At that point gold takes out its all-time high and goes through 2.5 k within months.
Cheers
Good piece by Dr. Steenbarger:
http://traderfeed.blogspot.com/2014/10/making-sense-of-this-wtf-market.html
Thanks Gary, I really like that second chart.
Always interesting to see a fresh approach Gary.
The second chart (cumulative difference in the number of stocks closing above/below Bollinger Bands) appeals to me because I use them on a pip-range chart – but I take the opposite approach to Dr Steenbarger by buying when price has extended below the bottom band and then has sharply reversed back above it (Stochastic must confirm it).
That’s what got me into the Dow at 16685 a couple of days ago (and 16683 yesterday, but no gain there) – and I notice SP500 is now doing the same just under 1920. I haven’t bought that one though with the US session not yet open, and 1905/1900 possibly beckoning.
There are many ways to try to make a profit!
Where is Andre. His tides are out of sync, again!
Ilkka
He did originally say the 10th Oct but then changed to the 8th. I had the 8th all along which we can now confrimas wrong. It doesn’t work with any daily precision imho but I am looking for something that can give sentiment changes to within a few days. It may work for this purpose.
Regards,
Kerry
Andre is doing great job and he is getting better all the time.
Ilkka,
Just wait for my post tomorrow. I think I have something very interesting for all of you that will boost the quality of my forecast. Besides, the high on Monday was exact, the low on Wednesday was exact and the regular low in Europe was Friday. Most analysts give forecasts +/- 1 day. And none of them are 100% reliable. I am certainly not doing worse. If you think you can do better than me, please share so we all can learn some more.
Cheers,
André
That’s unfair. He did a good job. Use the dates as probabilities instead of certanties and you will thank him for that.
It also unfair, because I bought your book and as lot of predictions you made are wrong.
Tell that too every time you come up with your marketcycle.
Peter
I do use them as probabilities not certainties but the goal is to try and refine them. I am not having a go at Andre, he pointed me in the right direction and has been very helpful. I don’t think stating that someting didn’t work when tested in real time is being unfair – although the 10th may be a good call.
News flash – I get things wrong too, if I knew exactly what was going to happen I wouldn’t be posting this reply to you on this board.
My book talks about a top in 2011, a sell off thereafter and then a bounce and a fall into 2015/18. I thought we’d see a low in 2013, that was wrong. Although in hindsight you could say that 2/1/13 was a good low to buy. But this isn’t tradeabe hence the search goes on for something that narrows the range of possibilites. I am trying to find a shorter cycle that nests within my longer cycle.
I think Andre is onto something, I just don’t think you can use tides to call the market to the day. We’ll see.
ATB,
Kerry
You can look at the tides (I am looking at Provincetown and Battery Park) – the tidal extremes – as coming in over a 3 tide occurrence (tide before extreme, at extreme and after extreme). In this case the timing for a change in trend would be:
PT 10/8 11:43 am to 10/10 1:20 pm and BP 10/7 1:41 am to 10/10 4:04 am.
if this low holds, it’s happened within the tidal extremes. Next turn then would be between 10/15 8:16 am and 10/17 10:19 am.
Something that seems to work is using the high low tides as day trading indicator. High tides seem to repel price lower almost like the high tide is a positive charge and the price is also a positive charge. Low also positively charged but work from below pushing the price up. Will keep studying this, tho’ it seems to manifest every day. For ex, today the low of the day was exactly at high tide. Yesterday, the market fell thru high tide, and rose at the very end of day, low tide was at the close.
Hi Peggy,
I had 8th based on BP predicted high. But I now see that the H-L extremes was actually on the 10th (i.e. it differed from predicted tides models which is not that unusual).
As we are using the same station I have the same predicted high as you on 17th and shall be watching the range you have given.
GL,
Kerry
missing an ‘ís’ here
Point taken, Kerry. Let’s move on and hopefully we will find out one day how to use this gravity thing exactly. Closed al my shorts, and long on the DAX (tiny position, I am not convinced this will work out fine.
Gentlemen, I almost kicked myself when jumping into and interrupting you with a bunch of day trading ideas. I long Sp500 from Asia opening but scared out of it all the time and I squared now for a quick profit of 18 points . I just express my thanks to John by contributing something I knew well. Unlike all of you are expertise on a longer term my knowledge about FA from none to zero. Just 30 minutes after US market opens but I believe we have a high chance of a green day today for sp500. Anyway thank to John. The beauty is the way John deliveries with clearness, simplicity, cohesion for such difficult subjects. Close to Mar Faber one of top 3 FA guys according to Baron round tables for economists. He the guy I admired much before finding this blog but he made a wrong call for Sp crash in last Oct. I better not to bother all of you anymore. If you interested in day trading I glad to share mine with you , otherwise just ignore me. Have a good weekend and great holiday !
Le Hong Linh, our host John has provided a place for ALL ideas to flourish. That’s what makes this blog so unique.
Your contribution is equally welcomed. Whether anyone follows or not is a matter of choice for them.
Look forward to hearing more from you.
you have good stuff. and I like reading your comments. please continue to post them. I am interested in your daytrading startegies
LHL, what do you have for a daily TD Sequential count? We have broken below TDST support and so far as I can see (from tradetrekker.com) we are on Sequential Countdown (13). Do you see it the same way?
It has begun, I think. Only so many allowances you can reasonably make. Shit could get real from here. Elvis, I hope you have your fridge stocked.
http://scharts.co/1ED5Pb5
Rusty nosing beneath the ML as well: http://scharts.co/1ED6Kbf
FWIW – SPX 1905 is key for me
below that i see nothing but temporary bounces until 1575
KISS
the Volume Osc said more down and to the lower channel – the lower channel is now cutting through the 200ma
this is far from over even if it just goes sideways…
http://stockcharts.com/h-sc/ui?s=$NYUD&p=D&yr=0&mn=2&dy=19&id=p74556505902&a=367853694&listNum=1
http://stockcharts.com/h-sc/ui?s=$NYUD&p=D&yr=0&mn=2&dy=19&id=p74556505902&a=367853694&r=1412950824371&cmd=print
link for those without the evil stockcharts sub
http://stockcharts.com/h-sc/ui?s=$NYUD&p=D&yr=0&mn=7&dy=11&id=p68897809979&a=367854604&r=1412950989615&cmd=print
http://stockcharts.com/h-sc/ui?s=$NAHL:$NATOT&p=D&st=2014-03-14&en=today&id=t69062739299&a=369189956&r=1412951461285&cmd=print
again I say no bottom until this chart says
it never lies.
Can I ask when it will bottom? Or how deep it will go? Thanks
We will probably see the approximate low today or on Monday. Notice, that Estx50 didn’t touch his last support at 2974, while the DAX broke his support at 8900 very clearly and is now stabilizing. Take a look at T2108 on freestockcharts. The index appears to be near the point, where lows of the stock market were not far away – even in August 2011. The 200 dma (Dow) would be a suitable level for the low.
AD has broken the 125ema – not good
the monthly MA’s are flattening out – not good (signals a possible first wave bottom at around 1800
watch the nyud Osc – if it heads lower so will price. If it put in a higher low or rising bottom then likely things will heal a bit
http://stockcharts.com/h-sc/ui?s=$BPNYA&p=D&yr=0&mn=11&dy=0&id=p88394053313&a=367906801&r=1412953281074&cmd=print
breadth is stink as hell
notice on the nyud Osc that everytime price has bounced at the 200ma, the Osc has broken through the zero line – not this time…
I recognize you might very well be right. The situation is comparable to the first TD of August 2011. While the DAX had a big down day closing at the day’s low the DOW built a doji right above the 200 dma. T2108 has room for one big down week and the first week of August did make a difference indeed.
Le Hong Linh, my longs are gone; did not turn out well. That’s all in the game. Please keep posting. As for ‘my’ date october 10, bottom, the ‘never-lie’ chart of BB Elvis tells a different story and I would rather put my money on what I see than on a date. So instead of taking a long position, again, I stay on the sidelines for now.
NYSE 52 wk lows are skyrocketing this morn. Hidden crash already happening.
BIG warning. Its been 2 years since we have seen all three US indices simultaneously testing their 200 dma’s.
If they all break, IMO it gets very ugly very quickly and John’s waterfall decline is on.
theo may be right about a bounce off the 200 here for DOW but the set up is very similar to 2011 and the bounce limited to 16900ish
frankly I’ll be flabbergasted if this gets off the mat here
https://www.greedometer.com/day-2-drop/
a couple of guys I respect are in Theo’s camp and think a 2 week relief rally is coming…
BUT THAT CHART NEVER LIES! LOL
Hi Elvis, Mr Greedometer said the S&P would be like 1000 by now from his January charts. I respect him and his probability of a crash will be correct, but his timing has been WAY OFF and he has been making excuses and excuse. At least a year off…..As I always say…the market can remain irrationality longer than you can remain solvent….
well, there have plenty of mitigating circumstances for Jeff’s poor greed calls! lol
that said, there is a chance of a relief rally that shows some of the stupid enthusiasm of previous dip buying – my indicators are buying it yet – doesnt mean it cant happen so its best to be watchful and nimble!
as of now though this is just a retest of broken support
No circumstances. Everything has been according to plan, FED tapering, ECB not printing, etc. margin debt unwinding, overseas issues, etc. His greedometer machine needs to take into effect irrationality. That has been market dynamic since inception. If that market went by fundamentals, would be flat for decades…lol. You can predict market probability, but you can’t predict it’s timing. If so, you should be in vegas.
There is no economic reason, nor valuation reason for believing the markets should be bouncing off a technical level, whereas these could have been arguable in the last few years. I think traders will ultimately decide to not buy this dip.
Just have to LMAO. The Fed plunge protection team is on full force since the market open, buying back shares and trying to stop a Friday crash. They can stretch this correction a few more days, but simply can’t stop it from happening.
Strong reversals on miners. I think the intermediate cycle bottom for gold is in.
Erick, ref living in history in the making. Is it possible that we are in a crash so soon after 2008-9? It is unlikely, but I am betting the long odds as John has shown the unlikely is probable? One definitely needs a patten to trade on, as the easy mistake to make now, is after getting beat up all year, the tendency is to take the small profit we finally have and watch as it turns into a huge opportunity lost. Puetz has shown crashes start on a new moon and the first leg down goes down to the next new moon – Sep 24 to Oct 23 (also a solar eclipse). Then it rallies to the full moon – Nov 6. Then a 4 to 6 week crash. The first leg is @ 10 to 20% ie @ 15,000 Dow and 1700 S&P. That is a 6 week topping pattern, looks like an Elliott 1-2. Out of 15 crash topping patterns he lists, 8 were 6 weeks, 3 were 10 weeks, 1 was 4 weeks, and 3 were 0 weeks. Unlikely, but some patterns to judge the coming market action.
Kent. I don’t believe in the flash crash mode either. But no doubt we are currently in the beginning phase of the crash mode. Puetz pattern makes a lot of sense, and it is quite rhyming with my EW count. What I believe is a deep sell off to start next week, which might take SPX to its 50% retracement level of 1850, then there might be a weak rally to a slightly higher highs complete the intermediate cycle low, before a real crash later this month, or early November.
From my perspective, John’s scenario is playing out perfectly. It is not a question of IF the market will crash. It is a question of “WHEN”.
I think we are experiencing something similar to September 2000 when the sell-off began, and didn’t complete until Sep 2001. Similarly, todaymarkets don’t need any catalyst to start the crash right now, but the final nail on the coffin might not be in until September 2015 when the Shemita year ends.
You will have dip buyers here as this has been
the winning strategy for the last 3 years.
In stock market terms that is a lifetime for most.
As the saying goes, something keeps working until
it doesn’t
Just checking the SPOOS 15 min chart. We had that break of the double bottom from last Thursdays low and Wednesdays low earlier this morning at around 1925 dropped to 1912 and appear to be back testing resistance and that break now.
If itcan’t overcome that area by the close I hypothesise that Monday we head back down and this time break the 200 amd head for 1870 the target area for the double bottom break and also support going back to May.
Everyone is expecting a bottom around here and a rally to ATH, then the big drop. Thus, we will have a big drop now, then to ATH’s. That’s how the market makers work.
I can’t say I disagree with that entirely. i just don’t think we see ATH’s.
And the hourly SPX chart is beginning to look bearish so that above scenario I just added looks more and more likely.
Allan, you made some fine observations (check out the hourly Dow, all the same candels, price being rejected again); your hypotheses is very plausible.The nice thing of all the indexes breaking down at the same time, including the DAX, is that any rally from here, be it two weeks or two months, has a far greater probablity of being the last.
Mate if I were still trading futures I would be adding ES shorts right here.
yes, shorts are probably called for here but a tight stop on those as well as the pattern on SPX could bounce to 1950ish.
I’d put my stop at 1937
That’s too risky for my trading style. But I did put on shorts on Facebook a few minutes ago. I wish I had John’s guts + his conviction. But I do know that I will enter again a big short position on the DAX since the H&S is active now. I want to thank all the posters here today. I learn a lo from all of you, helps me to keep things in perspective.
the one chart that NEVER LIES is saying more downside…so….
lol
once thing to consider is that if SPX cannot break the 150ma this rally attempt is toast for now
http://stockcharts.com/h-sc/ui?s=$SPX&p=D&st=2014-06-14&en=today&id=t79927564224&a=369529410&r=1412964257678&cmd=print
Kent, just read your post. Did not now there was a pattern involved.
I have a medium crash cycle coming up november 4. So that fits.
1850 soon
Let’s work on 1900 first 🙂
Ditto. 1850 is the minimum before a potential bounce I think.
!!!!!!!!!!!!!!!!!!!!!!!!!!!!!:0
so here is the number two chart that never lies, but sometimes it omits things, lol
http://stockcharts.com/h-sc/ui?s=$NYUD&p=D&st=2014-04-28&en=2014-10-10&id=t72327952050&a=367854604&r=1412952236772&cmd=print
the Vol OsC (macd on the NYUD) needs to start heading down and for a real major selloff to occur it needs to put in a lower low. As of now it is turning down so it isnt confirming any sort of potential rally here.
In order to be in completely full crash mode, imv it requires the SPX to drop below 1736 before this current cycle bottom. It might take us a few weeks to get there, but eventually we will.
I’m becoming convinced by the completely degraded internals that this could fly apart like the red neck self-destructing washer machine YouTubes! very funny and wired videos by the way. Red neck rural half case entertainment!
BBE, I’m wiff ya. What long in their right mind would hold over the weekend? Very interesting last half hour coming up.
yehaw the buzzsaw!
IWM weekly FTW – http://scharts.co/1mmbf0o
6 more SPX points and we have the setup for a monday crash
flash crash in 10 minutes of less! WCCG for everyone, all weekend long!
ndx is breaking important support
vix went nuts
Haha, I may not have been able to short at the point I mentioned earlier but I added more TVIX anyway at 3.44…….I know I shouldn’t boast but its been a while coming so what the hell. Very very interesting Monday coming up.
Yes it did – and also note that on a close-only basis, we are already below August on SPX – http://scharts.co/1vRPQ3C
Sell-off today was a lot more powerful than I had anticipated. I thought today would be a whipsawing phase which then preludes to the bloodbath next week. The bulls actually gave up quite easily. One thing I guessed wrong is the gold miner reversal. Considering the potential bloodbath next week, miners might be sold off as well, despite the fact that miners have bottomed out.
Kudos again to John and his followers.
There are no certainties in market timing,
there are probabilities.
John H utilises a near exhaustive range of indicators
to reach his view, and is humble enough
to strongly suggest an outcome, rather than state it as a fact.
Those looking for some magical certainty are highly
likely to embark on a never ending search for something that
never has existed, or ever will.
Well done the bears, fantastic week.
WT’s view from earlier today rings true for me –
this time it appears traders will ultimately decide not
to buy this dip.
On Wednesday’s US close
I would have strongly disagreed with that view.
Indeed. You can never time a market, but you can base a likely outcome on indicators. That’s why I laugh at that greedometer machine which has been retracting it’s calls for the past year…..The market can remain irrational longer than you can remain solvent. Best quote all time.
Greedometer did some heavy buying toda:
After 10 months of going short, he is strategically going long short term…what a putz. He is gartman Jr.
Today’s ugly day was “supposed” to happen on Wed Oct 8, but again matched up two days later just like the previous Sep 30 anticipated ugly day (turned out to be an up day) which happened two days later Oct 2. The only unfortunate thing is that I timed it too precisely with some short term options that got liquidated away on Oct 8 Fed rally and missed out on a sizable gain.
Anyways, the prices have hit almost to the bottom of the “death spiral” range and in fact in after hours it has pretty much touched it. The fractal indicates it does not crash next week but instead does a 61.8% Fibonacci retrace early next week only to have one more final down leg into mid-week (Oct 15/16?) for a slightly lower low than today Oct 10. It should be about 1.2% lower than today.
I am actually net long heading into next week but obviously have an uneasy feeling in my stomach if it spirals out of control right out of the gate Monday Oct 13. If the market does indeed crash on Mon or Tue then I tip my hate to Mr. John Hampson
Monthly ephemeris has moon in leo on thursday, almost every month market goes down 1 to 3 % the eight days after moon in leo (I have no idea why it just back tests across all time frames). I would guess selling to begin Thursday morning or if it begins monday will continue thru to the next week at least.
Thanks Steve S. I checked http://www.myastrology.net/ast-bin/ephemeris.cgi but it shows Moon in Leo on 17th Oct and 18th Oct and 8 days after 18th is 24th Oct for 1-3% down side?
Further to my post earlier today i have had a change of view of the short term for SPX. Ive added a heavy short position before the close at SPX1901.
I no longer believe the 200sma will provide support and now believe we will slice through it like a hot knife thru butter. I remember John once talked about the significance of a monday panic event. The theory is that investors have the weekend to look at their portfolios and decide to sell first thing on Monday. I believe we are all days away from congratulating John on a superb call.
Agreed with you wholeheartedly Duncan. Good calls! Another reason for Monday panic after heavy sell-off the prior Thursday and Friday is the change in human sentiment over the weekend. In addition, margin calls on Monday would also be one of the catalysts imho.
I am confident that at minimum, the SPX 50% retracement of 1850 will be taken out sooner than later.
So they have the weekend to look at their 5% retraction this month, after a 200% rally since 2009? I think it’s more relevant when that 5 turns into 20% +…….
27 day space weather predicting more bad news for the market after 10/14 – most intense 10/21 – 24
feer and greedindex at 1 highest reading! cboe put/call ratio closed at 0.87 very high, so I reckon a bit of weakness on Monday to get even more folks short then a big rally, 1956-76
The Nikkei has now “swung high” on a weekly chart with YEN also “swinging low” on weekly.
It’s pretty rare “not to see” at least another week ( or even 3 or 4 in many cases ) lower after such a move.
If the bulls were to make a stand, Monday is the day to do it (200 DMA hit and all that). If they can’t then the odds of a crash heighten considerably imho.
A nice LT weekly view of where things stand –
http://charts.stocktwits.net/production/original_27853661.jpg?1413028707
Slater9, where do things stand now on your charts?
rut
http://stockcharts.com/h-sc/ui?s=$RUT&p=D&yr=1&mn=4&dy=18&id=t56576227594&a=274022664&r=1413036355056&cmd=print
spx
http://stockcharts.com/h-sc/ui?s=$SPX&p=D&yr=0&mn=7&dy=19&id=t46453644567&a=346660652&r=1413036508400&cmd=print
INDU-note//on Friday. while the rut and spx broke line support
the indu only traded to minimum target completing abcd into 382/447
box… also marked on chart is expanded abcd to line… which would allow all three indexes to align…
http://stockcharts.com/h-sc/ui?s=$INDU&p=60&yr=0&mn=10&dy=24&id=t37426528935&a=341905337&r=1413036912022&cmd=print
Slater can u please repost ur charts….ty
I think 10/10 low and rally into 10/15 high
Care to explain how you arrived at your dates SL ?
And lastly to John, excellent work – congratulations on not swaying from your thesis despite the naysayers and the time passed. It hasn’t been easy, I know.
Thanks Gary
I went over things today and I see no reason to change my original targets from yesterday.
I think the SPX heads to the May congestion zone and hits 1870 , the target from the double bottom break on the 15min yesterday. It then bounces, probably back to test the 200dma and then, excuse the expression, the a#* drops out of the market.
http://jayonthemarkets.com/
Mr. Seasonal Trends in the Stock Market (Wiley Books) says based upon the last 80 years October to December of the mid term year is one of the best times to be in the DJIA.
Although this may not be accurate going forward because most of the middle years of previous decades were during solar increase and due to the extended solar minimum this coincidence may have ended.
Fasten your seat belts Monday?,
or may be too much of a consensus view already.
What struck me on Friday was the almost immediate
selling of any even small advance.
I like tony caldaro’s pragmatic approach. He’s looking for either 1738, 1627 or 1560 on the spx before we have a rally to new highs.
http://www.marketoracle.co.uk/Article47708.html
Karl345345, a year ago this pattern would have coincided perfectly with John’s call for a bullish overthrow out of a LT consolidation pattern, a correction (wave 4) before wave 5. However, when demographics are considered the end of the bull is now. Is there an alternative EWT count that would see the move this year as an ending wave 5?
True but as I read it he expects the wave down to unfold as a ABC with the end of wave A closer to 1850 followed by a rise to something like 1965 before it concludes at the numbers you reference.
Thanks for your work John.
Will Monday be the down day you have been predicting?
Six yrs after Lehman US and UK play out next financial crisis:
http://www.theguardian.com/business/2014/oct/11/lehman-crash-play-financial-crisi-war-game
“The top financial brass from the Treasuries and central banks of Britain and the US are to take part in a war game, behind closed doors in Washington on Monday, to test how they would handle another Lehman Brothers-style banking crisis …
The war game is designed to stress-test the new domestic and global rules for regulating and supervising banks devised since 2008…
The chancellor said Monday’s event would try to pack into a morning a crisis that would unfold over several days.”
See new post
I must say the bears are very smug and self satisfied this week, especially on this Board…you know who are…
Actually, Dave, the bears feel nothing of the sort. They realize that over the long term betting markets will fall is a losing bet. So it’s only after in depth analysis and an unemotional appraisal of the facts, that a judgment is rendered. It may be wrong, but it won’t be because of smugness nor self-satisfaction, believe me.
Thanks to all – new post is out