

Ask 100 analysts and traders what that is, and chances are that not one of them will point to this:
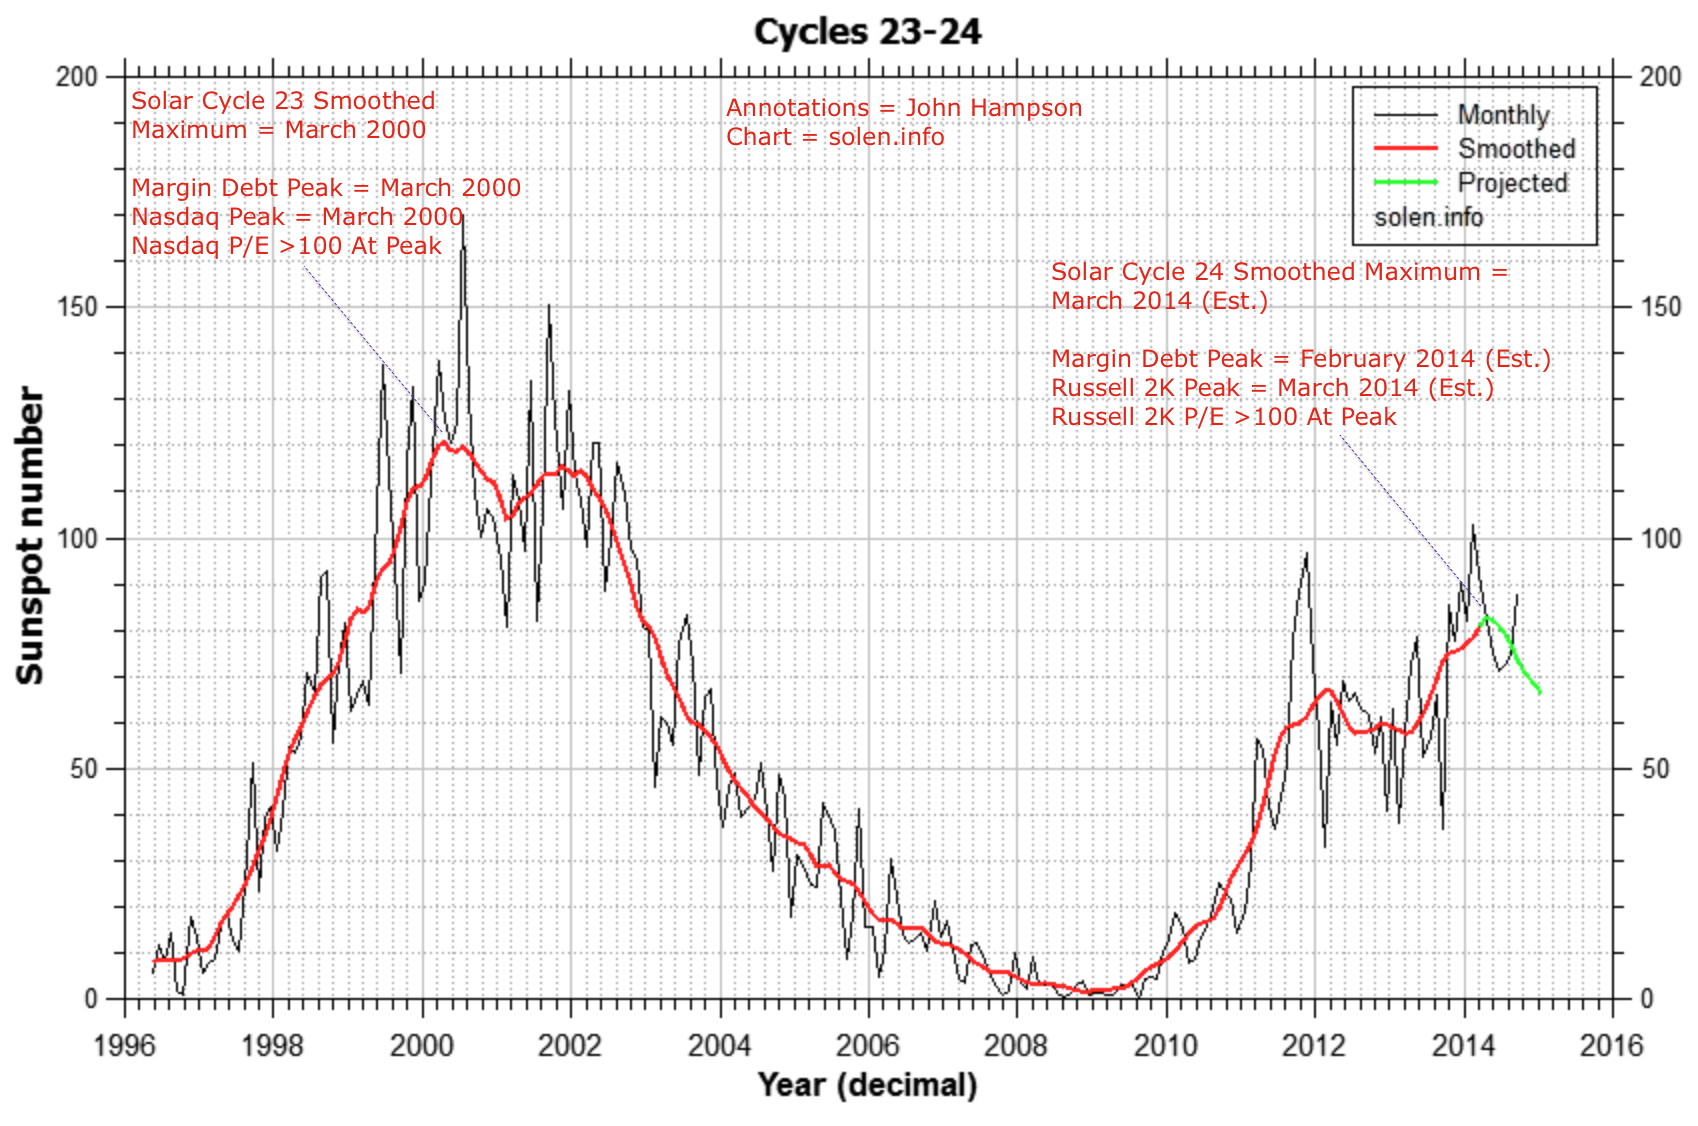 Yet I maintain that this is it. The last 5 solar cycles all produced speculative peaks within 5 months of the smoothed solar maximum, and in this era of global, instant access, it seemed reasonable to expect something similarly tight at this peak, which, in this real time test, appears to be the case. We see evidence that small caps were the main speculative target of this solar max, with the R2K p/e reaching over 100 at the top, like the Nikkei did in 1989 and the Nasdaq in 2000. We won’t know all this for sure for several more months, but with each month that passes the likelihood grows.
So am I delusional, or are other analysts failing? I am open to both possibilities and I mean that sincerely: I am just one self-taught guy, so how come all the veterans in the business aren’t aware of this phenomenon or don’t rate it?
I have doubters amongst you readers too. However, for the chart to be invalidated, we would need to see small caps and leverage make new highs whilst the solar maximum wanes. That would imply the 2014 formation in the R2K is not a topping process but a consolidation or coiling for a move higher. Chances of that are slim:

Source: ShortSideOfLong

Source: WSJ
The topping option gains further weight when we look at relative performance to large caps:
 Source: Charlie Bilello
Plus, many topping indicators for equities have congregated since the end of 2013, which I have covered exhaustively on this site. And to be clear, if small caps break down then large caps will follow, in line with history.
There is still a question mark over whether the smoothed solar maximum is definitely behind us, but the majority of solar models predict so. Therefore, as things stand, we have pretty good evidence of a speculative mania in the markets centred on a particular asset class or index topping out very close to the solar smoothed maximum, just like in 2000 (Nasdaq) and 1989 (Nikkei, 5 months after smoothed solar max) and 1980 (gold, 1 month after smoothed solar max).
Going back to the title of this post, I believe the most popular answer amongst analysts for ‘the only chart that matters’ would be the QE versus stocks chart, but in a recent post (here) I instead showed that ‘Fed policy trumps all’ has been the mantra rather than the driver, just as into the year 2000 internet stocks were ‘revalued’ on expectations rather than earnings. In other words, the speculative mania is driven by the influence of the sun but people unwittingly assign some other justification for buying high: a ‘new normal’ which ultimately fails to be.
As stock indices were down for September, we can expect that margin debt retreated in that month, which keeps the leverage peak close to the smoothed solar max. If the R2K can break down decisively here in October – and it is currently at the critical last support – then it would likely seal the joint solar/speculation peak around March time. Should that occur, then the implications are major, namely that much of what is written about the markets is not true, and that humans, including central bank members, are more dumb subjects and less intelligent creatures of free will. But more on these implications once we have the validation seal.
It wasn’t easy trading this in real time, trying to gauge where both the speculation peak and the smoothed solar maximum fell. With both variables unknowable in advance it has been a process of cross-referencing and leaning on prediction probabilities, only made more certain with hindsight. Nonetheless, in trying to gauge the peak in the markets, there appears to have been no more critical factor to consider. However, we now need the decisive breakdown in equities to confirm it.
In the very short term, indicators still point to the bounce Thursday-Monday being short-lived and giving way to a lower low than last week. So, per my last post, this would likely entail the Russell 2000 making a decisive break beneath the last line of support. If this transpires then the selling should gain momentum and that would be the validation seal that I am looking for.

Thanks John for your insightful information. I think you are spot on.
Keep on the good work!
Herbert
Thanks Herbert
John,
Thanks for the excellant research. Do you have any alternative decline approach than 20 percent decline in 8 weeks. Are you thinking it might be 20 percent in over 6 months slow process of decline. This is so that we position out puts accordingly. Do you think if we dont start declining by oct, Nov/dec market may turn up rather than down. I got some nov put spreads and wanted to see how best to handle it.
My alternative is for a second chance peak still to come, circa Dec 31. So something like a 15% decline here, then back up for a lower high at year end. But my higher probability case is for the heavy selling to erupt here and the put us in a bear.
Thanks for continuing to update us with your thoughts, John. Clearly RUT has agreed with you all along. Would you please add a link here to your longer term view (I’m sure you’ve posted it many times but I’ve lost track of it). tia
Longer term view on what Peggy?
longer term view on the stock market after this decline of 15-20% (either with the low in the first 8 wk time period or with the 2nd chance end of the year high scenerio you mention). tia
I’m thinking that you are expecting a low near the projected sunspot low in the summer of 2020?
2-8 weeks of hard falls, then a 3-4 month partial retrace of the falls, then a long deflationary bear like Japan post 1989 or post 1937 US or Nasdaq post 2000. A secular gold peak and potential stocks bottom at the next solar max circa 2025.
thank you
Great Work. As per my calculations we will see another upward move in sunpots (May be nearing current solar max readings) in Dec so from 10/12th Oct onwards dnward move & in Dec we could see another upmove (May be to make a lower top in world mkts)
Thanks
No need to convince me John, I’ve pretty much been convinced that we were topping late last year, your research has definitely sealed the deal for me though and kept the doubt at bay.
That first chart can not be denied, but, you will always get people that refuse to believe anything despite how much supporting evidence there is.
That said, you have opened my eyes to a whole new analytic tool and for that I thank immensely.
” you will always get people that refuse to believe anything despite how much supporting evidence there is.”… oh really, and how about all those people predicticting doom and gloom for the last year and a half despite the Dow and S&P going up and up and up…? I’m surprised you guys still have any money in your trading accounts after having your shorts stopped repeatedly for a year.
lemmi, my aim, like most here, is not to ride the market right to the top, nor is the expectation that I am going to pick the EXACT top.
My aim is to position myself to reduce risk as much as possible by identifying when a market is overstretched due to investor complacency, over exuberence, technical indicators etc which is now supported by John’s work.
As for being short, I have not been short for many months, deciding not to enter any short positions due to the risk of choppy action which can be the hallmark of topping action. You can go back and check this if you wish.
I have recently begun taking long positions in the VIX via etf’s and was actually short the VIX a few weeks ago for brief period. I have of course also been long gold stocks, at one point being up substantially but am now slightly down but I am not phased by it and I am continuing to accumulate gold stocks and am long VIX still.
I will be increasing all those positions on a further break down in the broader markets.
My last point to yourself would be to study how markets have behaved in recent months. European indices are well off their highs, the R2k reached its speculative peak months ago and now all tha remains is for the major indices to follow through. Signs are everywhere.
I reiterate, it is not my aim to pick the exact top or bottom of a market. It is my aim to reduce risk at extremes and position against the overwhelming bullishness or bearishness that marks imminent long term reversals.
I like John, who has provided empirical evidence to support the fact, believe we are at one such point.
lemmi, I know John is more than capable of defending himself but a bit of supoort never hurts. He has all but nailed the speculative peak. The speculative bubble was in the R2k. That bubble burst months ago.
This chrart is going back well in to triple digits, it will drag the other indices with it.
http://stockcharts.com/h-sc/ui?s=$RUT&p=D&yr=1&mn=0&dy=0&id=p15096742438
Nicely written, Allan.
Thanks Allan
if your shorts were primarily in the Russell, you’d be in profits.
Reblogged this on thedarklordblog and commented:
Exceptional work that deserves reward IMVHO.
Cheers TDL
The weight of evidence continues to build. Major European indices with golden crosses in past weeks and continuing to break lower also breaking lower trend lines that were in place for nearly three years since the 2011 lows, DAX also sporting a major potential head and shoulders that looks certain to break lower, R2K making new lows and leading other US indices, along with all time lows in complacency…….no need to go on because I am sure most are aware of the negatives, but as the case at major tops,denial is at extremes and investors refuse to accept that now is the time and that markets are rolling over.
I still believe that the run up in the dollar and the trashing of gold and gold stocks was largely engineered by big money to take advantage of bearishness in one and bullishness in the other so that they can position themselves accordingly.
There are going to be huge reversals in both.
And some positive RSi divergence on the gold drop would support this
Thanks John,
I think you are so right.
But I also believe the markets are well understood and monitored by the goverment and central bankers so they will keep manipulating everything what ever is possible..
I think tomorrow we will see a low and another rally after Yellen speeks again..
After that things will get very interesting when the selling continues again (turning the tides)..
So I am watching the times frames 8-9 Okt …16-25 Okt and most important 29 Okt till 6-7 November after that we will see the markets climbing up again…
Cheers Carpediem
It should be borne in mind that he first chart above shows only one completed solar cycle, out of 23 for which we have contemporaneous sunspot records, and even more where we have indirect but detailed magnetic records. The green “projected” line has been dangling off the end of this chart for at least two years – here’s an example from about a year ago: https://solarcycles.files.wordpress.com/2014/04/20ap5.png
With all this solar data readily available, why restrict an analysis to only the last five cycles?
I have covered earlier solar cycles. But I draw the line at 1800s solar cycles, because of the markets side of the equation. Ultimately I think recent cycles (instant, global era) are more relevant than lower amplitude cycles, and I believe developments in 2014 are supporting that.
HI Mark, to support John’s point, before 1900s, the data is hard to find, especially price data. There are some examples, such as the 1789 Great French Revolution or the 1836 England Crisis. I find that the crash window increases in standard deviation as well, to about 1 year.
I maintain – and this will not surprise you guys – that adding gravity to the mix will help in timing. One subject of this site is ‘the lunar edge’; and there is one. But in the analysis it is missing.
The lunar trend gave the low by the end of 2008 and has been up ever since. This is – imvho- the lunar edge that should be taken into account. The FED is NOT the cause of this market action; it is merely a symptom of this ending phase of a multi year cycle. It was gravity that gave the uptrend.
Gravity says we are close to the end of this cycle; same as John says.
My tides – also part of the lunar edge – indicate that the turn over is between mid October and mid November.
I personally still need to see a chart showing a correlation, from any of the gravity advocates on the board. Without that I can’t get started with gravity. I have the open mind, but I really could use that chart.
I’ll do my best to produce one, I’ll do anything to win you over. Not for me; but because I think the combination of solar and lunar analysis is the best there is and the only thing you need.
Just keep that open mind; that is enough for now.
Cheers,
André
I believe John agrees with you and has pointed out that the Fed and QE are not the cause of the rally (he says this in this very post) but rather the reason that the sheeple are using to convince themselves that “this time really is different”. I also agree with this. The Fed doing what it’s doing is one of the results–not the cause–of whatever it is that is fueling the speculative mania. You say it’s gravity, John says its solar activity, others say it’s the planets, still others have no idea but attribute it to cycles in collective human emotion, cycles in the herd mentality.
John, I doubt anyone reading solarcycles thinks
you are delusional, you strike me as very rational.
It does not automatically follow that your views
will be validated, timing is exceptionally difficult.
Big couple of days for the bears I think,
right here.
Thanks. Not getting ahead of myself, but the irrefutable validation (or invalidation) is still some months away. In the meantime, we’ve had 6 months since March that have honoured it, so the case is increasing.
John, although I’m a supporter of your views and I find your blog very interesting the answer to your question is twofold.
1) The evidence that solarcycles influence human behavior via geomagnetism is weak at best.
2) The result of a properly conducted test of the relationship between smoothed solar maxima and speculative peaks would likely show weak statistical significance.
Playing devil’s advocate I’d ask why 2007 topped without a solar maximum in sight. I’d like to know the probability that a smoothed solar maximum occurs within 5 months of a market’s speculative peak if we assume no relationship – accepting that the specific market is chosen with hindsight.
I find that the Bradley turn dates to be significant at a 6% level (one-tailed test). Does that help?
It sounds interesting, yes. Are you able to provide a brief description as to how you conducted the test?
You got your Bayesian reversed. P(Crash | Solar Max). not P(Solar Max | Crash).
John(ntj), i question whether 2007 was a speculative peak or just another correction, black swan event, following the dot com bubble which I think to be the case.
This time around the R2k was, no doubt in my mind, in a speculative bubble similar to the dot com bubble, Nikkie bubble and so forth.
I have said all along that comparisons to 2007/08 are dissimilar and that past comparisons are more in line with John’s analysis of speculative bubbles.
Maybe. Personally I find it unconvincing if one has to start quibbling over what is, or is not, a speculative peak to support the hypothesis. Note also that R2k is being chosen ex-post i.e., we note a solar max and then a market is chosen that exhibits an as yet undefined speculative peak from perhaps a pool of 10 markets and we say, “see, there it is!”.
Yes, it would very difficult to be rigorous about it. Perhaps just 10 solar cycles with reliable market history. No solid agreement in the scientific community about solar influences. But should we therefore ignore it – what if it’s the most influential thing for the markets? The tentative evidence suggests it may well be. The best test we can do is the current one: armed with the theory, does the market top tightly with sunspots at the next (current) max? And it appears to be doing.
2007 was European and Chinese demographic peaks. There are overarching demographic peaks and solar peaks. But alternating bull and bear legs at shorter intervals within those are not incompatible. It’s not whether every market peak is solar max, but whether every solar max is a market peak.
Why don’t you do a properly conducted study to show the probabilities and correlations and then share it for free? I would be interested to see what you find.
Let me know when it’s ready. In the mean time I’ll be watching some cartoons.
Watching cartoons? Sounds like it…
WT, as John mentioned, we get 10 datapoints per century, and markets were not free before the 1900s — influenced by wars and insiders. To generate statistics, I already offered my results on Bradley turndates which has several hundred datapoints. The p-value is 6% and certainly not significant at 99% confidence level etc., but good for most of us in the real world of trading. Science cannot predict markets with certainty because markets are self-referencing;
However, I am quite sure that if I do find something at 99%, academics would say if that was true, someone would have snatched up that $100 bill. Therefore, don’t pick up any money at all on the street.
If you don’t like the pre-1900 data, have you any thoughts on the 1920s and 1950s (solar cycles 16 and 19) and what happened in the markets then?
Mark,
Unlike John, I have a wider window around the solar max where the markets could crash — and I think humans can shift the date for a year or two. I maintain that we could have seen a crash in 2013 if we had tapered back then…
The 1920s looks like this cycle, which is a frustrating twin peak over several years. We had a 1926 Florida real estate bubble which burst before the solar max around 1928, and then the stock bubble which burst late in 1929. This is similar to the Gold/Europe bust in 2011, the current solar max passing in 2013 (measured by polar inversion or middle of the twin peaks), and us waiting still for the elusive market peak.
The 1958 solar max is an abnormal. I cannot a bubble that truly peaked around that date. P/E ratios were reasonable, and hopefully, there are other tools that indicated that it was not a crazy bubble at that time. The peak if any, is very late:
“The Kennedy Slide of 1962, also known as the Flash Crash of 1962, is the term given to the stock market decline from December 1961 to June 1962 during the Presidential term of John F. Kennedy. After the market experienced decades of growth since the Wall Street Crash of 1929, the stock market peaked during the end of 1961 and plummeted during the first half of 1962. During this period, the S&P 500 declined 22.5%, and the stock market did not experience a stable recovery until after the end of the Cuban missile crisis. The Dow Jones Industrial Average fell 5.7%, down 34.95, the second-largest point decline then on record.[1]”
The 1873 crash is another example where the bubble kept going for 2 years past the solar max.
The other times I am missing satisfaction is during world wars, but that is understandable.
Unfortunately, I am without luck other than to draw a confidence interval at measures of the solar max date.
Will cover the last 100 years of solar cycles and their relations with the markets again in another post
Please WT will you find yourself somewhere else to go….watching cartoons shows your mental age. Good Bye and Thanks for going.
Cartoons are satirical as was my comment. Look closer.
Couldn’t agree more purvez.
You want me to cease reading and commenting on my favorite daily blog from my favorite economic forecaster. Are you sure you are not confusing me with someone else? Or misinterpreting the flow?
WT, not at all. Sorry the satire was missed by me. Apologies
Thanks.
WT I seem to have misinterpreted the flow. I thought your second comment about watching cartoons whilst waiting for John’s report was meant as a derisory remark. Thats the way it read to me.
Let’s not forget we have 2 major bradley turns tomorrow and Oktober 16
They are double (helio en geo) so what I mentioned earlier tomorrow Yellen will pet the markets again (she has to stay populair and wants to keep her job).
That will trigger the relief rally for a week ( for other reasons) same happend in 1929 after the first hit relief rally also 1987… after that things have to get very ugly…otherwise I believe we will continue the uptrend…
I appreciate this may be a little left field folks,
however it may be worth watching how ebola
develops.
The German data was dire today, The IMF downgrades
global growth once again.
My own take is that the mood music is beginning to change,
(this may be temporary).
Yes, Ebola could get scary as it mutates. It seems so remote that none of that is priced in. A non-doomsday scenario where we go through 5 minutes extra of checks at airports would already subtract from GDP.
I don’t believe that Ebola will mutate to the point where it becomes airborne amdI also doubt that even if it reaches more developed countries thatit would pose anywhere near the risk that it dose in African nations.
It has been proved that even basic medical treatment such as IV to prevent dehydration improves recovery rates dramatically.
The problem lies in the lack of meical treament facilities in the countries affected as well as the lack of public information and speed with which those tjat become infected are able to access treatment, if it all.
There is as usual so much scare mongering on the internet about this outbreak that people are misunderstanding the threat. The threat is to third and second world countries, not to first world developed countries with a high standard of medical care.
More people died from Ebola than 9/11 — so it is not about the death numbers.
I don’t believe it will kill more than thousands currently too. But the tail risk will change public policy, add to medical costs, which will slow GDP.
Andre’ imagine there is no gravity, it is easy if you try. Only electrical magnetism pulling from the sky. You may say that it is impossible that sunspots and solar output increase gravity, it is entirely possible tho’ if you replace the word gravity with electromagnetic effect. (The Electric Universe Theory). Thank you for sharing your information on tides.
EU is the way forward. Lots of great work taking place in that community. Check out the “suspicious0bservers” YouTube channel, if you have not already.
One question for André that occurs, that I hope will be taken in the constructive spirit it is meant: you have said in the past that some tidal stations produce poor results, whereas other produce better results (GIGO); it would seem to me in an age where many U.S. equity market participants are scattered across that country and indeed even abroad (like many of us here), why would gravity at any one place be more significant than any other i.e. are you just being “fooled by randomness”?
Ultra909,
It is not so much about place. It is just that tidal stations are not built to give gravity, but to give local tides. So one station has a lot more adjustments than another. I have tested many stations just on correlation with the market. And I can tell from experience that some stations do a better job than others. Although I don’t know exactly how that can be, I suspect it has to do with the adjustments that are needed to account for local circumstances. The less adjustments, the closer we stay to pure gravity.
Gravity is a powerful force. And the earth spins fast. So when the moon comes closer we all feel that.
Hope this answers your question.
Cheers,
André
Some interesting comments here on different tidal periods and heights from the people who came up with the tidal adjustments (UK Hydrographic Office, or “Admiralty”): http://www.visitmyharbour.com/articles/3144/tides-and-the-causes-of-tides-a-primer
“The rise or fall does not occur simultaneously over the surface of an ocean or sea, but appears to radiate outwards some central part in the ocean or sea, as does the ripple caused by a stone thrown into a pond”
” In fact, the manner in which the tides rise and fall in different seas and oceans varies considerably; the period of oscillation of the tide in one area differs from that in another and varies from about 6 to 24 hours. Oscillation of about 24 hours, called a diurnal (or daily) tide, result in both one high water and one low water a day; one of about 12 hours. A semi-diurnal (or half daily) tide would result in two high waters or two low waters a day (most of the UK). A six hour period would result in four high and four low waters a day”
Mark,
I use 2 stations near the US and one near Europe. When I compensate for the time zone, the intraday timing of highs and lows is remarkably close; sometimes within minutes. So maybe I’m not an expert in theoretical aspects of tides, I know what I see.
Steve;
If there was a way to predict the electromagnetic effect I would certainly take a look at it. But I’m not sure there is. And that’s the big advantage of gravity; it is predictable.
Cheers,
André
You called this turn, right on the money,. go Andre !!!!
From now on; you can count on that 😉
Lots of good stuff today.
John Hampson looking for waterfall declines perhaps soon
Randy Phinney says the SPY and QQQ bounce is likely over
Kwave at Traders Talk says a trap door could open on the SPX soon
Tim Knight says he has never seen so many great short set ups
Even The Fly says this market is toast
And i’m gonna extend my crash window a day (10/2 – 10/13)
http://rightsideofthechart.com/spy-qqq-bounce-likely-over/
http://www.traders-talk.com/mb2/index.php?showtopic=156558
http://slopeofhope.com/2014/10/shorting-the-box.html
http://ibankcoin.com/flyblog/2014/10/07/ignore-everything-but-this/
which do u determine to be the ones producing the poor results. are they the ones that don’t fit your model
Global Stock markets breaking down but the S&P is arguably about to do the opposite. This is a critical month for US markets of course so let’s see how these scenarios play out. Will the smart money head stateside should other global indices break down?
Source; http://www.KimbleChartingSolutions.com
http://charts.stocktwits.net/production/original_27636673.jpg?1412692187
Dollar refusing to correct across the board. US larger caps refusing to do the same.
And the above ties in with this. Despite everything, it’s simply the best of a terrible bunch and global capital has to be parked somewhere.
I.M.F. Lowers World Growth Forecast, Pointing to U.S. as a Bright Spot
http://www.nytimes.com/2014/10/08/business/imf-lowers-world-growth-forecast-pointing-to-us-as-a-bright-spot.html?_r=0
“The International Monetary Fund cut its forecast for world growth on Tuesday, warning that stagnation in Europe, a slowdown in large emerging markets and heightened political tensions in Russia and the Middle East threatened an increasingly fragile global economy.
At a news conference starting its semiannual meeting, an event that attracts financiers, policy makers and central bankers from around the globe, the fund’s top economists highlighted a tepid economic recovery in which the major nations of the world have failed to keep up with the United States.”
Jonathan…the dollar is the prettiest pig in the currency trough. But the big boys know that the U.S equity market is extended and running on fumes. Why do you think they have been hedging with treasuries. Why the f are treasuries rallying since the beginning of the year if the stock market is the name of the game and the economy is sound and robust? Answer me that? It’s called folks are going all in on treasuries (which yellen and the federal reserve) want and prefer. They rather have a stock market crash than a tbond crash. These fat cats know corporate profits have peaked and it’s been financial engineering for the past few years. They have been dancing to the music and know it’s gonna stop. Your capital inflow may be correct, but it’s treasuries. That’s what the federal reserve overlords want and prefer. They had their nice run and knew irrationality always comes to a stop.
Amen! LNB, you just gave me a boner!
“Why the f are treasuries rallying since the beginning of the year if the stock market is the name of the game and the economy is sound and robust?”
That’s news to me. I wasn’t ware the economy was so healthy. I disagree. The US economy is sick but not as sick as elsewhere yet. Since when did buoyant stock markets reflect healthy economies anyway?
Are you sure folks are going to go all in on treasuries? Will US treasuries provide a sufficient return for haemorrhaging European pension funds? Will US treasury returns cover other unlimited liabilities such as social welfare programmes, shortfalls in tax collection, health, education etc? I doubt it. Are US treasury investments ‘getting money off the grid?’ No.
If I am right and we see a Dollar bull market advance a further 25-30% or so from here, it may not come down to what ‘ federal reserve overlords want and prefer’. It will come down to last resorts and what the rest of the world desperately needs. Janet Yellen, like Bernanke, is a spin doctor. But she cannot change the trend if currency inflows gather momentum. Constant talk of rampant manipulation and ‘switching the video game off’ is nonsense. Pure conspiracy.
“Constant talk of rampant manipulation and ‘switching the video game off’ is nonsense.” Hence, the dual rally of the stock market and treasuries. If it was video game off/on, then stocks would have cratered dec 31st and treasuries would have done the inverse, and vice versa.
The dax is going to break 9000 support this week, ibetcha.
http://stockcharts.com/h-sc/ui?s=$NAHL:$NATOT&p=D&st=2014-03-14&en=2014-10-07&id=p95328918896&a=369189956&r=1412695702638&cmd=print
this indicator is gold and never lies
Looks like a video game.
of course! because IT IS! just like the left brain narratives in the modern digital fiction we call life!
6 of the top 10 biggest Dow down days occurred in the window right ahead:
19 Oct 1987
26 Oct 1987
28&29 Oct 1929
6 Nov 1929
15 Oct 2008
How does spread trading work if we hit circuit breakers on the Dow?
Circuit breakers stop the action until later or the following day, the trades would do likewise.
the key is to look at net lines of resistance here and not pick a side
1937ish is the break to more significant downside
http://stockcharts.com/h-sc/ui?s=$NYUD&p=D&yr=0&mn=2&dy=19&id=p74556505902&a=367853694&r=1412695997244&cmd=print
http://stockcharts.com/h-sc/ui?s=$INDU&p=D&yr=0&mn=11&dy=0&id=p08146239425&a=368645081&r=1412696099080&cmd=print
ending diagonal on INDU is sickly but still has to break
xrt and rth are harbingers here…
http://stockcharts.com/h-sc/ui?s=XRT&p=D&yr=1&mn=0&dy=0&id=p34680172458&a=370502282&r=1412696687367&cmd=print
rth has to join xrt to the downside and break it’s 50ma
DARKNESS? Many major tops occur at or near new moons – 1929, 1987, 1980 gold, 1997 SE Asia. But several happen at the full moon if it is a lunar eclipse – tulipmania, Mississippi Bubble, Panic of 1857, 1980 gold, 1987, 1990 Nikkei, 2008 commodity. Some of these are at the peak, others at the second chance peak. Throw in the Autumnal equinox and one has quite a witch’s brew. This is also the 2nd of 4 total lunar eclipses in a row, called a tetrad. Puetz said, “the general rule is that the panic phase tends to begin at the time of a full moon within 2 weeks of a solar eclipse. The solar eclipse is 2 weeks and one day. However, the next two are within a week and the solar is before the lunar which seems to matter – 1929, 1987, 1980 gold, 1997 SE Asia. I have been keeping an eye on the eclipse pairs since 2009, no crashes yet. If there is indeed a connection, the lunar eclipse seems to be the singular most indicative aspect, with tomorrow being one.
This is very interesting Kent…what date do you have for the 1857 crash?
Most likely it began on Aug 24, 1857 but the carnage really began in Sep.
Thanks — so it crashed about 14 months before the solar max then.
John Li lunar eclipse Sep 4, top before panic Sep 3. Source, Unified Cycle Theory Letter by S. Puetz.
Thanks, I have noted. It still leaves the standard error of crash versus solar max to be around 1 year. In other words, we can rule out 2/2015 market peak, for example.
“we can’t rule out”…I wish I can edit posts!
Allan, neither do I think ebola will mutate,
at least not in the near term.
I mentioned it because it may already be
transmitted more easily than the consensus
appears to maintain.
How did a Spanish nurse get infected while wearing
protective clothing?.
I appreciate this is a little off general topic so that’s
my last mention.
Key US close today, can they bears take this down.
Elvis, interesting posts, have made a note.
Kent, thanks for the really useful description of eclipse correlation to negative market performance. “There are more things in heaven and earth, Horatio, Than are dreamt of in your philosophy”. – Hamlet (1.5.167-8)
Deutsche Bank buys into Jonathan’s thesis:
http://www.zerohedge.com/news/2014-10-07/deutsche-banks-shocking-admission-qe-europe-will-be-ineffective
Help me Obi-Wan Kenobe, you’re our only hope.
Wait until the heavy weights start following though followed by the banks…..INTC,FB,AAPL and MSFT
Help me Mr. Wizard!
http://en.wikipedia.org/wiki/Tooter_Turtle
Puetz crash window of 10/2 – 10/13 looking better every day
who holds the handbasket when we all go to hell in it??? I WANT TO KNOW!
more WCCG!
Nitrous oxide is used because it migrates easily into the cream, and does not cause the cream to oxidize while it is in the can. Cream must have a minimum fat content of 28% to produce whipped cream with a dispenser.
it migrates easily into me as well!
Please bbe would you explain what WCCG means? Thanks.
orderly sell off. No whiff of panic selling. That is good for this to morph into something bigger.
no more pomo for a whole week – lets see if reality without glue sniffing is palatable to the masses
Agreed —
the good thing is that GDX and GDXJ are still plunging, even when gold is up. The market can go up down neutral and the price of gold can go up or down, it doesn’t really matter, we know that the miners will go down. Very easy money.
easy money!
WHILE WAITING FOR
THE DEATH SPIRAL!!!!!!!!!!!!
Yes, this has been a good trade and easy money in recent weeks. However, the ratio between gold prices and gold stock prices is at an extreme level here. He may even get more extreme in the near term.
http://stockcharts.com/freecharts/gallery.html?$GOLD:$XAU
Please stop with these inane comments, Nicolas.
Playing with fire. And thanks for those comments earlier Gary.
That’s your SPX 1937 decisively gone.
Is that the RUT back in correction?.
we are in a pretty choppy support zone going back to the breakout in late May
so I’m not sure we dont get a bounce
if RTH breaks the 50 ma and the other indicators keep failing then we will plunge
Rut is in a confirmed bear and dow is about to follow IF the ED lower trendline gives up tomorrow. We sold off right into that support today and there is still a lot of wiggle room in the pattern for the speculators to dance theheebee jeebee!!!
http://stockcharts.com/h-sc/ui?s=$INDU&p=D&yr=0&mn=11&dy=0&id=t59468697673&a=368645081&r=1412712537003&cmd=print
AD line (NYAD) broke the 125ema for the first time since Nov 2012
so as some say, “BOUNCE OR DIE!”
I expect this ratio will reverse toward 0.1-0.12.
All gold mines in the world capitalize half of AAPL alone.
Twenty years downtrend is at end.
http://stockcharts.com/h-sc/ui?s=$XAU:$GOLD&p=W&st=1990-10-07&en=22222-01-01&id=p31276386542
I am puzzled. You are all suggesting that the Solarcyle top will herald a crash (at least it seems unanimous). Yet looking at the chart, the sunspot cycle fell from 2002-2008, so it included one the the biggest rallies in history. The choppy period 2000-2002 saw a bear market, yet 2012-2014 didn’t (unless it did but QE covered it!). We are likely to have another small correction (as the cycle falls like it did early 2003), but then we will see another huge bull market. Don’t confuse yourselves with fundamentals, they will look after themselves, as they did when the end of the world was coming in early 2003.
Just a contrarian thought amongst a forest of bears everywhere I go
Smoothed solar max = max human excitement = speculation peak. Smoothed solar max was March 2000 and likely circa March 2014, both times when margin debt and the speculative index peaked (to be confirmed). It’s not about the markets tracking the waves of the solar cycle, just the tops and bottoms (the March 2009 low fell at the solar minimum).
Thanks John, I certainly agree that it is not markets tracking the solarcyle. I have been watching them for 20 Years. It is the ECONOMY that follows the solarcycle which is why markets can go up during a downcycle. Markets don’t necessarily follow the economy, they can for example be influenced by lower rates, that are attempting to stimulate a flagging economy
Everywhere you go? The facts say otherwise. Best you look at what people are actually doing with their money, not what they say. It’s steered a lot of others wrong as well.
bullish consensus last week was just 18%, ie at levels to expect a low. Read all the comments here, I am a lone LT bull…everyone wants to fight the Fed..why? Dow over 17K again…who’s wrong here?
Nicolas could be right. The miners are weird. If they drop by half from here he will be rich.
And we would have learned what exactly, lol?
Andre’ could you describe the lunar edge. Is it different from the Full plus four to New plus four? Are tides involved? And if tides are involved could you describe the process for determining price based upon their movement, the location and the indicators that you use to predict price. The reason I ask is that I am studying tide stock correlation and am looking for some advantage.
From Professor Steve Keen, who the mates on this board from the land down under should know:
http://www.everyinvestor.co.uk/analysis/2014/10/07/video-professor-steve-keen-says-us-stock-market-set-fall-within-year-9894/
For some reason Steve Keen has a great reputation. He gets an awful lot wrong. His call on housing prices crashes in Australia were woeful, as it well documented.
I think if you google Steve you’ll understand. And in the video, he freely admits he got the housing crash in Australia wrong and the reason why. I admire his unconventional but rigorous approach to economics and his desire to develop a new cirriculum in schools in its teaching. I strongly believe that’s needed.
Allan i really like your posts
Sounds like you might be one of the slim few with a long position in VIX.
can you share any targets. I follow VXO and would not be suprised to see a number well above 100, Perhaps more like 2.
Specie, I’m currently long via TVIX/UVXY looking for VIX to spike to at least mid 30’s in the immediate term and will reassess the situation then.
As you are likely aware when it’s hot it’s HOT and I think the next few months are going to see it rise substantially.
I would not be surprised to see it trading above 100 before this market bottoms.
Cheers
Allan, did you ever get those shorts on around the 1980 level you mentioned a few days ago?? I sure hope so… That was a nice call….
Regardless, any further thoughts or possible targets on that?
Thanks for your contributions…
Barry, I stopped trading futures after the MF Global collapse. I got burned by it and aside from the financial implications, which were recoverable to a degree, it was the psychological damage it caused me(insecurity, trust issues), that forced me to end my futures trading.
You have to be mentally in the right place to trade futures and I just have not been prepared to go there again, especially since I really don’t need to from a financial perspective.
Happy now to trade etf’s amd as for targets?
I am with John on this one. I think the markets are in for at least a 30% decline minimum initially, I think John has said 20% min based on previous delines.
That said I would not be surprised to see a full blown panic and 50% delines ensue.
My focus at present is on the R2k and SPX which I think will target at least their 200 wma’s, we’ll see after that.
What I am certain of in my mind is that the downside is just beginning and has a long way to go. The hallmarks of a top are everywhere, just go back and read John’s past articles, he sums it up pretty perfectly and as is the case after every bubble burst, this one will be no different, investors will look back and say to themselves………………………..”how did I not see it”?
Cheers
PS forgive my spelling, being on the other side of the globe means I am at the end of a long day and getting tired when reading and responding and usually on my ipad in bed ;).
Steve T., wanted to mention you too… You sounded like you were all in short as of Friday’s close, and looking for a potential pop up Monday on the open, and that would be it…
Well done, sir…. Well done…
But, any further thoughts or updates on the fractal you were looking at??
Thank you for your contributions as well…
Just read interesting article:
http://ceo.ca/2014/10/06/2008-redux/
Seems there was a broad sell off in commodities in 2008, that preceded the stock market correction by a few months. A harbinger of things to come?
This is beginning to look better for the bears.
Oil down yet again.
Phil, in a word DEFLATION.
And everyone should pretty well know my stance on gold stock performance during delation by now. Thete are a lot of misconceptions out there.
Anyway a mate sent me this link today. I never read Stewart Thomson before but I agree with some of his points inthe following
http://www.321gold.com/editorials/thomson_s/thomson_s_100614.html
Apropos of nothing, the R2K and Gold charts are (reverse) mirror images of themselves – each are sitting at important intermediate term support price levels.
This is a very good link from Naomi Bennett a very good atrologer she makes very clear updates about the markets that can help you….
Allen, I would agree in the Eurozone looks dire.
Any thoughts on equity price action today guys?.
Is this the day when finally the bears grab control,
we are getting very close now.
A wounded bull is a very dangerous creature,
worth bearing in mind.
Hi John,
I’m a big fan. I am Aussie and you have already saved me $1000s. Keep up the great work mate.
With Kind Regards
Mat
Here we go again. More stories about the fear following yesterdays drop. Gimme a break. Complacency still at extremes and pre open futures currently up, maybe not by much, but still up nonetheless. That doesn’t spell fear that says most investors are either completely asleep at the wheel or aren’t phased by the drop at all and see none of the things that most of us are seeing.
We have a long way to go before there is any level of fear.
In a attempt to preempt a post about the market being oversold.
Crashes only happen when markets are oversold.
I don’t believe it, Allan – GDX is actually up today. Who would have thought?
Yen at LT support –
http://stockcharts.com/def/servlet/SC.pnf?chart=$JPYUSD,PLUBDANRBO%5BPA%5D%5BD%5D%5BF1!3!0.01!!2!20%5D&pref=G
Any lack of fear indicates that this sell off may
have scope for significantly lower levels,
it does not guarantee it.
Big distinction.
We need just one big down day today,
and bears may have this.
So often the pattern has been a decent fall
with a rapid reversal, this imv is a key day.
Even if its just down to the S&P 1900 region would be a good start. We know that there is support there but the ability to get there would show that there is hope for the bears.
10/07/2014, 1039321, 659251, 1698572, 0.63 this was taken from last night cboe put/call ratio and shows NO fear out there
if we get another plunge today as im expecting looking at RUT especially, then that 0.63 will likely shoot up
I’m being very careful this week after gaining a fair amount on my shorts we are not far off the 200MA on the daily DJ. With the fed mins coming later today and a resolution with activist in HKong this Friday we might see a bull lash back.
Ok, GDXJ is down now… For a little while I thought it might be rare up day for the gold miners.But no, back to a normal day, it should close down around 4%, as usual.
Whew, that was close!
Supports being broken. Should be in full crash mode, but isn’t. Odd.
Circuit breakers? Manipulation?
Max risk for longs here
More colour on that spring fractal analysis? Well if you must know today is “supposed” to be a panic down day. It is “supposed” to make a lower low than Oct 2. It is “supposed” to trade down into the lower range of the downtrend and maybe temporarily bottom out possibly early Oct 9.
Now, I realize today there is a Yellen speech and Oct 8 is also a Bradley turn date and some are looking for a potential bullish reversal. Logically speaking that might be the “obvious” thinking. But it could also imply Yellen is the cause for the downside panic too and the Bradley turn date could also mark the acceleration of a big move rather than a reversal. Other times I have observed Bradley turn dates might have a temporary one or two day effect but minimal impact on the short/medium term trend.
Anyways, I once again reviewed the fractal again and what I can say at this time is that the extent of this week’s sell off is very important as to defining exactly which specific path it will follow. One path leads to an extreme bullish reversal and the other path leads to one more short term down leg. But both potential scenarios result in much lower prices in these current days than what it is currently trading for as I type.
Unless we get a reversal Biotech first candle below the April uptrend
There is some entity preventing a crash. This is not how free markets behave.
Steve T, can you just clarify the last sentence in your above
post if possible?
Yes, please…
Steve T I’ll third that question. Are you saying that we go ‘down’ under both scenarios FIRST before either turing bullish or falling through the floor?
Please keep in mind that I am not some stock market guru nor do I have a crystal ball. I am merely following a prior chart pattern that has repeated before which so far today’s action has been very similar.
The skinny is that I was expecting an Oct 8/9 bottom and then a sizable rally starting late Oct 9 leading to mid Monday Oct 13 and then the next down leg into next mid-week (mid-Oct). But the premise was based on a steep sell off on Oct 8 and no later than Oct 9. So far we got an orderly sell off yesterday and some follow through today Oct 8, but it stopped at the Oct 2 low and has now bounced quite hard to trade above yesterday’s close.
Thus it is stuck in no man’s land right in the middle of the price band and now offers poor reward to risk if you go long or short because both scenarios could occur. It can potentially now rally and recover all of yesterday’s losses and even retouch Oct 6 closing price before another downswing. Or this current intraday rally can halt on a dime later today and panic sell off to hit the lower downside anticipated target.
As it stands now the market action is definitely favouring the bulls leading up to the FOMC minutes.
Also, do not go overboard with being too bearish because that time window only lasts to about mid-Oct at the latest. Huge rallies are likely in the cards afterwards.
Apologies, forgot to say please and thank you in
a rush to post.
Folks worry not. They can hide it in this:
http://stockcharts.com/h-sc/ui?s=$SPX&p=D&b=5&g=0&id=p96956442286
But not in this:
http://stockcharts.com/h-sc/ui?s=$TRAN&p=D&b=5&g=0&id=p15643162236
or this:
http://stockcharts.com/h-sc/ui?s=$RUT&p=D&b=5&g=0&id=p47674680079
I say we reverse back down hard soon. AAPL has failed it’s 50 dma and FB is testing its now. The big guns are about to join the party.
From a trading point of view, that RUT chart looks like an excellent speculative buying opportunity – nice bullish divergence in both MACD Histogram (the most important of all I think) and Stochastic. RSI looks promising too.
If a long at these levels starts to go wrong, it becomes obvious very quickly and costs very little, but the potential upside is much bigger.
I have taken a long RUT position today, Mark. I will add more from here over the next 2-3 weeks.
PART III OF III: DISCUSSION
I had thought about hiring an astronomy student for a tutorial but later dismissed this idea for practical reasons. Even if I had a perfect understanding of the various data; it would not answer the question we all want to know: the timing of trades. These theories dovetail with Andre’s work and his studies of apogee/perigee and the tides. But Maxwell’s theory suggests that the tides are merely one of the obvious consequences of nature’s gravitational machine. He also mentions the importance of air streams as a timing aid. Certain adjustments (no specifics) also had to be made for his weather predictions.
And if they were studying speed or velocity from position A to position B, of planets in the Almanac; is there anything further this theory can contribute to what Andre is already studying? Maybe part of the answer can be found in their mention of Aries to Aries; which represents one complete cycle? I’ll be honest I am pretty much clueless about how to apply the details discussed in Part II of this missive. For example; what is ‘var. of var.’? It seems to me that if one examines angular distance between planets ( defined as aspects; or POSITION) isn’t SPEED automatically implied by position? If so then, why aren’t all market turns during lunar phases Immediately before or after the moon’s perigee; when the tidal influence is the greatest? Again, does this topic really add anything new to Andre’s research?
Maybe the answer can be found in experimenting with various spreadsheets;
a skill I don’t have; which is why I was seeking some help. How would one decide on a beginning date (position A) and an ending date (positon B). What time period of data should be placed in the spreadsheet in order to arrive at accurate predictions that were statistically significant: one month, two month, or three months? Maybe shorter such as two weeks? After all they were trying to determine market turns with one day!
It is hoped that a group of proficient ‘spreadsheet wizards’ can collectively come up with some useful conclusions as a group. This would certainly reduce the vast
amount of time necessary to test out various theories. I am posting this information in the hope that anyone in the group will share their findings as it
applies to commodities. If not, I could provide anyone with a few dates of interest to me. My trading days ar over. If I knew these ideas are not useful for long term investing; (major turning points) that would also be well worth the feedback. Apart for that, John’s generosity certainly deserves a token of gratitude.
I thank John and this fine group for your valued time, attention and any feedback you can provide.
“O, swear not by the moon, the fickle moon, the inconstant moon, that monthly changes in her circle orb, Lest that thy love prove likewise variable”
― William Shakespeare
Sincerely,
eclectic.
END
Eclectic,
I am currently reading the above referenced book, so I may have additional thoughts, but currently I believe:
The Var. = Speed and so var. of var. is in reference to the change in the speed, or the 2nd derivative. So, today the Moon has had a change in longitude of 14.46 degrees, and the recent peak longitudinal speed was 14.79 on the October 6. The speed will continue to slow down until October 18, after which it will speed up again, but not as fast as recently. Now looking at the change in the speed of the Lunar speed, the Lunar speed increased AT AN INCREASING RATE until October 3, after which it began to increase slowly and then slowed down after October 6. I believe this is the var. of the var. The speed will continue to slow down dramatically until October 13. This is just the moon. The authors also considered at least the Sun, the Moon, and Earth. This implies that the same approach is applied to the Sun-Node relationship. It should be noted that this speed is slowing down dramatically to October 12 exact, the Lunar Wobble. I have stated in the past that this approach of looking at speed can also be applied to other heavenly bodies, specifically Saturn-Uranus relationship (which is approaching maximum speed at the end of this month before slowing down, and eventually going retrograde in mid February).
Back to reading,
SC
Jonathan, that may pay off.
Some of the stocks on my watch list look
to have put in interim lows yesterday or earlier today.
If I was short and nicely ahead on this week’s
price action, would be very tempted to close
about here.
This does not look like it wants to go much lower
from these levels, however I may be calling this incorrectly.
I agree with you of course, Phil. This correction over the last three weeks or so appears to be a liquidity-based one, and not a fundamental-based correction in my opinion.On the S&P, we are still respecting the long term upwards channel and we have bounced off the lower trend line again – this time a higher low of course. It’s a no-brainer trade from here as stops can be kept tight and we have the 200 day MA just below. Great risk:reward here.
Added to my S&P positions too, therefore.
US Dollar index bouncing off support here too, after consolidating over the past week or so.
So far, very good trading call Mark and Jonathan. Congrats…
Thank you but fortuitous timing on my behalf there. Wow, what a move.
Mark really??…..hows this look then?
http://stockcharts.com/h-sc/ui?s=$RUT&p=W&b=5&g=0&id=p08170185158
I would say similar to the Daily, Allan – although RSI and Stochastic could fall a bit further; but there is still positive divergence on the MACD Histogram from early May.
That final yellow-highlighted candle may look very shaky, but it isn’t even halfway through forming yet.
I know from your previous comments that you are not exposing yourself to unnecessary risk, but I wonder if too many others are making three of the most fundamental trading errors:
1. taking it upon themselves to decide with exact certainty what the future must hold
2. becoming anchored on that
3. allowing losses to run and build in the hope that the market will come back to them.
spx sure loves the 1937 area I highlighted yesterday – real possibility of a bounce BUT internals are corrupt and showing no improvement as smart money sneaks out the door
http://stockcharts.com/h-sc/ui?s=$BPNYA&p=D&yr=0&mn=11&dy=0&id=t88394053313&a=367906801&r=1412789235700&cmd=print
spx 1954
these moves really have to help a waterfall scenario
looks more like a ’01 than a ’08
dollar
Steve T does this last bull move imply that the fractal has broken? Thanks very much for all your guidance thus far and if it has then best to re-think strategy.
Disagree Specie.
If these gains hold, it’s a powerful reversal.
That’s nearly a 250 point intra-day move on the DJI.
As bears can not gain two consecutive days of decent
falls, bulls look back in control here.
Hope some of you guys short locked in gains.
The correction may be over.
Sorry Steve T didn’t see your answer ealier before posting my next question.
I’m being very careful this week after gaining a fair amount on my shorts we are not far off the 200MA on the daily DJ. With the fed mins coming later today and a resolution with activist in HKong this Friday we might see a bull lash back.
——–
Lucky I was careful Posted the above at 4pm today, tighten short closed and banked, open new short 16933,,,,,, I really missed out that long:(
In my forecast this Sunday I said Wednesday would be a low. Voila.
Congrats Andre.
YOU HIT IT AGAIN , I KNOW WHAT COMING NEXT , HA…..N
Hi Andre,
Well done, its working 🙂 I believe that you were looking for a low on 10th Oct from your earlier posts? I guess we had different dates due to different tide stations.
I had picked out 3rd Sept as a top and 8th Oct as a low and I have increased my long exposure just before the UK close from 25% long/75% cash to 50% long/50% cash for a bounce from here.
Too early to say whether the short term low is in but I am going with my short term cycle low.
ATB,
Kerry
The headlines over the past few weeks have been dire and I have to ask myself…. are things really so bad at the moment? There is doom and gloom everywhere. What has really changed over the past fortnight? The rising Dollar is scaring investors as they are not wholly aware of the implications. The Bill Gross resignation from PIMCO has shaken up the bond market and has triggered liquidations especially as much of the capital wasn’t sitting there in cash, but in investments. The Ebola story is running its course and I have my doubts about just how serious this will turn out to be. Despite serious incidents in Madrid and Texas, I imagine this will soon fizzle out. We’ve had the Hong Kong protests which have been headlined by media all around the world and this has clearly rattled markets, not to mention the usual drama frenzy of the ECB’s policy response.
This correction has been on the cards fr weeks but I don’t think there is any need to be overly concerned about this. Dips below the 50 day MA have been buying opportunities for months on the S&P 500. I would have expected the the defensive and consumer staple stocks to have been leading if this was any more than a correction but yet the Social media and leading technology stocks have barely budged during this corrective time period.
Back to the Dollar, it is gaining strength as the US economy is showing signs of improvement regardless of whether you believe the data coming out. QE is being wound down and therefore interest rates are likely to be raised over the coming 6-12 months. With yields rising in the US ahead of those in Europe – 2.4% in the US versus 1.1% in Germany, the US is simply looking like the much better proposition.
Let’s see where markets end up this week and next.
Your reasoning encapsulates why the stock market will top… you’re wrapped up in the raging bull market as the profits are clouding your logic (imo). Once the various data points (ISM, etc now being watched meticulously since inflations expectations have fallen) report an unexpected / disappointing economic slowdown, the market mob will connect the dots that the Fed is trapped – that it will not only be UNABLE to raise rates 6-12 months from now (as everyone and his brother has leveraged bets expecting), but worse, they will have to print MORE money (QE4). The dollar will resume its bear market… Gold will take off. This is similar to what was occurring in 1976 (strong dollar, falling rates, etc).
I’m not saying you’re not correct William as time will tell. But at the same time, the market certainly does no want to crash. Therefore, we have a dilemma which will play out, one way or the other, into the end of the year.
Jonathan, my skeptical side wonders if this is not an acknowledgement of an impending financial debacle – the banks have agreed not to savage one another via derivatives? It must be getting close give or take a few months?
http://www.ibtimes.co.uk/banks-agree-overhaul-rules-governing-700tn-derivatives-market-1468969
I think you may be on to the fed being trapped, they raised the concern of every economy is getting weak and may have to hold off on the rate hike…all the major central banks are doing what they can to devalue their currencies and now the fed may have to back off on the tightening talk…I think money flows to pm.
You’re right James. The FED is trapped but then so is every other major central bank. As I’ve said all the long, I think it’ll come down to which is the healthiest horse in the glue factory. That alone will determine where global capital concentrates. Nothing has changed here. If anything, the FED have just sugar coated my thesis.
This is not directed at anyone here, but suffice to say… People are morons, and that’s a sad fact of life. Should it not be obvious to anyone with a pulse that the financial markets can’t stand on their own without Fed money printing, which would naturally then lead them to the conclusion that the dollar should be sold and gold should be purchased as the stock market weakens.
And what would change the mob’s opinion on this matter? Perhaps it will take a stock market crash occurring before they’re able to connect the dots to the dollar, the Fed, and gold. Today’s Fed minutes were dovish as usual, and when the gold bears failed to raid gold on the minutes, the natural reaction was for gold to take off dragging the gold stocks with them.
But imo, the mob has their heads up where the sun don’t shine with no idea about how weak the economy actually is or how weak the stock market is going to be once the Fed stops printing (just like every other time the Fed has tried to stop printing since 2008).
When it finally dawns on people after the stock market cracks big that the Fed is trapped and will be forced to continue to print money with little or no lasting benefit to the economy or financial markets other than to create inflation and in the process inflate away our monstrous levels of debt, Gold will be well on its next leg higher… imo.
Fed just manipulated the markets yet again. Does this surprise ANYONE?? Poor Fed, afraid they are misunderstood about interest rates. So here’s the rip your face off rally, just before we fell off the cliff…hmmm….
all the Fed did was release their minutes. The ALGO’s manipulated the markets again. That and individual and institutional traders playing chase.
major disconnect like an unbalanced metal shredder eating itself!
Looks like what is going to happen to the markets after solar maximum.
Bbe that is very nice ‘imagery’!! You should write literature….or perhaps you already do.
Eclectic, ‘var. of var.’; sounds like “variable” +
the word seems common when defining weather:
https://www.meteoblue.com/en/romania/weather-var/seeing
The winning strategy the last 3 weeks has been to sell every bounce and I see nothing to change that strategy.
The market has got this completely wrong again because it is not about the Fed any longer and I believe that this rally will get sold hard tomorrow.
It is about the rest of the world. The US will not be able to hokd up the rest of the world and US companies are going to be hurt just as much as any in other country, possibly more so.
This nothing more than an opportunistic staged rally on the back of Fed minutes which smart money will be off loading into IMO.
The Dax stood 5 p.p. below the 200 dma yesterday. Check at indexindicators, how much the index rose in the last three years, whenever this was the case. More than 7 p.p. in 20 TD is nothing to neglect. Only over the first week the index didn’t significantly outperform the DOW.
Once again the very oprimistic oex-call-put ratio of 5.3 to 3.4 was a reliable signal for the imminent turnaround this morning. Better forget about everything else and follow this ratio, if it is that clear in favour of bulls or bear.
http://stockcharts.com/c-sc/sc?s=%24SPX&p=D&b=5&g=0&id=p94733973974&a=231132339&r=756
?????????????????????????????????????????????????????????
http://www.cboe.com/data/mktstat.aspx
Jonathan, I am with you re money flowing to the US due to being the ‘healthier horse’ e.g. Waldorf Astoria purchase by Chinese company, I believe there was another purchase by another Chinese company paying $700 mil for another NY building…but now that the Fed may sound a bit more dovish you will see some funds go to pm, i think once/if the Euro turns negative again i may add a long Gold/Euro position.
Ya gotta luv it. Absolutely nothing was in the Fed minutes today from what we heard three weeks ago……..reality hits soon.
SPX currently back in resistance zone. If it heads back lower and can’t manage to break through it’s game over.
Interesting day or two coming up.
yes,
and the dollar rally got so many bullish on the dollar (almost universal)
only to fail at long term resistance downtrend
the decline is likely to be epic
It’s far from over, specie. It hasn’t even go going yet! 🙂
i hadn’t noticed before but a lot of minor miners up 12-15% today
Yes, take look at JNUG, if you decide to take a position on this, be careful it is extremely volatile
Yep. Nicolas’ shorting GDX and GDXJ strategy may have hit a little snag. 😉
You’re kidding – he’s always right.
when someone starts saying “the easy trade is…”, that’s a pretty good indication that that trade has run its course. GDX, the gold miners etf–not leveraged by the way–was up over 8 percent today. It closed off its highs, but still up 7 1/2 percent.
The Fed needs to boot the market, especially SP have just tested twice at a critical level where the monthly trendline just underneath. Seasonably at the end of Oct usually made a bottom and up into May next year
Today’s price action is not all about the FED,
it’s also a lack of selling pressure imv.
If this is just FED induced then
it reverses tomorrow, however you have to
respect the size of this rebound.
In terms of waterfall declines
today all about rules that out in 2014.
Just my take.
Engulfing daily bullish candles across US markets this evening. If the weekly candles up being bullish engulfing too, then I would be betting that the correction is over. S&P 500 bounced off the 200 day MA today, stamped a higher low and respected the rising lower trend line. The bears have to attack tomorrow and Friday to reverse this now. Very, very interesting.
Both $NDX and $DJI have recaptured their 50 day SMA.
Today, most breadth indicators (such as $NYADV:$NYDEC, invisible; 10 days EMA) I follow are saying the (short term) bottom is it. I remember in the past I would yell and scream to John on a day like today John would agree and we all went long…what a party!……I believe his original bullish road map is still playing.out.
Gold’s corrective move may reach 1240 before retreating. I expect complex pattern to form in gold in next weeks before support at 1180 is finally breached,
Stocks may have been saved but it is just for few days at best. Bear rallies are furious and are frequently misjudged as start of new bullish move,
Downtrend should return shortly and with vengeance.
Amid most fascinating charts is USDJPY, thing may accelerate lower quite quickly in my view.
I concur re gold. 1240, maybe 1245. If it goes above 1281, then my EW count is wrong. But it sure looks like a classic 5 down in progress, the 4th wave (up) being underway now. Once wave 5 down begins (in a couple or three weeks), it expect gold will take out the 1180 low.
Stocks, you may also be right. Today’s rally sure looks impressive though. 45 SPX points from this morning’s low to today’s high.
I agree with your $1240 target. The USD:JPY ratio’s 0.38 retracement level coincides with 1240 gold… Currently there’s a 91% correlation of the USD;JPY ratio with gold. Last Thursday at its high, the USD Index was 2-standard deviations overbought signalling a 95% chance of a reversal. 1240 level should be a crucial resistance level that must be over come by gold.
Andre’, Peggy, Eclectic, et all,
I have done a little research on the apogee (perigee) cycle. This is the Anomalistic Cycle, which is referred to as 27.5545 days. I looked at the time period from 2009 through 2014. Admittedly I cheated, by just using the day to day as a whole number, rather than incorporating the specific hour of the day which would be reflected as a fractional day. This method resulted within an hour of the above 27.5545. HOWEVER, there is variability in the days of this cycle. The number of days could be as little as 24 days, or much as 29 days. For whatever reason the Perigee to Perigee time period was a little more stable than the Apogee time period.
One question is, so what? I believe the answer was alluded to in Andre’ recent post in which he observes how many cycles of repetition of two different lunar cycles occur before they become synchronized again. I believe this is important. So let’s compare the Anomalistic Cycle with the Lunar Synodic (Phase) Cycle of 29.53059 days and Draconic (Declination) Cycle of 27.2122 days (please note in a previous post I had referred to this as an apogee cycle, which is clearly wrong). How might these 3 cycles re-sync.
The 29.53 day and 27.2122 day cycles are special because they re-sync after 12 and 13 cycles respectively. I won’t digress on all of the obvious references of 12 & 13 throughout time, other than to note that 12 is the # assigned to the Sun and 13 is the # assigned to the Moon by the ancients. Anyway, the Lunar phase and Declination Cycles align (+/- 2 day) every whole multiple of 12 and 13, or at each of the following years: 0.97, 1.94, 2.91,…, 8.58,…, 11.41,…, 19.00. Humm,19.00 years. This is the Metonic Cycle, and is the basis of the book by Lars Von Thienen “Decoding the Hidden market Rythem – part 2 Metonic Cycles”. He also indicates 2 smaller 8 and 11 year sub-cycles. I believe 8.58 and 11.41 would be more accurate. Also it is interesting that Pi=3.14…*1,000/365.25=8.60=8.58
Now let’s add the Apogee Anomalistic Cycle. This aligns (+/- 2 days) less frequently with the other two cycles, at years 0.97, 5.7, 6.64, 10.43, 11.40, 18.03, and 19.01. One implication of this is that these 3 cycles would best align with the Solar Cycle and Ecliptic to the Sun at 0.97, 10.43, 18.03, and 19.01 years.
I would be interested in the thoughts of those that believe in a SoLunar impact behavior, either through gravity or an electrical universe, which has the greater influence and is more important ordering in aligning cycles with Solar cycle: the Lunar Phase cycle, Declination Cycle, or Apogee/Apogee Cycle.
Have spent hours trying figure out apogee perigee. Seems like different markets are effected variably. Though the trend seems to be the market rises from each perigee to apogee cycle. And then has less bullishness apogee to perigee. Not as robust as the lunar edge (full plus four, to new plus four). QQQ seems to have unusual strength around perigee date.
Steve S.
I tend to agree with your comments. I have seen a chart, which I have been trying to find, that shows the movement of the Apogee/Perigee over an extended period (perhaps Andre’s 4 years, with smaller annual max/min cycle) which the market tends to follow. As Andre’ might say, best to use it as a background filter (not trying to put words into Andre’, just giving credit where credit is due). Notice that Andre’ feels comfortable taking an average of apo/per. One potential implication is that it is not as precise cyclically and the Apogee cycle doesn’t have to synced up with other 2 cycles, I mentioned above, in as precise an orb. This provides an additional degree of freedom toward structuring timing model. Not sure, just thinking out loud.
SC
I’d like to add one additional element to the mix.
Apogee/perigee is about the distance between moon and earth. As gravity is all about distance and mass, one would expect that APO-PERI extremes are sharp timers. However, most of the time we see that there is a 2 or 3 day gap between market turns / tides and ‘moon-turns’. So apparently there is something else at work, and I am not sure what. But logic tells me that whatever it may be, when tides and apo/peri turns are in sync, this other ‘force’ must be as well. That’s why I think this October/November synchronicity is relevant.
When the moon turns at apogee or perigee, the rate of change of distance from earth approaches zero. So maybe this is the time frame where distance/gravity is flat and weaker forces can have an impact. This also implicates the rate of change of distance is highest at the midpoints between apogee and perigee. Maybe this is why taking the average of apogee and perigee gives such a nice trend; you just look at the points with the highest rate of change, where the impact of gravity on the market/volatility is highest.
Steve, fantastic post, but I need some time to digest it. And I don’t believe in gravity; I know it is one of the forces – and a relevant one – that is at work. Thanks for your hard work and for all the others that have an interest in this subject.
Andre’
As always, appreciate your posts as it help me make progress.
I agree with your thought,”So apparently there is something else at work,…” As time allows, and unfortunately there isn’t much of that these days, I will be looking at:
1) Declination. It seems that just as the position of the Earth, Moon, Sun can have a gravitational/electrical universe impact, so to will the position of those 3 bodies relative to each other on the Ecliptic.
2) Speed. One way that the moon may manifest itself on the emotions of traders, via gravity/electrically, is through speed of longitude &/or declination. The greater the speed, the greater the compression or charge.
Ugh. So much to know and understand, so little time available during the day.
SC
Hi Both,
The moon moves fastest at perigeee (6% faster according to this website) and slowest at apogee as the mutual gravitational pull, pulls it back towards us).
I know Andre was talking about RoC of distance but I agree with you Steve that speed may have a bearing.
The other factor I believe is Mercury and Earth’s declination may be a factor?
http://cseligman.com/text/sky/moonmotion.htm
17.6,
Agreed. FWIW, wrt above comments, here are some Moon #’s:
Date Declination Phase Speed
10/5/2014 -6.33 1/8 NM 14.78
10/6/2014 Perigee -1.75 N/A 14.79
10/7/2014 2.94 FM 14.69
10/8/2014 7.4 FM 14.46
10/17/2014 11.74 N/A 11.85
10/18/2014 Apogee 8.58 1/8 FM 11.85
10/19/2014 5.06 1/8 FM 11.92
BTW, bought your book, liked it, very helpful with insight,
SC
thank you all for your hard work and generosity in advancing this discussion. It’s time consuming for sure. I again am focused on full moons within the apogee/perigee cycle. A unique example is the full moon of 4/28/2010 accompanied by the highest high tide of the year on 4/27/2010 and apogee occurring 5/6 at maximum distance from FM and NM (last quarter) = Flash Crash. This set up does not occur again until the full moon of 5/7/2020. Are we looking at a 10 year + 9 day cycle? and the next flash crash on May 16, 2020?
Peggy,
Interesting observation. Also, on 4/27/2010 the lunar declination was on the ecliptic (on Sunday 4/25) at -9.56 and going more negative. Interestingly, on 5/6 it had returned to the same declination spot but going the other direction. Lets go back about 1 year to April 2000. I don’t have info on tides that is at the ready, but: Apogee is at 4/24/2000, with FM @ 4/18/2000. However, declination is at Max. Warrants further investigation.
SJC thanks for your thoughts. In looking at 2000, there are some components in play – the “flash crash” of that time period was 4/4 which was a New Moon that occurred between 2 perigees with the 2nd and 3rd greatest KM distance and which were also “out of sync” in that they were max time from either a NM or a FM. The lowest low was 4/14 (FM 4/18). Highest high tide for the year (1/22) occurred near the FM (1/21). so there is a different set up here although I detect the components of “instability” – ie: FM with highest high tide, perigee or apogee with max or min distance (km) or max or min time from NM or FM. more to learn.
Jonathan, well done on having the courage of
your convictions, that took guts.
At the end of the day Phil, you hit the nail on the head in that there was not enough selling conviction. And I have already highlighted one of the main causes of this, if not the absolute key cause. There is simply no private participation in these US stock markets. Participation levels are reported to have fallen to just 5% which is an historic all time low. It may even be lower. My data is a month old. The only buyers are central governments, pension funds and other institutional interests. The public are terrified of the market as sentiment on this very board highlights. The trend has always been up until the 200 day MA was taken out on the S&P500.
Until this happens, bull market all the way. Buy the dips. 12 more months of this.
Jonathan, it may be a stretch to consider the sentiment on this board as being representative of the public.
5% retail/private participation rates in the US stock market. That says it all to me. Based on this historic all time low, the public are incredibly bearish and pessimistic. And if they’re not participating, who is there to sell? I put my case forward again that this isn’t a market top. Instead, it the consolidation period before the blow off top coming 12 months from now. The public quite simply have to be involved in order for it to crash.
But Jonathan, stocks as a percentage of total household financial assets are nearing historical highs. How can you suggest the public is incredibly bearish and pessimistic then? They may be talking that way but are they acting that way? It may be the disconnect here is the public is no longer investing themselves but instead relying on advisers now to a much greater degree than ever before. But what’s the difference?
Average Joe Sixpack don’t discuss stocks anymore. This is the fact., Peachter’s term “social mood” is still down…. Just ask the young people who could not and would commit to anything in life.
The mother of all stock bubble is still ahead of us.
Today’s is a good day to sell bonds
$NYDNV (NYSE down volume) confirmed the lack of sell pressure in the early hours of trading….before price confirmation.
I am 1 of the lucky one who bought SPX740 and I don’t see a reason to sell (yet!).
The omnipotence of the FED will last longer than most bears can stay afloat.
http://stockcharts.com/h-sc/ui?s=$SPX&p=60&yr=0&mn=1&dy=0&id=t89974075909&a=369084353&r=1412811661014&cmd=print
rallied to the 130ema on 30 min and for now is a lower high so I’d watch out…
those who bought this fiction are going to scream for real
Jonathan, What is the source of the “5% public partcipation” number? That just seems intuitively unrealistic. Still, it is probably true that 60-70% of Americans don’t have money to invest in stocks as US wealth and income has become incredibly skewed. I think the more relevant factor is that many of the investor class (wealthy) are greatly under invested in equities which has contributed to the solid bid under the market for so long. To your point, as long as there are buyers below still looking for a chance to get in, it will be tough for the market to break hard.
As I understand it, and it varies, but the reality is that 10% of Americans own about 90% of stocks (google it)…not hard to get to 5% only being active
Jonathon, tomorrow’s market action should tell us a lot. The US dollar index fell half a percent and snapped its uptrend on the charts since mid-August. However, I’m not sure its blowoff rally is over yet. If it’s been rising due to anticipation of the Fed ending QE, then it’s going to take perceptions about that end of QE changing in order to finally top the dollar out. And that means stocks have to collapse first.
Volatility picks up on a change in trend, so I don’t think it’s any coincidence that we’re seeing increasingly large up moves and down moves on a daily basis in the S&Ps as we work our way back down to the August lows. I expect we’ll see today’s rally sold as soon as tomorrow, just as we’ve seen on prior big bounces since the top, but we’ll obviously find out if that’s the case in about 10 hours.
The day the VIX breaks out over 17 is probably the day the downside volatility expands dramatically, and the next move down in the S&Ps will probably trigger that VIX move as the S&Ps take out last week’s lows.
After those lows are taken out, there’s not much from a technical perspective to stop the selling other than the 200 dma, and that’s going to be pretty brief support if indeed we are heading into an illiquid 2008-like event as a result of the Fed trying to stop it’s money printing, which is precisely what has happened every other time the Fed has tried to stop since 2008. The only difference is now that the debt bubble is even bigger and stocks prices are even higher.
With as many ETFs and derivatives as there are today in the world, a broad market collapse can happen very fast, especially when the European markets already have year-long tops put in and many broader US indices, like the IWM small cap ETF, have large year-long tops as well. I wouldn’t underestimate the possibility that a flashcrash type decline could unfold and lead to a complete wipeout as soon as next week… all in my opinion.
http://www.bespokeinvest.com/thinkbig/2014/10/8/big-down-day-followed-by-even-bigger-up-day.html
Totally ridiculous comments by Jonathan: margin debt at all time highs, record low cash balances, investors intelligence survey at extrême bullish, but for some reason the public is negative on stocks. Laughable.
Public has been tapped out by real estate debacle, college expenses hyperinflation, and lack of salaries keeping up with inflation. I guess that is why there is low levels of retail investors in stocks. According to the decade cycle market will probably rise sometime between now and 2016, cause year 4 4Q to year 6 1Q has been up the last 9 decades.
Nicolas, are you still short the miners?
JDST and DUST are bucking broncos today.
http://stockcharts.com/c-sc/sc?s=RSP%3A%24CPCE&p=D&st=2011-11-23&en=(today)&id=p64797109301&a=197681529&r=135
put call isnt signaling anything positive either
Can’t see. The same or less can be found in Cobra public chart (page 1) linked below.We need to wait a day or two to see if there is follow-thru …the true reaction.
http://stockcharts.com/public/1684859/tenpp
What about other breadth indicators? Nothing positive? lol.
many of us have good TA skill, but novice traders please be aware that TA’s predictive power is very very limited.
I’m sure some people like bantering or ribbing each other.
I just hope it doesn’t get out of hand.
Johns done such great job gathering some keen minds.
I’d hate for a few posters getting too personal with cutting remarks to piss him off and disband this site.
Let’s try to keep it civil, eh?
Angree +1
Agree.
Good article John.
Can you shut up ,Jonathan Scott.
Don’t throw shade on Mr. Scott.
Found a possible fourth year that may be how this year plays out. 1994. October rises into mid month, falls into end of month. November hard sell off. December down till the 11th, and then steady rise into the end of 1995. The decade cycle is one of the most useful long term indicators and points to a strong 2015.
Chien-Jen… I thought you just agreed to be civil? Jonathan Scott is civil – just because you don’t agree with his position does not entitle you to be rude.
No need to silent Jonathan Scott. His contrary opinion gives a balanced view of the market. ,..and is appreciated. It is your own choice to go long or short that determine your profit or not. never an opinion. The truth is that we don’t know the future so no opinion from any men is sacred.
We don’t have to agree but must act civil. Never insult.
John, I don’t know if you look and analyze the index targets based on P&F charts. The Russell 2K chart shows something that one cannot miss. The current peak compared to the previous 2 is stunningly similar. It says one thing loud and clear.
The downside target is in the 500s.
John,
Thanks for being so open minded, knowledgable, generous and steady.
Cam Hui shares your qualities and offers the a great explanation for equity participation rates:
“My conclusion is the people who matter, i.e. those with the money, are fully invested in equities. By contrast, those who don’t have any money are either apathetic or possibly afraid of stocks.”
http://humblestudentofthemarkets.blogspot.ca/2014/10/can-public-be-apathetic-and-be-all-in.html
Cyclical, if you buy Sp500 on Oct then sell on May next year, very profitable. So better to look for a buy rather than a short on this Oct. I agree with Jonathan Scott , it could make all time high soon. Btw, the market very volatile, up big day 1 down big day 2, so useless to predict the market for a longer term, just day trading if you like.
History could repeat. In 2013 Sp made a higher low on Oct 9- the day of FOMC meeting minutes as well, the market ran up continuously until Sept this year. The Fed boosting Sp500, however Crude oil doesnt agree
usd/jpy di not rise with the usa indices. 1st time ive seen this in a couple of yrs
grt risk/reward to buy usd/chf 9491 hit bottom of rising channel
US futures building on gains.
Yesterday was the closest the SPX has got to the 200sma and yet bears have failed yet again to follow through. Normally a large percentage daily gain like we had yesterday is associated with a significant decline but al Markets have done is pullbacK less than 5%. Maybe its still tie to buy the dips after all
Yeah, after 1 day down + 1 day up, SP500 failed after a week
Thanks all. New post is out.
Jonathan has taken the time to explain, in detail,
his investment rational.
That should be respected, whether you agree with
his views or not.
Agreed – goes for everyone on the board.