

A rally in equities yesterday on increasing under-the-hood deterioration.
1. SP500 breadth measures not confirming:
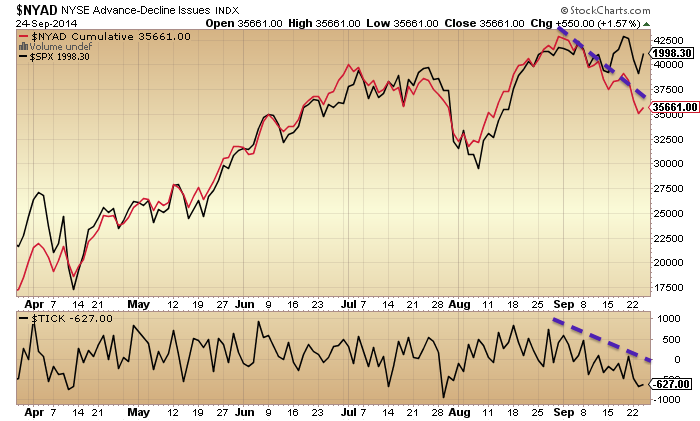 Source: Stockcharts
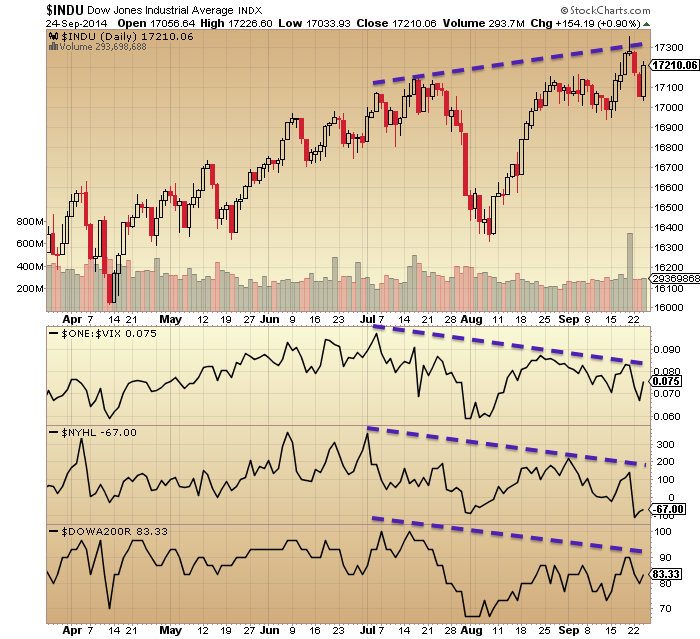
2. Dow negative divergences persist:
 3. Nasdaq breadth divergences continue to worsen:
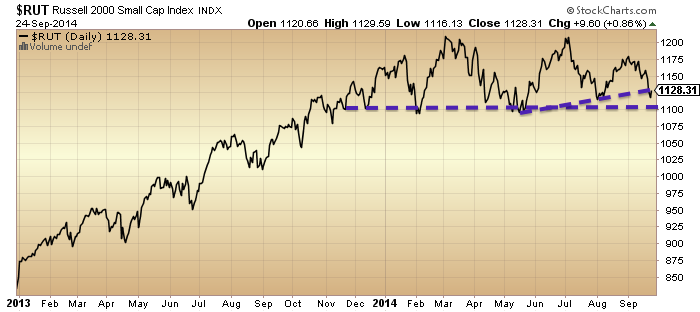
 4. Russell 2000 made the smallest bounce of the four and remains in danger:
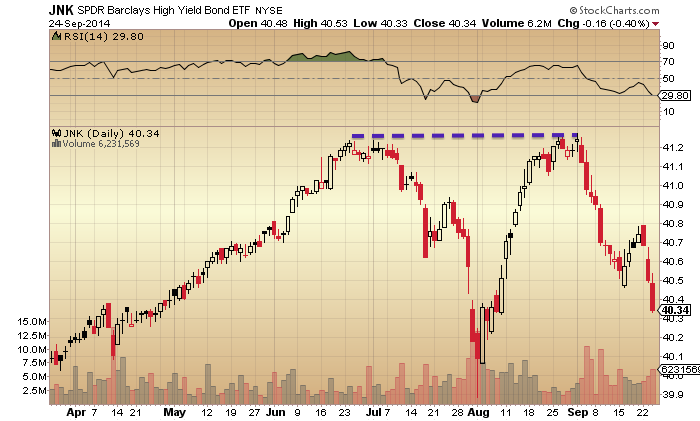
 5. Junk bonds had another big down day:
6. Financial conditions have diverged since the start of July:

Source: PFS Group
7. Skew reached reached a par with its highest ever (in 1998) at Friday’s close:
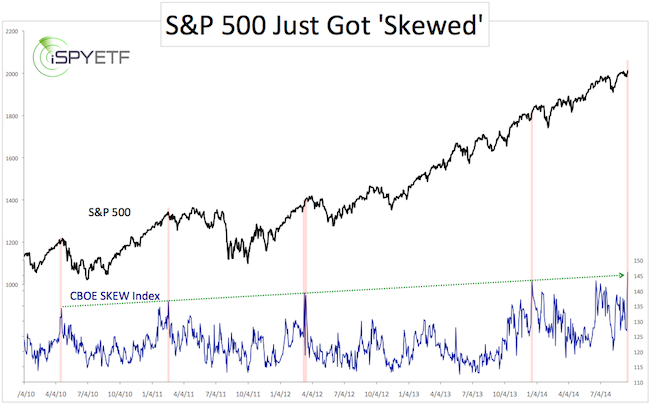
Source: ISpyETF
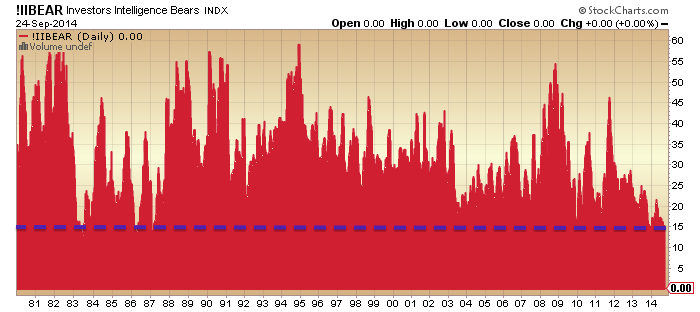
8. Investors Intelligence sentiment remains at the extreme this week, with 15% bears:
9. Rydex allocations also remain at the extreme at the end of yesterday, with the Friday-Tuesday sell-off not having dented confidence:

10. Margin debt for August was released and shown below. The February high remains in tact, which adds further weight to the speculation peak having occurred close to the smoothed solar maximum around then, and weight to the stock market being at the end of its topping process. September may seal it, subject to how the month closes.
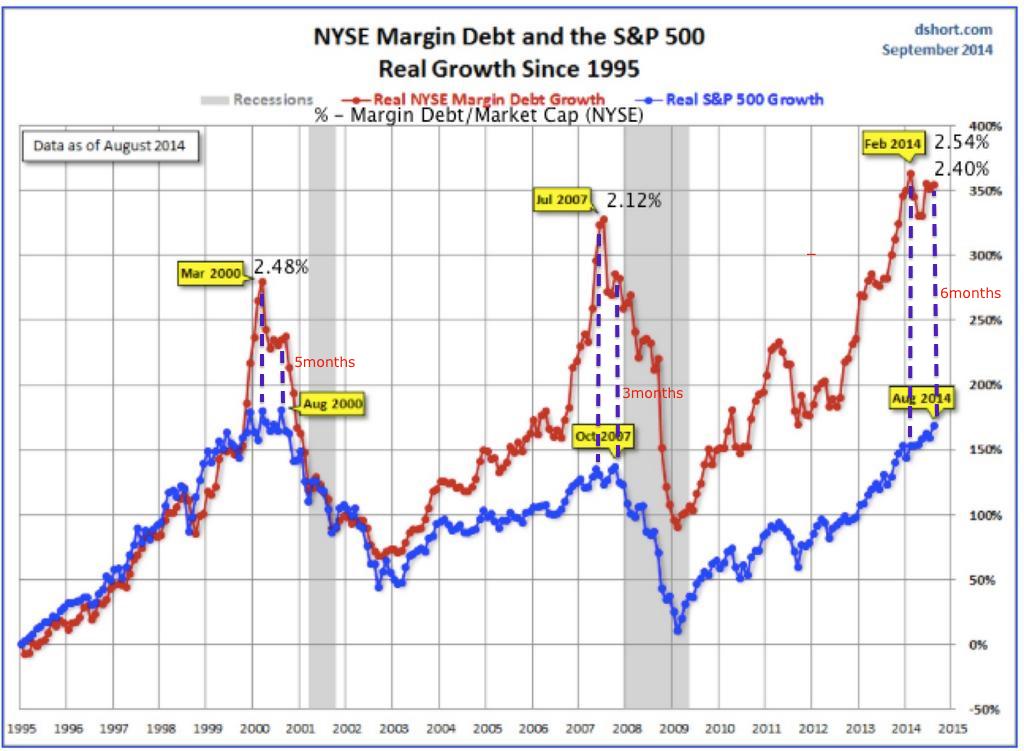 Source: DShort / UKarlewitz annotations / My annotations
11. Gold, Euro and US Dollar positioning continue to suggest a reversal is likely, in favour of gold and the Euro and away from the Dollar, with associations for equities.
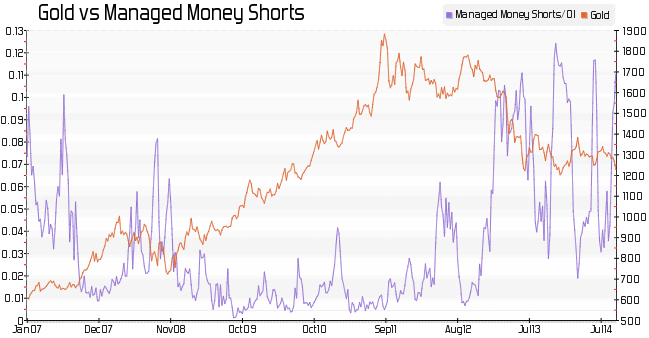
Source: @Market_Time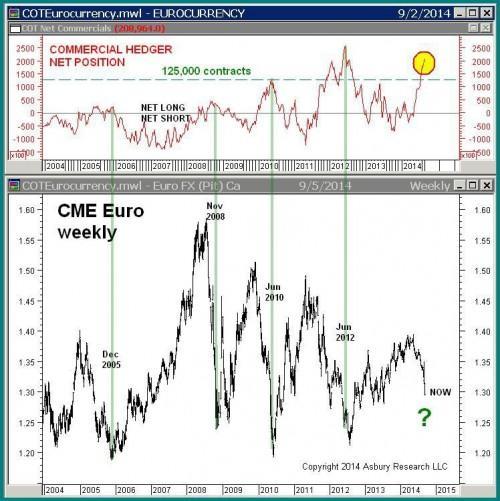
Source: @Sobata416
12. Sornette bubble end flag for US tech has now reached 0.6, which is an extreme high reading historically:
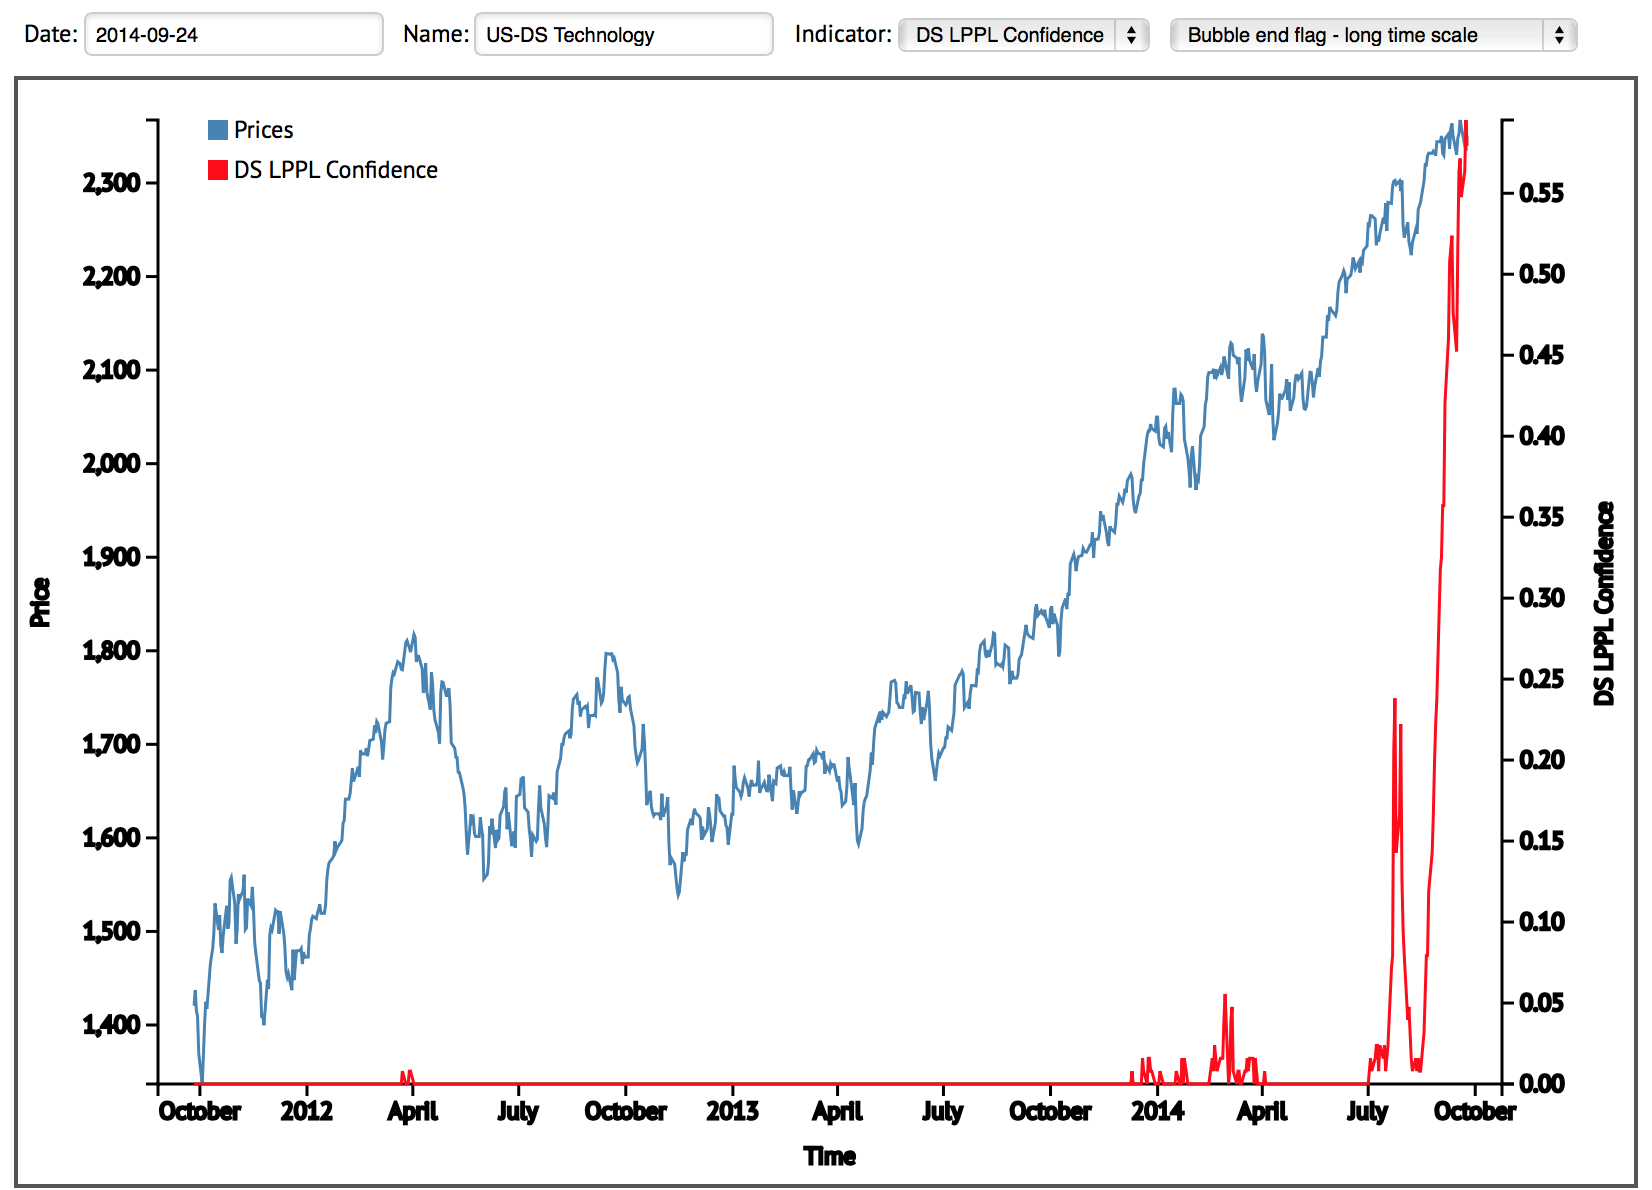 Source: Financial Crisis Observatory
Four trading sessions left in September. I stick with my call that we have peaked. The internals reveal a very weak picture behind yesterday’s rally in equities, whilst we have an associated brewing reversal across gold, Euro and USD. I believe the breakdown in small caps and junk bonds in September, together with the potent negative divergences in equities this month have secured the broad markets peak and that we will not extend to year-end. The latest solar and margin debt data add to this likelihood.
In the very short term, yesterday’s rally broke the bearish momentum, setting up alternatives for how this week ends. Based on the deterioration covered above, it may be that yesterday’s bounce is quickly engulfed by the bears, to continue the downtrends, or it maybe that stocks can rally back up a little further and precious metals leak more before breaking (down/up respectively) in earnest. Either way, the next two weeks down into the full moon of October have great potential to trigger the true breakdown in equities and the squeeze in PMs.

Thanks John excellent again. I agree 100% with everything you suggest here. I also stand by my reversal call on silver Monday despite weakness today it hasn’t yet plunged to lower lows whilst gold has.
All in all I think the dollar tumbles at any moment along with equities and there is going to be so much short covering in the metals shares and a plethora of dollar sell stops triggered.
CheerS
http://stockcharts.com/h-sc/ui?s=$SILVER&p=D&b=5&g=0&id=p14500039300
Thanks Allan
Hi Allan,
Do you think that silver has more to go on the down slide? I’ve been watching very carefully over the past 18mths and I’m keen to buy a lot but am teetering on when? Any info would bring me further understanding of where this garbage is going.
Thanks
Mat
Hi Mat, Can it go lower? Of course but I think the downside is limited. This is a seasonally strong period for PM’s.and as far as I am concerned silver put in a very convincing reversal on Monday.
Sentiment in metals is at all time lows, comparible to lat least ast years collapse and I still stand by my conviction that a broader market collapse will see the metals as a safe haven option.
There is now almost a 100% agreement amongst anaylysts that gold is headed for $1k. That in and of itself says they will be wrong.
The dollar has had it longest rise in over two decades and a look at the daily chart reveals a move that simply will not be maintined much longer and WILL come back with a thud.
The bottom line is that I buy when nobody else wants to buy and at present you can hardly give silver away. The mere mention of buying silver is greeted with almost unaminous disbelief……combine Monday’s reversal and that’s good enough for me
http://stockcharts.com/h-sc/ui?s=$USD&p=D&b=5&g=0&id=p99551608483
Thanks again John I appreciate your enorme effort for all the updates.
I have a question what do you think of the (plunge protection team?)
I have got a stong feeling every time we have a dip goverment steps in to prevent a crash..
In my view a big dip is possible like Martin Hays is projecting 13 or 18% in the large caps..
But a quick turn arround because the fed will step in is very likely?
I also have also seen a youtube (2010) that confirms this theory ( conspiracy)
see Links..
http://www.marketwatch.com/story/did-alibabas-ipo-signal-a-top-in-the-stock-market-2014-09-23?link=kiosk
Thanks Carpediem. I have seen reference to the PPT ever since I began trading 10 years ago, but no evidence for it. I attribute the dip buying to the rising solar max, believe we can pinpoint the main drivers as dumb money and buybacks, and now we are through believe we will see participants unwittingly less inclined to buy the dip. I am aware central banks are buyers of equities, but they too are subjects of the sun and have an interest in buying low selling high.
Buying at shallow dips still seems bizarre given all the divergences and headline crash indicators. I find it unlikely that there are investors with that much money whom would also be that naive.
Carpediem, no conspiracy it’s fact. Other Central Banks are buying ES futures with the US Fed blessing so why not the US Fed? They do it however very covertly.
I do however believe as Martin Armstrong regulalrly states that you can’t manipulate against the main trend indefinitely.
http://www.nakedcapitalism.com/2013/11/speculation-about-whether-the-fed-manipulates-the-stock-market-becoming-more-mainstream.html
We can’t agree on everything John 😉
Thanks,
This next full moon and the moonwobble will show us..
I also believe in the indicator of Mark Cook.
His time frame for a correction (given in July) is august/sept/okt..
http://www.marketwatch.com/story/this-top-trader-sees-3-clear-dangers-for-stocks-2014-08-18
JAHYX is the first to break to new lows.
http://stockcharts.com/freecharts/candleglance.html?ABHIX,STHYX,FHYTX,PHYDX,NHFIX,MHCAX,PHIYX,GSHIX,PRHYX,JAHYX,HYG,JNK|D
Blackstone back to 2007 levels but sideways this year and underperforming the SPX.
http://bigcharts.marketwatch.com/advchart/frames/frames.asp?show=&insttype=Stock&symb=BX&time=20&startdate=1%2F4%2F1999&enddate=1%2F12%2F2012&freq=2&compidx=aaaaa%3A0&comptemptext=spx&comp=spx&ma=6&maval=67&uf=8&lf=4&lf2=2&lf3=32&type=4&style=320&size=3&timeFrameToggle=false&compareToToggle=false&indicatorsToggle=false&chartStyleToggle=false&state=12&x=22&y=17
Price rules but more warnings.
i note that mark cook in that marketwatch peice does not allude to the long bull market of 1987-2000.
Great observation karl345345. Cherry picking data is what makes for bad analysis.
And that is why THIS SITE is so AMAZING!! John’ impartial look at ALL DATA available is what draws so many of us here.
Thanks again for yet another set of factual presentations John.
Thanks Purvez
John thanks for another great post. Just to add some things that im seeing. SPX has been range trading for the past several weeks between 1980 and 2010. Some under and over shoots. From my experience this means it is building energy for the next move. You could argue that it is high basing for a break to the upside but the technicals you have shown dont support that. However, there is the subject of sentiment and the fear and greed indicator remain at contrarian buy signals. All in all a very mixed picture. My personal view is this. A correction to the 200sma at 1900 at the very least. Possibly 10% but unlikely to be significantly more.
Duncan, it seems strange that various sentiment / fear and greed indicators can be so divergent (meaning shouldn’t they all pretty much move in tandem?). Have you seen any discussion of this. Per above, it can lead to cherry picking those indicators which support one’s personal forecast.
Imo its unlikely all indicators will agree but it would be helpful if they did 🙂
Another example is JNK which continues to sell off but IBB looks like it is breaking up. Both considered to be risk on/off indicators.
Even Nikkei took out its Dec 2013 top recently.
Do you mean the CNN fear greed indicator? If so it is a poor performer, like AAII is. The stats argue to disregard both those. Yes, noted on IBB, it needs reigning in here.
John, I believe the cnn indicator to be useless too. It is created by journalists and has no backtest or academic backing.
Duncan please will you tell us what sentiment and fear/greed indicators you are following? I believe John has shown quite a few that are not providing any contrarian buy signals.
Look at the NYSE ARMS (TRN) and VXV/VIX ratio… both exhibited capitulation…
HVA
Thanks John. Well done. SPX turned up right on the new moon. ( imagine that).
That low can be a wave 1 down ( as you are expecting), or a c:4 down. The rally yesterday doesn’t confirm which it is just yet. We need another day or so to determine if this rally is a wave 2 ( dead cat bounce) or a wave 5 ( that may or may not make a new all time high).
Some of the comments sound like they may disagree with your work. I don’t understand this. The indicators you present are facts. A person can’t disagree with facts. Bazaar.
Thank you for sharing all your hard work with us.
Kindest regards
Thanks GN
amazing what 20 min. of price work can do. Odds now favor the bounce yesterday as a correction.
The 5 legger down now has greater odds of being a wave 1 down, like you are expecting. The 1999 spx high is an “a” wave of an abc, or it is the entire abc correctional bounce. Lets hope it is the “a” wave and we are all given a chance to get short on the “c” wave back up.
Abysmal durable goods result. All but wiped out July rise. Of course the talking heads are looking for bright spot.
I believe that yesterday was the last best day to sell
Randy Phinney covered it well on his video at rightsideofthechart.com
http://rightsideofthechart.com/partial-rise-trading-strategy/
i wish i could edit comments because i would have added
my puetz crash window is 10/2 – 10/11
John, what’s happened in the last half hour since start of market be considered a ‘waterfall’? Just asking 🙂
By that I mean when sell programmes trip sell programmes, and leveraged traders have to sell positions to meet margin calls. It would need to gather some momentum from here, and make those key technical price breaks.
banned by elvis (THE BEAR! LOL)
September 24, 2014
pretty sure the divergences on the AD and various oscillators are not going to let this bounce too far before getting a break of the mid-channel on the Keltner (55,4.0,110).
still looking for this outcome of near or below april levels for the first target before a tradeable bounce…
I’m sure I don’t have to tell anyone here too much but it is getting VERY interesting. Testing the July congestion zone,50 dma and mid Sept low. Take these three out and it gets nasty.
http://stockcharts.com/h-sc/ui?s=$SPX&p=D&b=5&g=0&id=p10961467554
http://stockcharts.com/h-sc/ui?s=$NYUD&p=D&yr=0&mn=11&dy=0&id=p31287662176&a=367854604&r=1411654701186&cmd=print
Great chart Elvis
you know for all the bear/bull back and forth here and elsewhere that never sheds light, one might just go back and look at the net line trading posts and the Powertool Trading Strategy article I posted a week or so ago. This net line elder chart strat would have told you most of the story and then if you add the simple internal indicators and apply some of the same rules you could have seen this weakness leading to where (i think! lol) we are headed…
Fractal analogy from Mar 2014 implies this current very short term down move should decline below the Sep 16 2014 low and also below the 50d-MA. For NDX that is minimum 4000. Maybe you even get 3960 today but that would be a huge one day move equivalent to almost 40 SPX points.
1979 spx cash; done
rth 62 still to come
xrt 85.80 will harken doom!
rth = regular trading hours (?)
xrt = ??
and what is the “net line elder chart”?
Might be the time when fibonacci retracements become a signal on timing turns as shorts take profits.
uncle buck moved just above trendline from 11/08
if we see reversal here today the deal is cemented
presage the passing of mighty POMO!
I did say several days ago to “GET OUT NOW”
The $ looks super bullish chart wise! Fundamentally, huge amounts of debt is denominated in $’s, therefore, as commodities drop and the $ rises, it gets harder to meet their obligations which forms a self reinforcing cycle of lower prices (producing more). Also, the only time the stk mkt has dropped in such positive credit conditions was during the 1930 to 1932 deflation. There was a culminating credit crunch in 1932, similar to what happened in Europe when their interest rates spiked significantly albeit briefly higher. I really don’t see the reversal prediction for the $, €, and gold.
Kent, we had discussions about the dollar and gold in previous threads. There are split views. i am firmly of the belief that this time the dollar tanks with sticks and gold goes much higher.
Notice what is happening to gold this AM, I now it’s early days bit I do believe it indicates how the market is going to respond.
Foreign holders the biggest buyers of US stocks in recent time will sell like crazy and dump the dollar.
Great article, as usual, John. This week definitely looks and feels as if the bear has finally started.
Cheers Kent
Hi Kent,
I respect your position. It is the majority opinion. From my perspective the dollar is a representation of federal reserve power. That is what this entire upmove in the stock market has been about. Fed power has peaked. The dollar will realize it. Most people perceive treasury bonds to be tied to the dollar. From my perspective, treasury bonds represent the united states. They do not represent the fed. Two entirely different things. Audit the fed passing in the house tells us that something may be changing. i’m short stock market, long treasuries, long gold. i realize i could be wrong but thats the way i see it
Specie, with the majority? I don’t like that and I don’t think it is accurate. But nontheless, the majority is right during trends (wrong on both ends). There is a huge long term negative bias on the $ based mostly on fiat paper money has always failed. The £ has been around for 500 years, and everything always eventually fails. But that does not mean it is eminent and there could be a lot of big up and downs between now and then. I respect your opinion and I am not offended but I am such a contrarian, it hit me to hear I am in the majority.
Buy the dip! Short gold and long Nasdaq :p
And…….to those that said that gold stocks would get sold off with the broader market:
http://stockcharts.com/h-sc/ui?s=NUGT&p=D&b=5&g=0&id=p15249351432
I still FIRMLY believe that this recent knock down in gold and gold stocks and push higher in the dollar was to assist big money to position itself on the other side of the majority for this now imminent sell off in the markets.
Interesting: from hedge fundie Douglas Kass -
ANYTHING AT ALL COULD BE SEIZED BY THE RUSSIAN GOVERNMENT VIRTUALLY WITHOUT RECOURSE
THE NEWLY PROPOSED RUSSIAN BILL IS QUITE PERVASIVE FROM ALL ACCOUNTS. MACDONALDS, OIL FIELDS, BANK ACCOUNTS,
does Doug think it is any different here? if so he is a fool
absolute breadth may be indicating some kind of short term capitulation that might be bought…hmm but the other internals are still screaming!
1960?
Stock Trader’s Almanac’s presentation of the January Barometer indicates that 2014 with end the year lower with 88.9% confidence. Since January of 2014 was down by 3%, the overall return for 2014 should be negative which would require a drop of about 8% or more before end of the year. Two other indicators which presage lower prices were the failed “December Low Index” which was triggered in February (price dropped below the December low), and the “First Five Days” indicator which states that the first five days of January predict the market performance for the year.
http://stockcharts.com/h-sc/ui?s=$NYUD&p=D&yr=0&mn=5&dy=0&id=p44992229571&a=367853692&r=1411657178968&cmd=print
the break of the midchannel on the keltner virtually assures the lower channel will get a visit given the divergences
Powertool Trading Strategy article
http://stockcharts.com/h-sc/ui?s=$SPX&p=D&yr=0&mn=4&dy=0&id=p99807631829&a=368144488&r=1411657897850&cmd=print
Allen, if they EVER wanted to paint a massively bullish chart; the chart of the $
should be a textbook example. The chart even has perfect symmetry. Interpretation = very bullish.
I read a piece this morning that the Fed is manipulating the $ higher to provide a cover for institutions to sell.
Wish I had your guts on gold but for now I’m going to believe my lying eyes.
One chartist pointed out to me a long time ago the 1073 area where the original extension of gold occurred on the way up to the top in 2011; so that may be a reasonable target. GS has done a good job advertising the 1050 level. We know they lie; so it will be either higher or lower than 1050; probably higher.
There remains a bullish possibility however if and when prices would recover dramatically after briefly penetrating the June/December 2013 lows.
Ditto, Ecletic. The pattern is perfect plus it is 6 year base formed from two 3 year cycles forming an Elliott 1-2 1-2 and has therefore started a 3 of 3. This has all occurred after a 22 year bear market! It appears to be in the runaway stage where everybody says it is too overbought, gone too far too fast, way ahead of fundamentals, and it just keeps trucking. And of course everybody is fundamentally bearish long term.
Take a look at the SSEC, it is very nice chart wise as well.
Mark Faber, Ph.D. (Gloom Boom Doom report):
“Only asset class that is cheap is gold and silver shares”.
http://marcfabersblog.blogspot.com/2014/09/only-asset-class-that-is-relatively-and.html
They are down but not cheap.
15 might be slv buy but it could easily go to 9
http://stockcharts.com/h-sc/ui?s=$SPX&p=D&yr=0&mn=4&dy=0&id=p99807631829&a=368144488&r=1411657897850&cmd=print
2011 or 1932? it is one or the other or BOTH! lol
I guess 2011 ….. it was 13 days from the top july 22 till august 8 with mercurius retograde on the first of august….
so now we have Sept 19 till Oktober 7th mercurius retograde Okt 4…
Remember mercurius retograde was in…… 1929/1987/2008/2011…..
I have seen so many times people get emotional things go wrong..I bought tw cars during the periods Both where a pain in the ass all bad luck…
1929
Wow, that $SPX chart is exquisitely bearish.
IBB not partying
2 hour dow is suggesting that a break soon of 16550 leads to 15300 before a substantial bounce – now mind you I am projecting DOW 3500 by 2020 with a better than 50/50 chance of it going below 600 by then
Robert Prechter I presume?
todays action from a net line trading point of view suggests that 2008 needs to be taken out for uptrend to be confirmed again
dow 600!!!!!!!!!!!
is your name Robert Prechter?
sorry Ben, my comment was meant for elvis
of course it was!
send me your dealers number
1-800-gondown !
also doubles as an escort service…
BBE THAT is funny!!
http://stockcharts.com/h-sc/ui?s=$SPX&p=60&yr=0&mn=1&dy=0&id=p44060306236&a=369084353&r=1411661979270&cmd=print
That is some turnaround from this morning.
John, many thanks for the huge amount of work
and effort you put in to solarcycles and are both gracious
and generous enough to share with people, much appreciated.
Thank you Phil
iwn down by 2% then we will get a close of -3% and -2% or more on the headline indexes
bear flag ibb 10min
gon full tatties
if RUT closes below 1080 by tomoro then we cud get black monday
yes it is surprisingly strong in the face of other weakness…
Steve T & John,
Although I prefer most of the time to be a silent visitor, I can’t resist to tell I’m relieved with finally some follow trough today. I hope this will turn out the way you anticipate, John and your patience and persistance will be rewarded. Would you do things the same way next time, knowing to spot a top can be this tough?
Steve T, I follow your fractal-analog with great interest. I was wondering, assuming the base of your analog is the moon at apogee, did you notice similar analogs in the past when this- moon at apogee- happened?
Peter.
Peter, yes, the fractal that I am tracking also had moon at 2nd farthest distance away at apogee back in Jan 2014. See this comment post:
https://solarcycles.net/2014/08/01/fire-is-lit/#comment-24734
SPX fell to a low of 1905 or just 5 points above my upper downside target range.
That is why I have some confidence and boldness speculating on the downside currently by following this fractal, because both periods Jan 2014 to Apr 2014 and Jul 2014 to Oct 2014 also had moon at apogee coinciding with the two farthest distances away.
Thanks Peter. It’s been my toughest challenge. I can’t regret my analysis, like I said. But the power of the solar max is something to behold. Need to wait to see if the markets now conform to my expectations before thinking on that properly.
Second that Peter, I have to admit this morning
thinking, oh no hear we go yet again.
Hi John – Can you share some insight on your strategy to exit your shorts after the initial leg down on expectation of a partial retrace? Understood if we’re talking about positions with time decay, but for other positions (e.g. inverse etfs) would long term hold be better for tax reasons? sorry for the naivete, but looking for insight on my long short position. thanks in advance
My positions have no time limit, so up to me when I close. I am expecting a swift and deep bear leg followed by a slower multi-month partial retrace wave back up. And I have % targets for the former. So my aim is to get out before the multi-month retrace as best I can.
John, do you know where the CBI is? I’d guess we’re nearing the double digit level in.
He hasn’t mentioned it. But certain ‘bounce’ indicators are now flagging predictably. I’ll post one below.
call HMRC for any tax queries
Dow won’t crater until next year, this is a short term down move. The administration needs a strong dollar and markets until the end of BO’s tenure next year. Then the reset. Market will end the 2014 with modest gains. When the market does decline precipitously in 2015, whoever the new administration is can assign blame to the previous one. Classic.
man the real PTB down give a hoot who is in the governement – that is a reality show for suckers
THEY OWN THE EMPTY SUITS
EMPTY SUITS=CORPORATE TRUTH
http://stockcharts.com/h-sc/ui?s=$VIX&p=D&st=2013-09-25&en=today&id=t43015598011&a=368924046&r=1411664907825&cmd=print
surprised this hasnt been mentioned today
also as long as it stays above 14 there is more probable downside
glad you posted it, that is why i was asking posters here what they’re VXO targets might be. I keep thinking something between 100 and 200 by november shouldn’t be a suprise.
Love your charts Elvis. Helps me a tons with my analysis.
technical trading.. on the morning of 4th. redline green set ( shown here before) sell triggered… on 15th downside target area given by tools hit .. on morning of 16th .886 algo ( shown here before) triggered long.. on morning of 19th upside target given by lines hit then 886 algo triggered short….. price now at key level.. for John’s analysis to take hold the lower line of the red set must give way…we shall see
http://stockcharts.com/h-sc/ui?s=$SPX&p=5&yr=0&mn=0&dy=16&id=p43183431046&a=338320968&r=1411664523360&cmd=print
slater9 please can you update your chart to show where the target lines from the 19th to the downside will be. Because surely ‘that’ is the point that has to ‘give’ for John’s analysis to be right.
Thanks in advance.
lower line of downsloping red set… note… that is where price closed….time to decide…
Thanks slater9 for your answer below.
elvis, I read your posts with interest,
however you use multiple indicators so
it’s difficult to keep up(for me).
May I ask the top 2/3 that are most relevant currently?,
if possible to say, TIA.
Elvis: “All the world’s a stage, And all the men and women merely players; They have their exits and their entrances”. As You Like It, W.S. : )
A market downturn as the hero is exiting the drama is easier for the audience to understand than during his presence.
what hero?
there are heros?
I thought it was common knowledge that this culture is a criminal enterprise and to eat one must participate in the cannibalism?
JOHN – PPT IS the vernacular for THIS:
http://en.wikipedia.org/wiki/Working_Group_on_Financial_Markets
it is also the reason guys like Jamie Diamond can continuously violate the law without actually going to jail. Manipulation is the market and is necessary to keep the illusion alive. It’s just a video game.
Thanks for the link, but it kind of reiterates that the notion of a PPT buying up equities is just speculation by others and not in keeping with the remit of the group.
???????????
I guess the republic is still intact then! lol
1960 would be an interesting number that would start a fire
NDX uptrend – clearly borked: http://scharts.co/1uCP0rZ
Short SPX 1968
Wise men say only fools rush in, but I can’t help buying the SPX after the apogee on October 8.
October 18
this is just a short term correction. I’m sure Yellen will soon start printing money to buy stocks. GDX is up 0.07$ today, good opportunity to short some more.
SPX 2 hr – http://screencast.com/t/uKHpTyOX0N
And the daily – http://scharts.co/1ARG9EP
Have to say, the odds at this point favour a deeper correction. The bulls had their key reversal yesterday and have totally fumbled it and gotten themselves steam-rollered today.
Russell looks like death.
Nicolas, some sort of equity correction suits the FED now imv,
as it exerts downward pressure on longer term US rates.
Look at the US 10 over the past week.
Just as they exit QE, perfect timing.
Nicolas, think about what you ate saying for a minute?
“I’m sure Yellen will soon start printing money to buy stocks. GDX is up 0.07$ today, good opportunity to short some more”
The volume was less just average today? Good thing there were no sellers. Otherwise the market might have plunged…
Keep hearing people talk about the fear in the market on todays selling……..FEAR!!!? What a joke!
Overnight ES futures are currently up over 5 points. That says to me that after a day session 30+ point plunge that there is almost total complacency.
Wake me when the futures are down 40 points overnight!
Again John,
Great work mate 🙂
Cheers
Mat
Thanks Mat
Considering that John is proven correct in a big way today, there is not a lot of euphoria amongst the bears. This tells me there is more downside to come.
Carpediem from Holland,
You should have a look at the AEX in august 1987 and then for instance an hourly chart of the Dow, september 2014. What is unfolding now is stunning identical.
Peter.
Thanks, can’t make those charts can you show them ?
I’m watching the bradley 1998 and 2014 with the charts of the Dow …
Amazing you can see the same fractals buiding up…
My best guess is that we will continue heavy selling like in 1998
and by the end of oktober or arround november 6(double bottom) we will see a strong rebound..
If the bradley 1998/2014 stays on track..
Carpediem,
Thanks for enlightening us with your posting. Based on past pattern I use I do think major low in US Equity may be made on 7th/8th Oct 2014 but no second fall which you expect around Nov 6. My pattern says rebound from 8th and santa rally up to Jan 2015. Just to update.
A major distribution day yesterday and trin ended over 2. That combination in recent times shown below. However, if we are post second chance we should generally keep falling despite hitting short term oversold/bounce criteria. Not every day down, but bears should retain control with little chance to get in or out. Yesterday’s swift engulfing conforms to that, plus the close at the lows. So, open minded about today, maybe a bounce, maybe we just keep falling, let’s see.
Chart from @hertcapital
Good stuff, John, I covered my shorts yesterday and will get back in today. I agree with all except the little chance to sell part.
Thanks for this John… watching… wondering if it’s time yet… Trying to reconcile the Solar Cycle with the Wealth Effect… Bernoulli observed changes in Utility with changes in wealth… within that framework deep pockets may have more staying power than we anticipate and especially if the small investor has not yet participated fully… What do you make of the individual investors lack of participation?
wow, Duncan has joined us bears, we welcome u. x
John”s largest short has struggled for months right where the tools say it should
http://stockcharts.com/h-sc/ui?s=$RUT&p=M&st=2002-1-1&en=(today)&id=p40012891676&a=224691875&r=1411722112800&cmd=print
SPX is now in similar position
http://stockcharts.com/h-sc/ui?s=$SPX&p=M&st=1987-01-01&en=today&id=p66760428759&a=155290822&r=1411722529674&cmd=print
Australian ASX and English FTSE look like train wrecks about to gather momentum
http://stockcharts.com/h-sc/ui?s=$AORD&p=W&b=5&g=0&id=p94524329579
http://stockcharts.com/h-sc/ui?s=$FTSE&p=W&b=5&g=0&id=p67435998926
CBOE Volume & Put/Call Ratios spiked to 0.77 yesterday, keep watch today
If you look at the charts below you can see the same fractals in the Dow in 1998 and 2014 only now on a smaller scale ( excuse me for my dutch/english)
compare these charts with the bradley 1998/2014 that I have posted before…
http://www.marketwatch.com/investing/index/DJIA/charts?symb=DJIA&countrycode=US&time=7&startdate=1%2F4%2F1999&enddate=9%2F26%2F2014&freq=1&compidx=none&compind=none&comptemptext=Enter+Symbol%28s%29&comp=none&uf=7168&ma=1&maval=50&lf=1&lf2=4&lf3=0&type=2&size=2&style=1013
READ THIS FROM ZEROHEDGE!!!!! what a shockerhttp://www.zerohedge.com/news/2014-09-25/5-us-banks-each-have-more-40-trillion-dollars-exposure-derivatives
If history will be a guide: 1998?
The decline will be about 6 weeks total so end of Oktober..?
http://finance.yahoo.com/q/hp?a=06&b=01&c=1998&d=08&e=01&f=1998&g=d&s=%5EDJI%2C+&ql=1
A good piece on credit markets’ impact on equities, and why the jury is still out on whether a full-fledged correction is at hand:
http://www.minyanville.com/special-features/from-the-buzz-banter/articles/bonds-credit-markets-vix-vix-curve/9/25/2014/id/55750
Carpediem, how to upload a chart over here?
You managed it, I can’t figure it out.
Peter,
I just made a copy of the link but it does not always work just try…
Now that a 14 year SSN peak-to-peak has likely been established, and that this length is typical of Maunder Minimum-type solar cycles, I’ve had a look to see how that relates to global temperatures: http://www.woodfortrees.org/plot/rss/from:1800/plot/hadcrut4gl/from:1800/plot/sidc-ssn/normalise/from:1850
There’s an obvious correlation between sunspot numbers and HADCRUT4 global temperature measurements over longer terms, but HADCRUT4 volatility over the short term makes it is pointless to look at just one solar cycle on its own.
The RSS (satellite) temperature measurements since 1979 are generally accepted to be more accurate, and reveal that the recent “global warming temperature anomaly” is probably not as significant as we’ve been led to believe.
Either SC24 sunspot numbers will have to rise dramatically soon (which seens highly unlikely), or global temperatures have some catching-down to do… The latter is what has been happening, as longer term temperature trends turned down around 5/8 years ago: https://bobtisdale.files.wordpress.com/2014/09/06-164-month-giss-trends.png
So perhaps we should be preparing for Maunder-style much higher food, energy and precious metals prices, more war, more social and political upheaval, more tulip-type bubbles…
Carpediem, I have a chart, but how to load it up like you do?
That won’t do, It’s a screenshot. I tried Stockcharts, resetting the dates, also not succesful. Doesn’t matter, we know the outcome.
I think John said that if the chart is available on the Internet then just post the link on a separate line and it will either appear here or at least people will be able to click on it to go to the site.
However if its a chart of your own then send it to John and he’ll arrange to upload it.
I think this all was said either further up or in the last post. Can’t remember.
Follow up on my earlier post this a.m. from the same writer re: credit markets moments ago:
Based on credit derivs, today has the potential of getting ugly for stocks. Adding $SDS here for a trade $SPX $SPY
Things are obviously getting volatile —
Bill Gross quits Pimco and is basically retiring to Newport Beach, Ca. Perhaps he has seen the HYG chart…
JANUS SHARES OPEN UP 37% AFTER BILL GROSS JOINS FIRM
Mark, (et al) any consensus yet on which SC most represents SC24? Tks.
Eclectic, SC16 is definately the most obvious comparison both in terms of sunspot numbers and the shape of the SSN chart. But I think it would be misleading to concentrate on any one single previous cycle.
The period from SC15 SSN peak to SC16 SSN peak was 11 years – right on the average. But the 14 years since SC23 peak is unconfortably similar to Maunder Grand Minimum average. Also, the sun’s motion around the Solar System Barycentre (SSB) was very chaotic during all previous grand minima, and this is happening again now (started in 1985 and will continue unti 2040). This chaotic motion did NOT happen during weak cycles 10-16 (1850 to 1930) – so they were weak ordinary cycles, rather than a grand minimum that we’re facing now.
Having a closer look at the solar cycles leading into the Maunder period, there were sunspot peaks during 1612/3; 1625/6; 1637/42 – quite long gaps between them but SSN’s in excess of 100, so nothing particularly unusual (but the data from then is very very sketchy). Interestingly, the tulip mania peaked early 1637 coinciding with the SSN peak (around 105) of that cycle.
So I personally don’t think that any one previous cycle can tell us what will happen next in terms of speculation, but overall it could peak anytime between now and say late 2017 (but most likely late 2015 to mid 2016 I think).
One thing I’m becoming surer of, is that we have already entered a solar grand minimum which has yet to really manifest itself (and is probably disguised by contrived data from the science agencies and governments).
failure of 50ma retest – absolute breadth wants to help but just a sign now not a signal- BPSPX is breaking 70 which is a sell –
http://stockcharts.com/h-sc/ui?s=$NYUD&p=D&yr=0&mn=5&dy=19&id=p99246718224&a=367853694&r=1411742093718&cmd=print
JANUS SHARES OPEN UP 37% AFTER BILL GROSS JOINS FIRM
Read more: http://www.businessinsider.com/janus-shares-surge-after-bill-gross-joins-firm-2014-9#ixzz3EQtnBf00
USD/yen is completing rectangle topping formation with abcde touches complete. Strong Euro sell off has historically implied severe losses for equities to follow (08, 11).
Gold may be establishing temporary bottom and short covering rally to 1240-1260 zone may happen anytime. Longer term perspective is bleak however IMHO.
More then 1 year of consolidation in huge triangle formation does not typically result in short move. Instead, prolonged selling would be expected with triple digit target sometime in 2015
Good point Bunnell ! That’s why I’m heavily short GDX and GDXJ and looking to add more on any strengh or weakness. Easy money.
has alot to prove between 1180 and 1280…
Today moon is in Scorpio (zodiac sign of death and life). Usually negative day for markets over last 8 years (about 60% down, 25% flat, 15% up). Though it is the last day of the favorable moon cycle (full moon plus four days to new moon plus four days).
Hey Steve,
WHat date do you have in mind for the final low and what is your target?
for those with the gift of foresight! lol
http://stockcharts.com/h-sc/ui?s=SPY:$TRIN&p=W&yr=20&mn=0&dy=0&id=p79279577866&a=369102109&r=1411745426568&cmd=print
here is comes the no pomo slowmo
last time this chart looked like this was 2011
http://stockcharts.com/h-sc/ui?s=$NAHL:$NATOT&p=D&st=2012-10-10&en=today&id=t54347424236&a=369189956&r=1411750207104&cmd=print
1983.34
close below here and more downside next week
Nice day for the bulls stateside, RUT still lagging.
Next week promises to be interesting.
SPX closed the week below 1986, a good indicator that the bear is (barely) in control. My personal opinion is that the next 2 weeks End of Sep / Beginning of Oct are the most important weeks for the bear within 2014, as these weeks present the most likely opportunity for the crash within 2014, where John’s scenario may be playing out. My expectation is that the SPX will decisively break below 1985 and set up a panic sell off after that.
On the other hand, the bear case would be substantially weakened if the whipsawing continues and/of if SPX goes back over 1900 level.
The analysis outlined by Steve T may be playing out.
I had a top projection for SPX around 2015 and NDX around 4010 targeted in the Fri or Mon Sep19/22 time frame, with the probability leaning towards it being Monday. But both targets were already achieved on Friday Sep 19 and began to sell off later that day.
Last week in past comments in the recent articles I mentioned brutal Mon/Tue Sep 22/23 drop and big rally mid-week (i.e. Wed) before another big ugly down day on Thur Sep 25. I also stated that Friday Sep 26 would also be a big rally day (similar to Wed).
Now theory and reality are two separate things. Do we get one final downleg leading towards a lower low to bottom out on Tue Sep 30? Monday Sep 29 should be a mixed trading day that ends towards a negative close, but then the same could and should have been said for last Wed Sep 24 and the markets ran up to extreme levels and closed right at the daily high. Anyways, Tue Sep 30 should be an ugly day if the pattern continues on cue …
I preferred to take on a short position on Mon Sep 29 but the market ran up so much late Fri that it hit my target range to initiate a position. I am hoping my “earliness” does not end up costing me my head or sending me into twitchy fits early next week.
Steve T thanks for repeating all that. I’ve a couple of questions.
1 Do you have a target for the downside for Tues 30th?
2 Is there a further pattern after Tues 30th?
Thanks in advance
purvez, I would shoot for a Tue target of SPX 1954. Anything below that would be gravy and it depends somewhat on the Mon close. And of course the pattern continues after the 30th … since that should be a temporary bottom it should then go back up.
Solar minimum mini ice age crop failure climate doom trade: reading the book that TheEarthAbides mentioned (and finding that, to this reader at least, the author holds some unpleasant and strange opinions), while also watching the wheat chart.
After all, if he’s right, this should be bottoming soonish and then heading for the moon: http://scharts.co/1uwrqgx
Saturday science: the fourth phase of water – why juicing, spring water, sunshine and swimming in the sea are very good for you… http://youtu.be/Jd2tPtqSyNY
SPX 2 hr – internals went from fairly to massively positive yesterday, before tailing off slightly into the close, with price (heavily weighted to the large caps, as others have noted) taking a looooong time to respond: http://screencast.com/t/mcVmDsH7
Daily SPX – can I get a retest? http://scharts.co/1mAC1G6
Steve T fascinating analysis, thank you.
Im looking to fade fridays pop in the markets. I remain short at SPX 1968 and looking to add. My analysis is saying fasten your seatbelts we going for a ride downtown 😉
Who said i was a permabull?
Welcome to the Dark Side Duncan.
I added already on Friday.
Carpediem,
John provided me a link. The AEX in 1987 (daily) and the Dow Jones Industrials (hourly) in 2014.

thanks…let’s see what happens next
Yes but you don’t show what happened next on the AEX.
Very interesting comparison but need to know what happened next on AEX please.
Thx
I would also agree with others that for a 2014 deep
correction to unfold, the next 2 weeks are key.
I hate to say that, the market very volatile and SP500 could run up to new high then down strong.Be careful !
WHATS THE RED LINE ON CHART = BTK ?
bloomin eck is it IBB ?
This may not be anywhere near as long a time frame but it’s coming back down to reality very soon as well
http://stockcharts.com/h-sc/ui?s=$USD&p=D&b=5&g=0&id=p74095856225
Every weekend I read the Technical Market report from Mike Burk, an expert on seasonality and internals. As usual he weights the positives and the negatives. This is – as far as I know- the first time ever he writes only 3 words on the chapter ‘positves’: “There are none.”
so it is time to sell everything, put on the crash helmet and hide in the bunker. Lol.
So what is your view? Lol.
Any prudent traders must recognize both the bullish and bearish side of a market and decide to either buy or sell. When someone says about market positive “there are none”., I know this guy is totally biased. Another clue….this is the safehaven.com site where it is posted.
I rather learned abut the market from a balanced approach….and let me try this:
———“What do you think I should do in the stock market?” Old Turkey (Mr. Partridge) would cock his head to one side, contemplate the question, and with a fatherly smile he would say, “You know it’s a bull market.” ……….
I will continue to assess the market…but there must be something positive out there! because if I am overly bearish and wrong, it cost money! LOL.
Allen, the following link is confirming your views. Also, price is right up against a long term trend line. It’s either a new bull market and gold, and the miners will be absolutely devastated; or……
http://www.marketanthropology.com/
eclectic, anyone that thinks that the Fed is going to, or even in a position to anytime in the distant future, raise rates whilst the rest of the developed world debase, believes in pixies at the bottom of the garden.
This next market collapse will see the introduction of QE 4.
John, check your solarcycles email please. Thanks.
Those paying attention will have noticed my forecast has been right for the last 3 weeks. But with 200 posts on every blog my post gets swamped and nobody seems to read it. That’s okay, but I can’t help wondering how much proof and hard evidence people need to be convinced.
My forecast is still somewhere on this site and there is no need to change it. So a bit about longer term cycles. Assuming a harmonic cycle structure I thought there had to be 2 cycles beneath my 4.5 year quasi apo/peri cycle. And there is. Samuel Kress found the 210 week cycle some 30 years ago. And guess what; every 9.3 year cycles is exactly 4 kress 210 week cycles and 2 4.5 year apo peri cycles.
I think this explains why some people seem to think there is a 7 year cycle. But there isn’t. The 2007 high was not the end of a cycle, but the start of the 4th kress cycle within the first 9 year cycle within the first 18 year cycle. The 2009 low was the end of the first 9 year cycle.
And now we are in the 3rd kress within the 2nd 9 year. My 4,5 year quasi cycle gives a top in December 2014. As we are now within the 2nd 9 year, 18 year momentum is declining. So I assume the turn comes sooner than in 2007. Using the golden ratio on the 3rd kress cycle we get q1 2015. So I expect the final high roughly around februari 2015. As longer cycles (18 yr) have a larger amplitude than shorter (9yr) cycles, the 2015-2018 decline will be stronger and deeper than in 2007. That’s another reason this decline needs more time.
The 4,5 year cycle accurately gave the 2009 low. Earlier I said that was early 2010. But I found the apo peri tables are estimates and have an ‘error’. The difference between the December 2008 low and the January 2010 low was 10 km (in my average). And that falls within the error range. So now I can say gravity gave a double bottom by the end of 2008 and the begin of 2010. That means this cycle gave the 2009 low with an accuracy of several weeks. Not bad at all. So no need for wishful thinking; the trend is still up for some months to go.
Next week will be up into oct 3rd. That’s what my tides tell me. And we are at the end of a quarter, so that usually means up, even in the first days of October as new pension money will be invested. After that the low on October 10, but that as was in my forecast as you know. Or not.
Have a nice weekend.
André
Andre – I have been reading your comments with interest, so they are definately not lost on everybody..
I also have found it increasingly difficult to find all the interesting comments while quickly scrolling down through the plethora of useless intraday price updates – but that doesn’t mean you should stop posting.
For several years John’s site here, and the comments on it, have been one of the most unique and groundbreaking sites on the net, and it would indeed be a pity to see that creativity drowned out.
Mark,
Thanks for the kind words.
been reading your previous posts the last couple of days, trying my best to follow as you go in great detail…not lost at all. will follow closely the next few days and see how your ideas develop. good call on the 26th turn. keep up the good work as this site makes one feel like we are working on a common goal.
Andre’
Trust me, your posts are sought, followed and analyzed. There are a lot of posts here, and I have a multi-daily routine of finding the golden nuggets. Damn day job gets in the way of that!
For what it’s worth your posts have served as an inspiration for me to construct my own SoLunar model that synchronizes the annual 365.25 day Solar Cycle, the 29.53 day Lunar Phase Cycle, the 4 year Perigee/Apogee Cycle, 27.212 day Declination Cycle, and Mercury Cycle. Unfortunately, that implies 12 years per cycle, and it is best if my model has 4 cycles. That is a whole lot of back price data! Not a problem for the equity markets, but it is for some markets like Nat Gas,…it will be interesting to see if my results correlate with yours. It will largely be based on some of the same inputs, but the methodology is different.
I know I don’t have to tell you that is what is exciting about time of research, if it works – exhilaration, if not 😦
Hi Andre,
I read everyone’s comments on this site whether it is a sentence or War and Peace, and that includes yours.
I have been watching the tides myself after reading your comments and doing my own research and I am looking for a low on 8th October. We shall see.
As you know, I follow my own 17.6 year cycle which I believe now is derived from the 8.8 year lunar apsides cycle. My cycle is composed of 4.4 year bull markets and 2.2 year bear markets. I am starting to believe that the 2.2 year cycle is derived from Mercury’s 88/89 day cycle with Jupiter/Saturn/Uranus/Neptune and Pluto, which coincidentally is 3*lunar cycles of 29.5 days. 9*88.5 days is approximately 114 weeks or 2.2 years.
What I have been missing is a shorter cycle to help time turns to a reasonable trading period. Whatever I have tried works for a while and then an inversion kills it. Inversions are no good for trading unless you know when they are coming and can thus stand aside.
I’d like to say thank you for sharing your thoughts on this site as despite your ups and down, the rationale has been clear and you have helped me (and others) research along side you.
PS – the longer 17.6 year cycle diagram that I posted links 2000, 2002, 2007, 2009, 2011, 2013, 2015, 2018. But in my book I show how this picks out 1929, 1931, 1942, 1947, 1965, 1974, 1982, 1987 among other notable dates. 2015=1980=1945 according to my research.
PPS – someone asked why I am not expecting a low lower than 2009. That is because the mid cycle low tends to mark the end of the worst 2009=1974=1938. The 1942 Dow low was 92.92 which slightly exceeded the 1938 Dow low of 98.95 but the lowest low was in 1932 at 41.22. Where 1974 was the lowest low at 577.60.
Good luck and keep posting,
Kerry
Thanks and interesting post.
Cheers,
André
Kerry,
Did you ever take a look at the apogee/perigee table? I use the average between every apogee and perigee as an indication of the gravitational cycle. I see all sorts of cycles here. And never inversions; all inversions come from my tides.
The major advantage to this approach in my mind is that we don’t need to assume any cycle length; the table shows you the date of the turns.
Cheers,
André
Prosperity and more power to you
typo; 120 week kress cycle.
Do not be discouraged, i write your TP’s in a notebook. I feel you are doing very well.Do not give up on this site.Time will bare you you out..
Thanks for your support – it helps.
Ahhh! Thank god, I was going crazy trying to make the math work. Was running out of fingers!
🙂
Buyers found in every level of SP500. It could make a new high then down big. Who know what gona be. However, best time for day trading making a quick buck
I’m following this site for a couple of weeks and I read some older updates.
Steve you asked me a question I did not answer:
Steve
September 24, 2014
Carpedium,
Often wondered, Do you find the Helio or Geo based Bradley better to use, or are the both always giving good signals? Thanks,
SC
Reply
I look at both indicators the Geo and Helio when both have the same turning dates the trend almost for certain changes.
Both are very usefull only the inversions are frustrating
Also the zeroline is important.
I have a good site where you can follow the numbers of the bradley graphic past and future.
http://www.4shared.com/zip/Bw8PpHWs/Bradley_-_Siderograph_1950_-_2.html
I hope you can use it..
John.
Carpediem,
Appreciate your insight, and the link. Damn those sneaky inversions!
SC
For anyone interested, here’s a well researched essay about a period in history which was uncannily similar to the present: https://mises.org/daily/2564
New “bank money” was being created, and the traditional real money (silver) was in oversupply due to the recently discovered mines in South America. This caused prices to quadruple, while interest rates stayed low, so people naturally looked for alternative forms of currency – like tulip bulbs.
The search for alternatives to fiat currencies has caused biotech shares to rise by 2500% over the past 20 years, which might feel like a bubble; but tulip bulb prices rose by 5000% in only the last three years of that bubble.
Like.
Latest Mark Hulbert gold sentiment stands at -46.9. Many were expecting it to take out the June 13 lows, however at that level sentiment is still the second lowest ever.
I’ll buy when nobody else wants to, Nicolas short all you like!
Steve,you may find the views of the so called ‘deconstructed Bradley’ interesting:
http://bradleysiderograph.com/donald-bradley-siderograph-2014/
Currency moves can go on a lot longer than anyone expects, especially strong moves like we are seeing in USD, XJY etc. Just bring up a USD 10 year chart. The USD has already broken 85 and looks to be on its way to 89 with no resistance in sight. The dollar seems to have become the flight to quality as the rest of the world economies implode. Armstrong has said the greatest spikes in the dollar are war driven and we are now in the War Cycle. I am neither bull nor bear at the moment
but cautious as some sectors are at inflection points that could drive the markets higher. Energy (around 11% of S&P) is sitting on its 200DMA. Financials(16%) meme is buy cuz rates are going up with no chart divergence, Tech (19% of S&P) seems to be finding support at the 50DMA, Utilities, one of the defensive sectors, are being sold. $CRB is sitting on long term support line and we all know commodities are broken.
I’m neither bull nor bear at the moment…just observing. Use caution.
Martin Armstrong said in 2012 that interest rates would begin rising in 2013…..Ummmmmm?
rates sub 1 on the 30
There are some (MA) who believe that before an equity market crash, the market needs to go parabolic (or at least have a trend acceleration higher). I can understand that, and there are certainly plenty of examples. However, most of those examples seem to have taken place in an environment of stable solar cycle period recurrence, debt expansion, and inflation of one degree or another. If the back ground environment is instead a low inflation, low interest rates, and debt contraction (especially non-government debt), is it reasonable to expect financial asset prices experiencing a parabolic run prior to a crash. In essence, the financial asset mis-pricing doesn’t come from the substantial rise of prices, but the collapse of underlying fundamentals. Any thoughts appreciated.
SC
Steve we just saw a bubble in small caps and biotech. In 2000 it was the Nasdaq. Before that it was the Nikkei and before that it was gold and so on.
Speculation is at all-time extremes, that’s bubnle enough for me.
Martin Armstrong’s comments Friday
“The S&P fell and bounced off of the Weekly Bearish Reversal at 1965. Once again we rallied. It is hard to see where is there a bubble when retail participation in the stock market is at historic lows”
OPEN YOUR EYES MARTIN!!
FB is worth nearly $30 for every single man, women and child on the planet. It doesn’t get anymore more bubble than that.
I’ll make a prediction now. FB goes the way of Myspace.
As an FYI … although im short SPX and expecting a pullback to the 200sma and possibly more. I dont think this is the top. Like My expections is another rally from end of Nov to the early part of next year (mar/apr) Then a bear market into 2016.
Andre, what is your view on the Kress ‘hard down’ portion of the cycle scheduled to happen end of this month/October? Droke at first believed it would usher in a new K ‘spring’ and the end of deflation/beginning of inflation; but I think he’s beginning to have second thoughts? Two links posted. Cheers.
http://www.safehaven.com/article/34937/a-look-at-the-coming-30-year-inflation-cycle
http://cdroke.blogspot.com/2014/08/q-on-kress-cycles.html
Eclectic.
With cycles you always have 2 questions : how long do they stand and when do they start. When adding them over long terms, the error builds up and a few month off is nothing.
I have a system that shows the cycles in real time. So the start is irrelevant. I know the periods are right (and I have some cycles beneath like 60 week, 30 week, 105 day etc. – all confirmed cycles by other analysts – that help with timing).
Besides, the 4,5 year AP cycle is an anchor for these cycles with an accuracy of 6/7 weeks max.
So I say the 120 week Kress cycle is still firmly up. I do expect a serious decline from 3 to 10 oct. But all the gravitational cycles are still up so I think the market is just cooling down from extreme overbought levels to create the energy for one last leg up.
Kress saw more than the 120 week cycle. So it could be the 120 day kress cycle (he even saw an 120 year cycle) gives the low in October, but I have to dig a little deeper to be certain.
And Kress had predicted the bottom in 2014 so timing is tough; even for Kress 😉
André
P.s. I think all cycles come from nature and then nothing is fixed. That’s the problem of Kress and that’s where Clif has his doubts. The 120 year cycle is twice the 56 year cycle. But even the 56 year is not always 56 years.
Saturn entering Sagitarrius from Scorpio next year(the border between Sag and Sco is the location of the Galactic Center (40 million suns). According to the Electric Universe Hypothesis (Thunderbolts Project.com) the earth was once in an insular solar system comprised of Saturn, Mars (warrior hero), Venus (mother goddess), and Earth. Helios, and Sol were both names for the planet Saturn in ancient times.
The Saturnian solar system only in the last few thousand years joined the Sun and its planetary system (Jupiter and the rest). Entertaining that Saturn may have had a key role in ancient formation of earth, it is possible that its movement in the zodiac could be of exceeding importance. Last time Saturn was moving from Sagitarrius to Scorpio (29 years ago) was 1985 and the market moved up for 14 years until 1999 and has been flat since. 29 years prior in 1956 the market moved up more or less for 14 years until 1971 and was down for a decade. 29 years more in 1927 the market went up and down and finished slightly up in 1941 and was flat from 1941 to early 1950s.
And historically every 29 years:
1898 Sat in Sag, up 15 years then flat
1869 Sat in Sag, up 14 years
1840 Sat in Sag, up until 1857 debacle
1811 Sat in Sag, up until 1825 decline
1782 Sat in Sag, up until 1792 decline
And the piece de resistance:
1720 Sat in Sag, THE SOUTH SEA BUBBLE happened with Sat in Sag.
Steve,
Do you know if electrical cycles are part of the electric universe?
André
Great question! I too would love to know the insight of Steve S., or any one. I have come to believe that our universe, emotions,… are driven by the inter-relationship of gravity (it can even bend light, amazing), cosmic energy primarily from the Sun (and in forms we know not of), and electrical (see the impact tiny comets have on the Sun as that capacitor is discharged). My working assumption is that the planets, especially the outer gaseous giant planets, impact electrically. The outer planets, although large, are too far away to have any meaningful gravitational impact, and they do not product solar like energy. Therefor, in my little made up world, it is the planetary aspects and cycles that generate a complicated dance of electrical cycles. For this view I have almost no proof.
SC
Electric Sun/ Galaxy/ Universe theory – “The Sun may be powered, not from within itself, but from outside, by the electric (Birkeland) currents that flow in our arm of our galaxy as they do in all galaxies. This possibility – that the Sun may be externally powered by its galactic environment – is the most speculative idea in the ES hypothesis…”
“Settled” science tells that nuclear fusion requires temperatures of “tens of millions” of degrees (50 to 100 million degrees is often quoted).
But recent calculations have determined that “…the temperature [of] the centre of the sun is about 6 million degrees. This is not enough for nuclear reactions”: http://www.highbeam.com/doc/1G1-140914910.html
So either we don’t understand how the sun works, or there must be some other form of energy flowing into it from elsewhere…
Eclectic’s article on the Kress cycle 4 15 year periods lines up with the Saturn in Sagitarrius bull market initiations. Last K spring was 1954 was up 15 years, flat 15 years, K fall 84 to 99 up 15 years, K winter 99 to 2014 flat. 1954 was within a year or two of Saturn in Sag, and 1984 was also within a year or two of Sat in Sag. I wonder if the entire Kress cycle is related to the 29.5 year Saturn rotation with Sat in Sag being the start of up moves and Sat opp Sag being the start of flat periods. As if Sat gets “charged up” like a battery when it is in direct alignment with the galactic core and then discharges this energy during the K spring and K fall periods, and is in a lower energy state as it rotates back around towards Sag during the K summer and K winter seasons. This somehow dovetails with the Almanac’s Yale and Jeffrey Hirsch “Super Cycle” theory that starting within the next year or two a 400% move will occur in the DJIA.
U.S. Investor Optimism Index Highest in Seven Years
Still far below 2000 levels. an it go higher from here? or it has already reached its terminal. Richer or poorer?
http://www.gallup.com/poll/177416/investor-optimism-index-highest-seven-years.aspx
Andre, according to the Electric Universe hypothesis electricity is the only force worth considering, gravity is minute in effect. E.g., if you rub a balloon and place it over crepe paper what makes the paper jump up to the surface of the balloon, it is electricity stored on the balloon. Similarly, if the earth and the sun are electrically charged it is electricity that makes them attract other bodies not gravity. So what keeps us attached to the planet is not gravity but a week electric charge that is pulling on us. Also, what makes tiny rocks or larger boulders ignite into bright comets is the ambient electric field in the solar system. A possible modification to the K cycle or Saturn cycle might be to look at each fifteen year cycle in light of solar min max so for example if 1985 was the start of K fall one would expect most of the gains to be during rising solar activity which a quick glance at solar chart seems to suggest. So a possible play of this K spring would be a slow start for another 5 years and then when SC 25 ramps up max gains in the DJIA, maybe starting in about 2019.
To your and others point, the following:
“Space is filled with a network of currents which transfer energy and momentum over large or very large distances. The currents often pinch to filamentary or surface currents. The latter are likely to give space, as also interstellar and intergalactic space, a cellular structure.”
Hannes Alfvén, Swedish electrical engineer, plasma physicist and winner of the 1970 Nobel Prize in Physics
“The whole of space is filled with electrons and flying electric ions of all kinds. We have assumed that each stellar system in evolution throws off electric corpuscles into space. It does not seem unreasonable therefore to think that the greater part of the material masses in the universe is found, not in the solar systems or nebulae, but in “empty” space.”
Kristian Birkeland (1913)
Steve S.
Thanks; very interesting. I always thought that the full moon effect was electrical and not gravitational. Still, not ready yet to drop gravity 😉
It is somewhat counterintuitive to think that the mass of space is made up more of energy than matter. E = MC squared. Energy = Mass * Speed (requires energy).
So Mass = Energy. More energy, more mass. Much like H20. The most weight per volume in water is in the oxygen which seems light and gaseous but must be somewhat heavy since a gallon of water is 8 pounds.
Indeed, interesting. Hummm, and the atomic weight of H=1, the most perfect # of unity and the atomic # of O=8; and 1+8=9, the final number of completion; and In there somewhere is a vibration to do, re, me,…LOV
Duncan, another great call.
Down we go.
The Bloomberg article discussed here recently
that highlighted the % of RUT and NAS stocks
now in bear markets, I just wondered how these
number corresponded to the longer term averages?.
Meaning can anyone provide stats on this,
has this provided an accurate warning of previous
severe corrections/bear markets when the %
of index constituents in a bear markets exceeds
certain levels?.
Hopefully this makes some sense, TIA.
As several of us already identified on the board this week is a make or break week. Futures are currently identifying major sell-off is imminent. The VIX chart last Friday shows a Wedge that the upper trendline was touched on Friday and then backed off. If we are going to head lower in SPX on Monday, I think we’ll break the wedge to the upside indicating a larger sell-off is in play, not a shallow one like last week.
Thanks all, new post is out
I can quite easily see gold getting under $1000 within the next 6 months.