2014 For Equities

Dow is up more than 5% five consecutive years now. A sixth such year has not happened before in history. A 5-year bull trend only occurred once before, in the 1990s, and was followed by 3 down years. Russell 2k rallies of similar size and duration to 2013’s (excluding accelerations from major bear lows) are shown below. In each case all the gains were given back the following year.

22dece1

Source: Fat-Pitch

2014 is the second year in the Presidential cycle, and is the weakest historically by returns, averaging flat. The logic for this is that is it a time for governments to deploy tougher, unpopular policies. The Investors Intelligence bull-bear ratio currently exceeding 40% also forecasts a flat return for the SP500 by the end of 2014, by averaging history, whilst the II bear percentage alone, around 15% the last 4 weeks, has historically produced returns of -5% to -20% over the next 6 months.

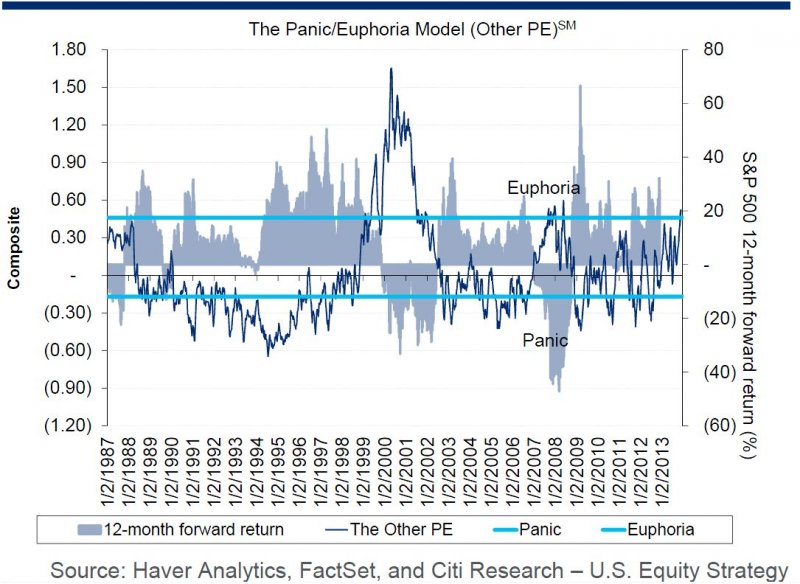
The Citigroup Panic/Euphoria Model, having crossed the Euphoria threshold, predicts an 83% chance of losses in 2014. Goldman’s analysis of performance following a year of 25% gains or more point to a median drawdown of 11% in the next 12 months.

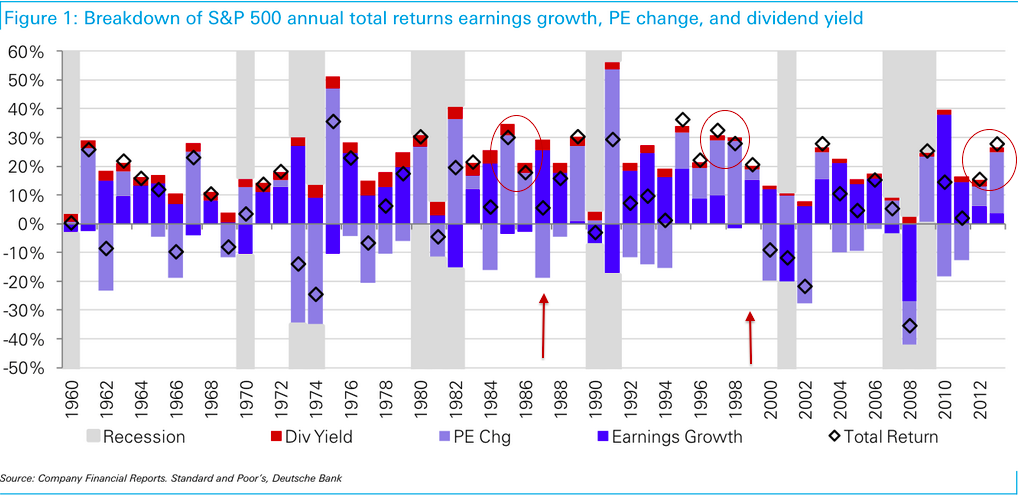
Next is a chart highlighting a couple of previous occurrences similar to 2012 and 2013 where stock index rises were dominated by multiple expansion, not earnings growth.

22dece3Source: Fat-Pitch

In both instances the following two years saw better earnings growth. But notably the next two years were 1987, stock market crash, and 1999, at the end of which the Dow peaked, suggesting a common theme of pre-correction exuberance.

Both the following charts reveal that 10 year stock market returns are closely correlated to deviations from norms 10 years earlier. The first correlates average investor allocations and the second market cap to GDP. I have added the blue horiztonal line averages, revealing both are overvalued currently, but one more extreme than the other.

22dece4

Source: Philosophical Economics22dece5Source: Hussman

The logic behind both is that mean reversion always occurs. The bigger the deviation build the bigger the subsequent normalisation, as ‘this time is different’ each time is disproven. For US markets currently, we see the second highest market cap to GDP valuation outside of 2000, the 4th highest Q ratio valuation and 4th highest CAPE valuation in history. In all the other such historic outliers, a bear market followed to correct the extreme, there was no orderly consolidation of prices whilst the underlying fundamentals accelerated to catch up. ‘This time is different’ thinking argues that because the Fed has suppressed cash and bond yields, equities have to be revalued higher, so this valuation outlier doesn’t count, and there will be an orderly normalisation of valuation as earnings and GDP will accelerate and yields rise slowly, without any crash in equities.

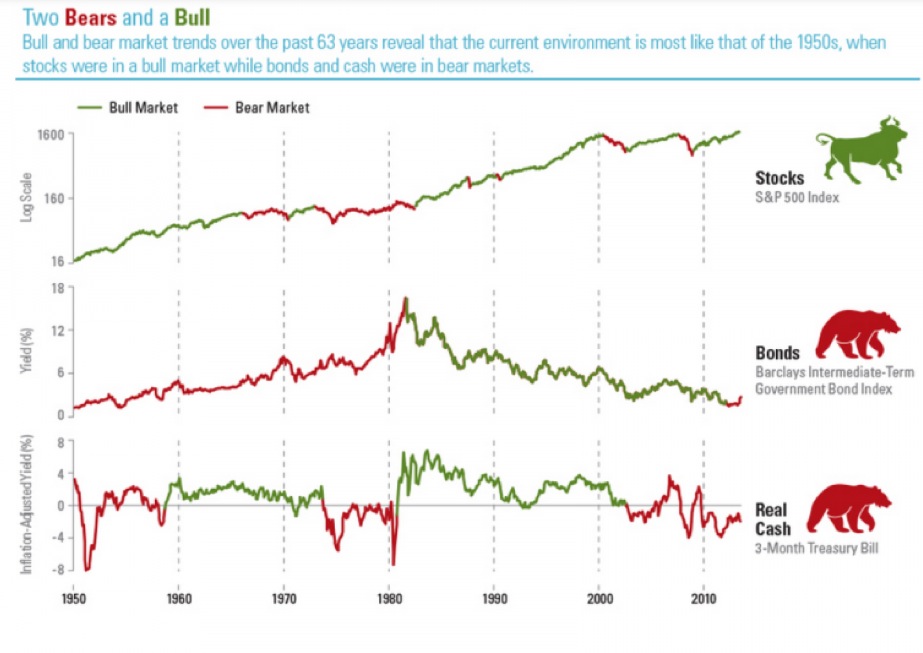
Interesting to discover that the rally in the 1990s was also at the time considered to be Fed-induced and prolonged. Also interesting to find out that the rally in 1980s, where price also accelerated beyond earnings, was achieved in the opposite environment to today where bond yields were record high and twice as high as equity yields at the time. So for no risk, investors could choose bonds at twice the yield, but still went big into equities as they were at historically cheap valuations and were bought up to mean reversion. Today, investors can choose equities at higher yield than bonds, but equities are conversely at historically expensive valuations. No ‘revaluation’ was required in the 80s, so maybe none is required today and equities will be sold down to mean reversion.

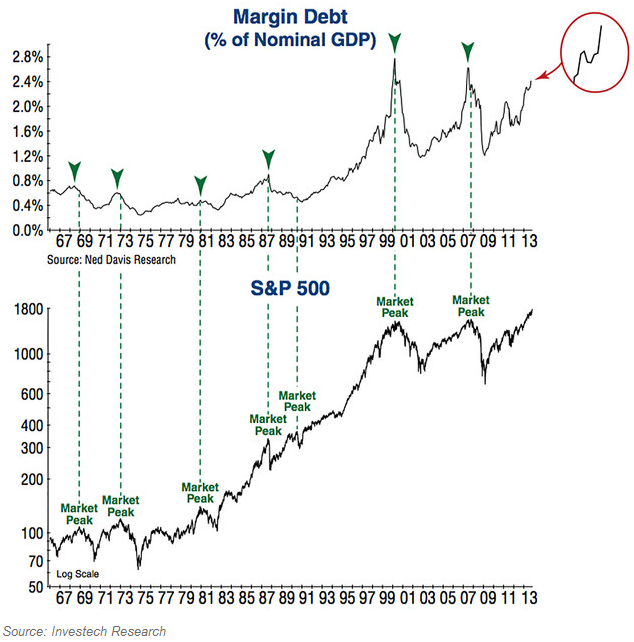
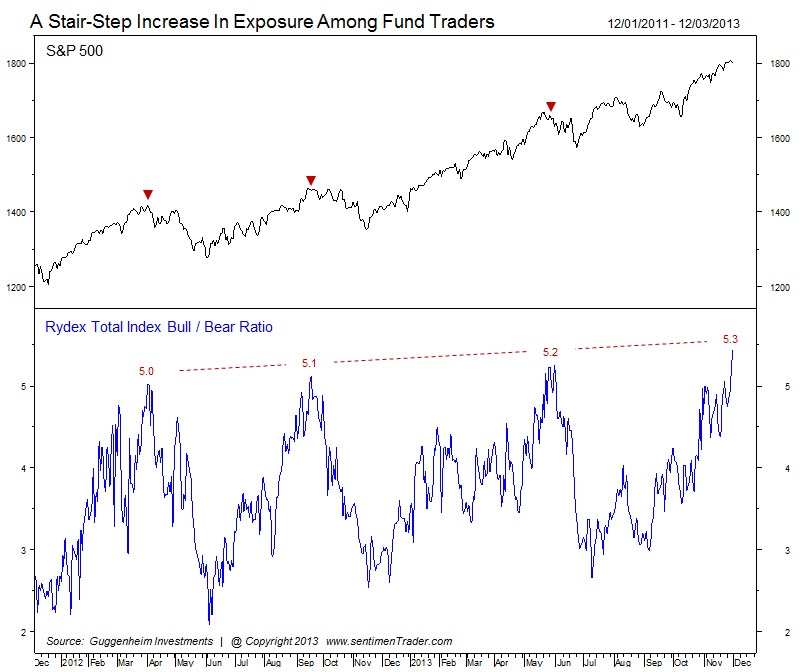
Spikes in margin debt and net investor credit balances to extremes have never previously been resolved in an orderly manner, always leading to bear markets or sharp corrections (as in 2011).
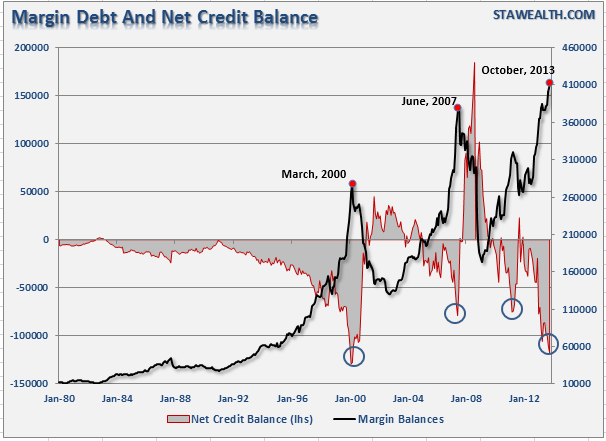
20dece4Source: STA Wealth

If ‘this time is different’ we would need to see an orderly reduction in leverage whilst lots of new buyers come to market. But recall through demographics, net investor populations are shrinking across USA, Europe and China, and this is reflected in declining trading volumes.

11dece3
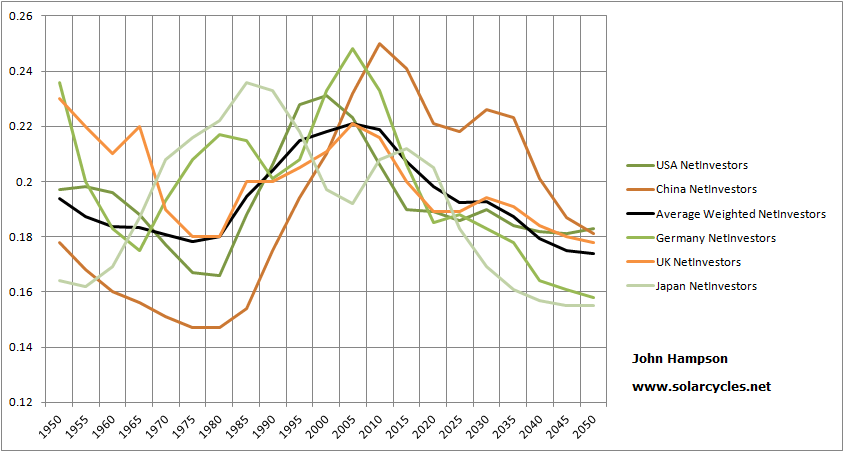
We therefore have a gradually thinning investor population, which adds weight to the likelihood of the current leverage excess spike being resolved in the usual historic manner, namely a deep correction or bear market.

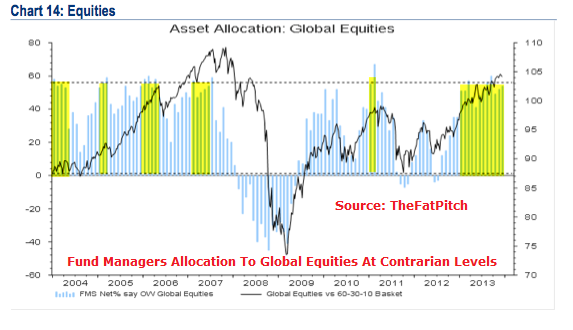
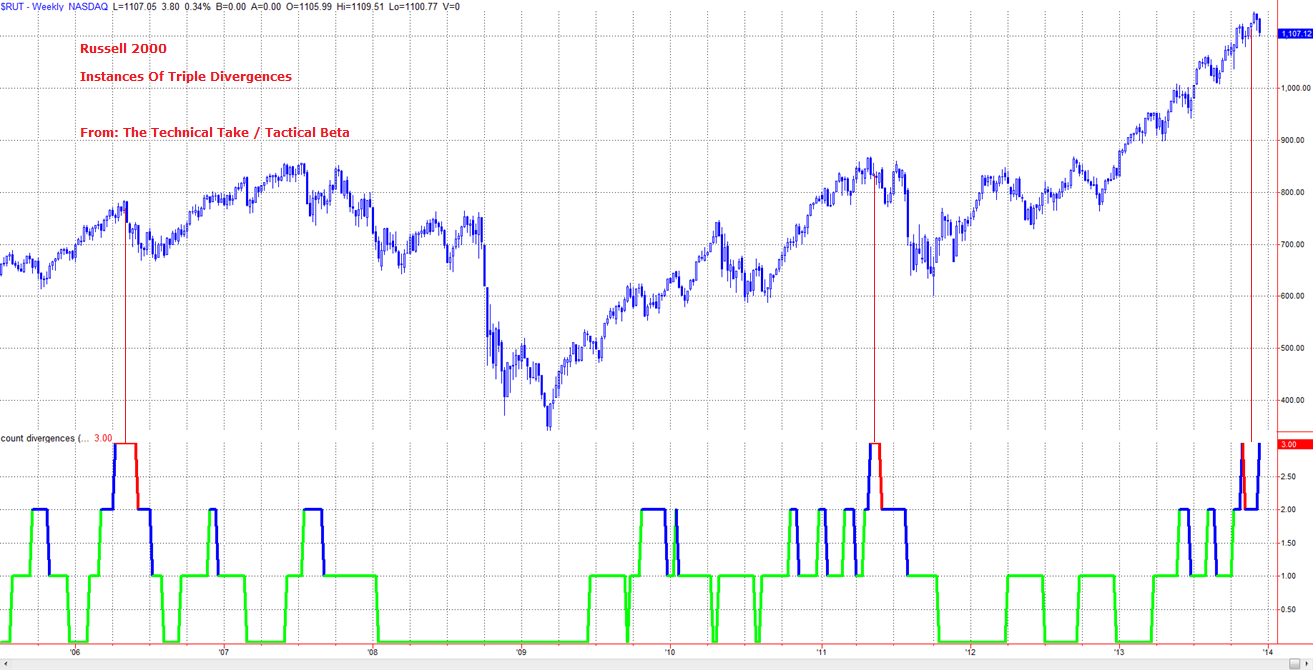
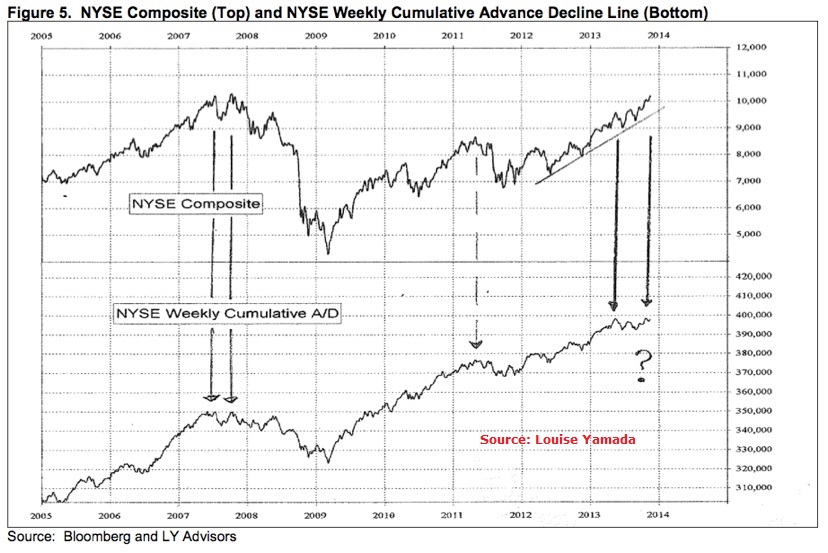
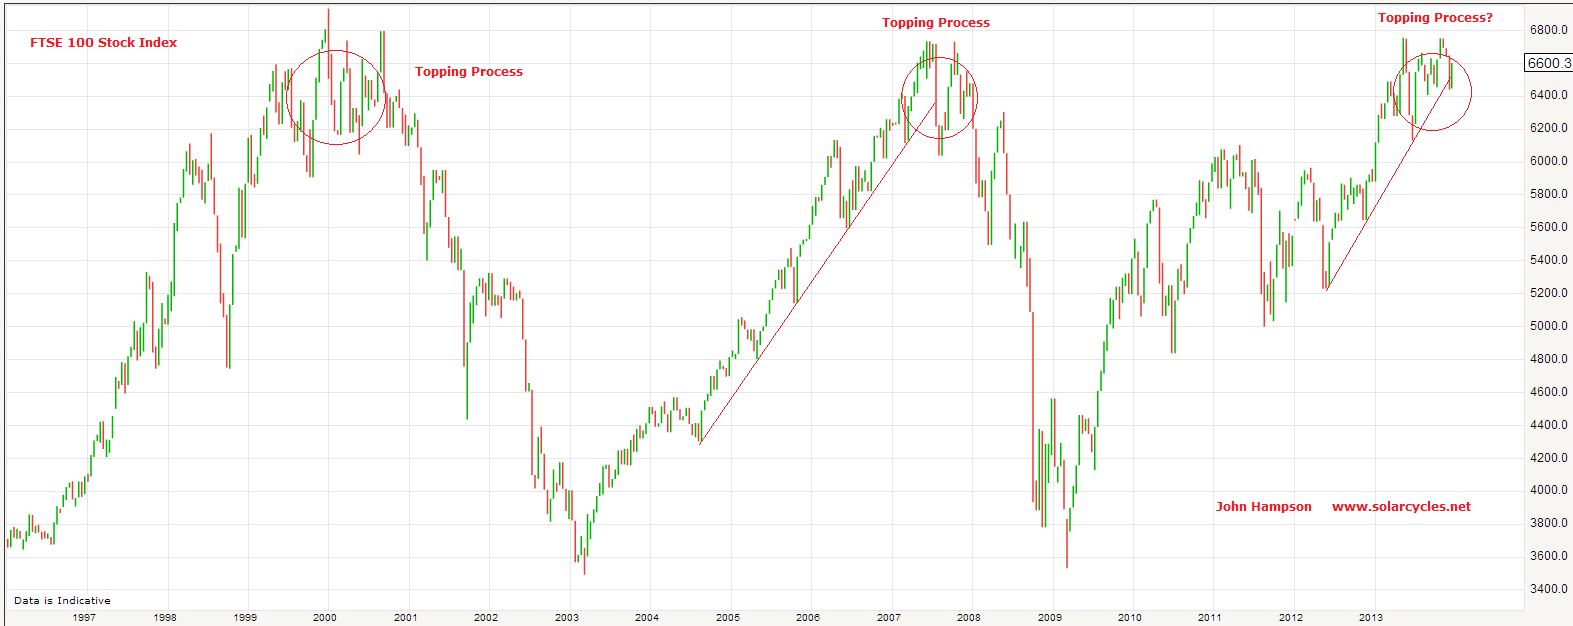
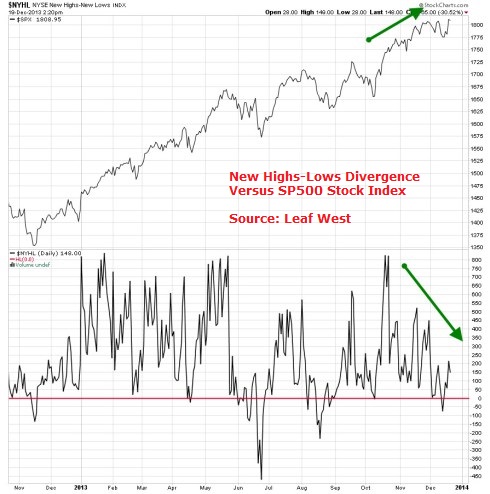
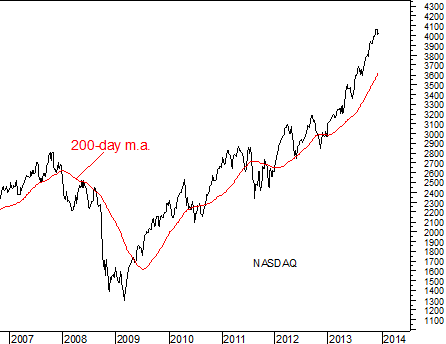
However, in the near term, we could yet see more equities allocation and potentially even more leverage. How much higher could equities run before a bear market or a proper correction erupts? I say proper correction, because none of the pullbacks in 2013 have displayed the usual correction characteristics in terms of depth, duration, and flush-out or spike in breadth and vix. They have been shallow pullbacks, with keen buy-up. To this prolonged lack of correction we can add the deviation in distance above the 200MA of the major indices, the excessive bullish sentiment and the current divergences in breadth, and history is fairly compelling in suggesting high risk of a sharp correction. But again, the question is when, and from how much higher?

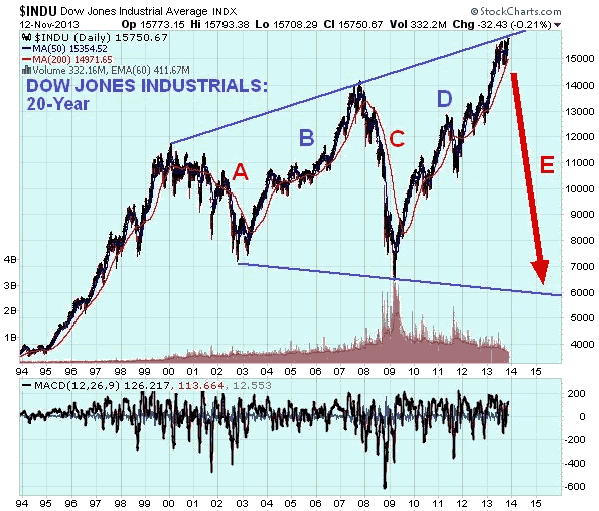
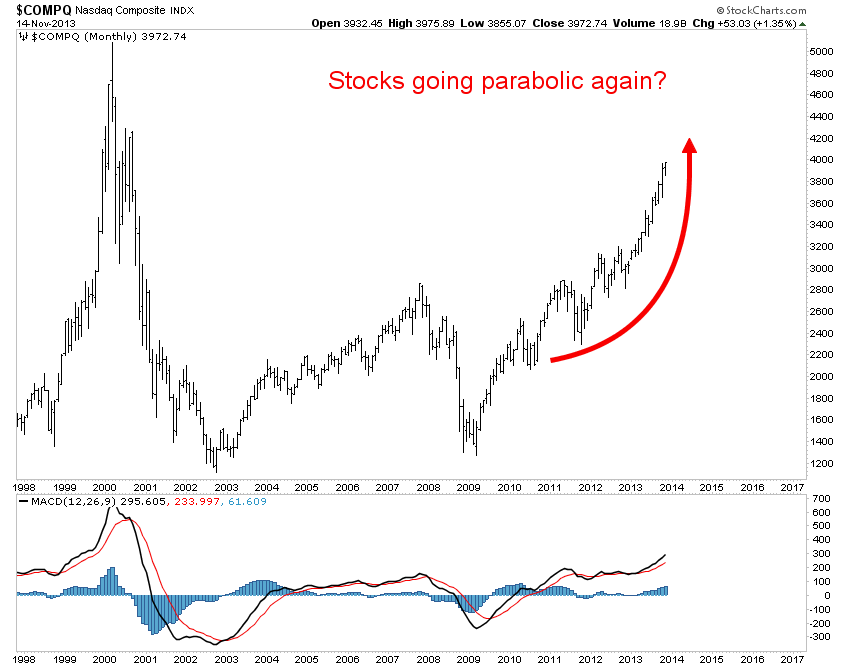
The 2007 top in US equities was marked by a steeper ascent in the last 12 months of the bull, but this is beaten in steepness by 2013’s rally. In fact, stocks have moved into a parabolic pattern:

20dece12Source: Sy Harding

Parabolic rises are typically resolved in a crash of similar steepness and depth. Comparisons to 1929 are valid if we consider the parabolic ascent, exuberance extremes in valuations, leverage and debt extremes, and a ‘this time is different’ mantra. Where 1929 differs is that it was the culmination of an economic boom with a demographic dividend. The current episode is neither.

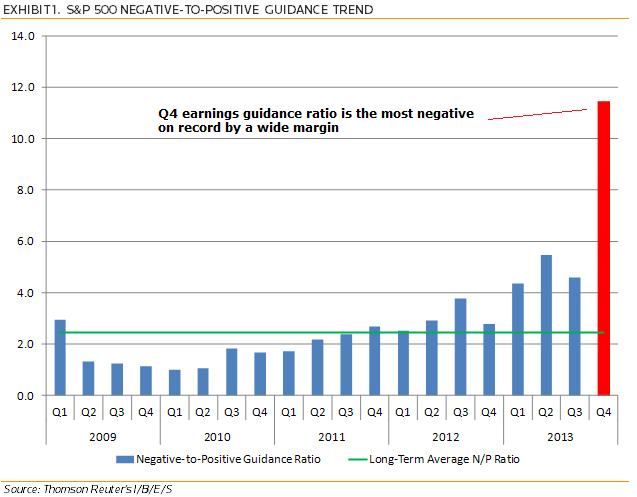
History suggests a combination of internals degradation, buyer exhaustion and one or more ‘triggers’ are the likely terminators of a parabolic bull. We see breath divergence, but this should yet degrade further. In a normal topping process, there would be thinnest participation at the final push, but if this is a parabolic top, then we should see increasing divergence as we move higher. There is evidence of buyer exhaustion in sentiment and leverage extremes. We lack the trigger or triggers for the shift in perception. One potential trigger is the earnings season in January, as negative guidance is at a record extreme. A second is that the boost in GDP due to inventory build is likely to be reversed ahead as inventories give-then-take. A third potential trigger is if we see evidence that the current pick up in growth turns out to be a peak in growth rather than a new dawn.

22dece6Source: Moneymovesmarkets

The above chart is derived from OECD’s leading indicators and predicts a peak in industrial output between Dec and Feb.

The case that we are in a new secular bull market for equities relies on growth picking up in a meaningful way from here. For forward earnings calculations to be valid, GDP next year would have to average over 3% for the year and earnings growth come in around 10%. If global growth were to pick up, then we would likely see relative outperformance in emerging market equities and in commodities relative to developed market equities, as both are at relative cheapness to the latter and both are beneficiaries of a growth theme.

However, the history of demographics suggest a sustaining economic revival is unlikely to occur in the foreseeable future. Collective demographic trends in USA, Europe, other developed countries (aside Japan) and China are now both recessionary and deflationary, and we can see that in evidence below:
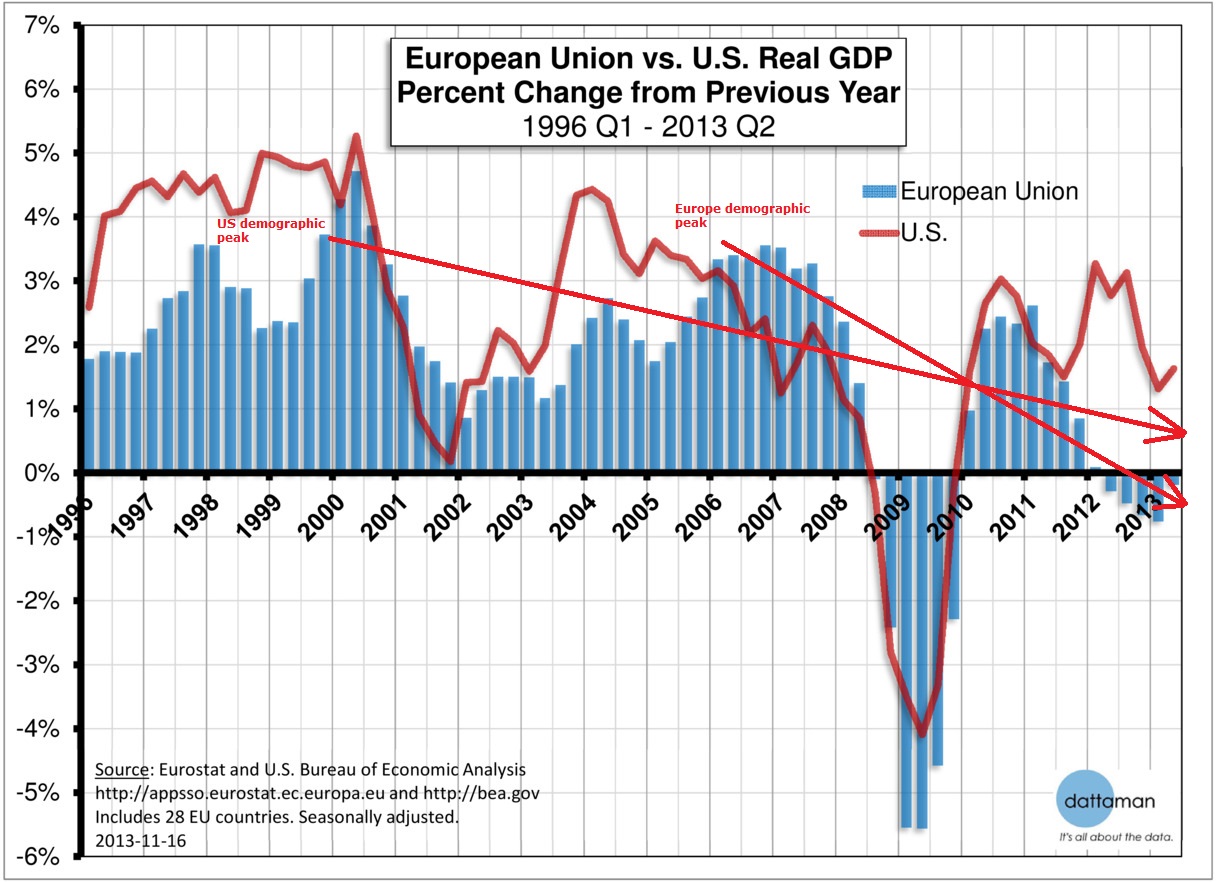
22dece9

Source: dattaman

22dece10

Source: Yardeni

The only G7 country in a positive inflationary trend is the only G7 country in a curent demographic tailwind window: Japan.

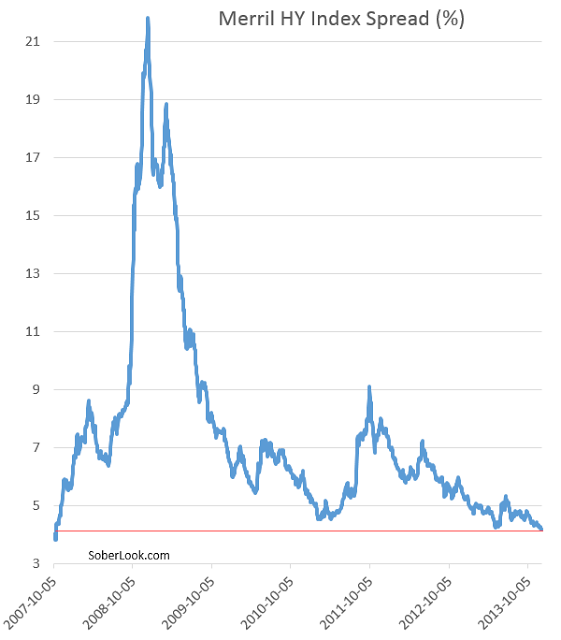
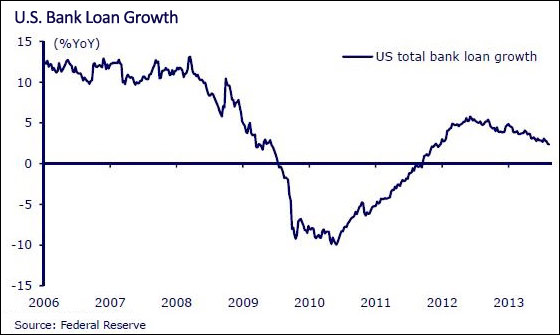
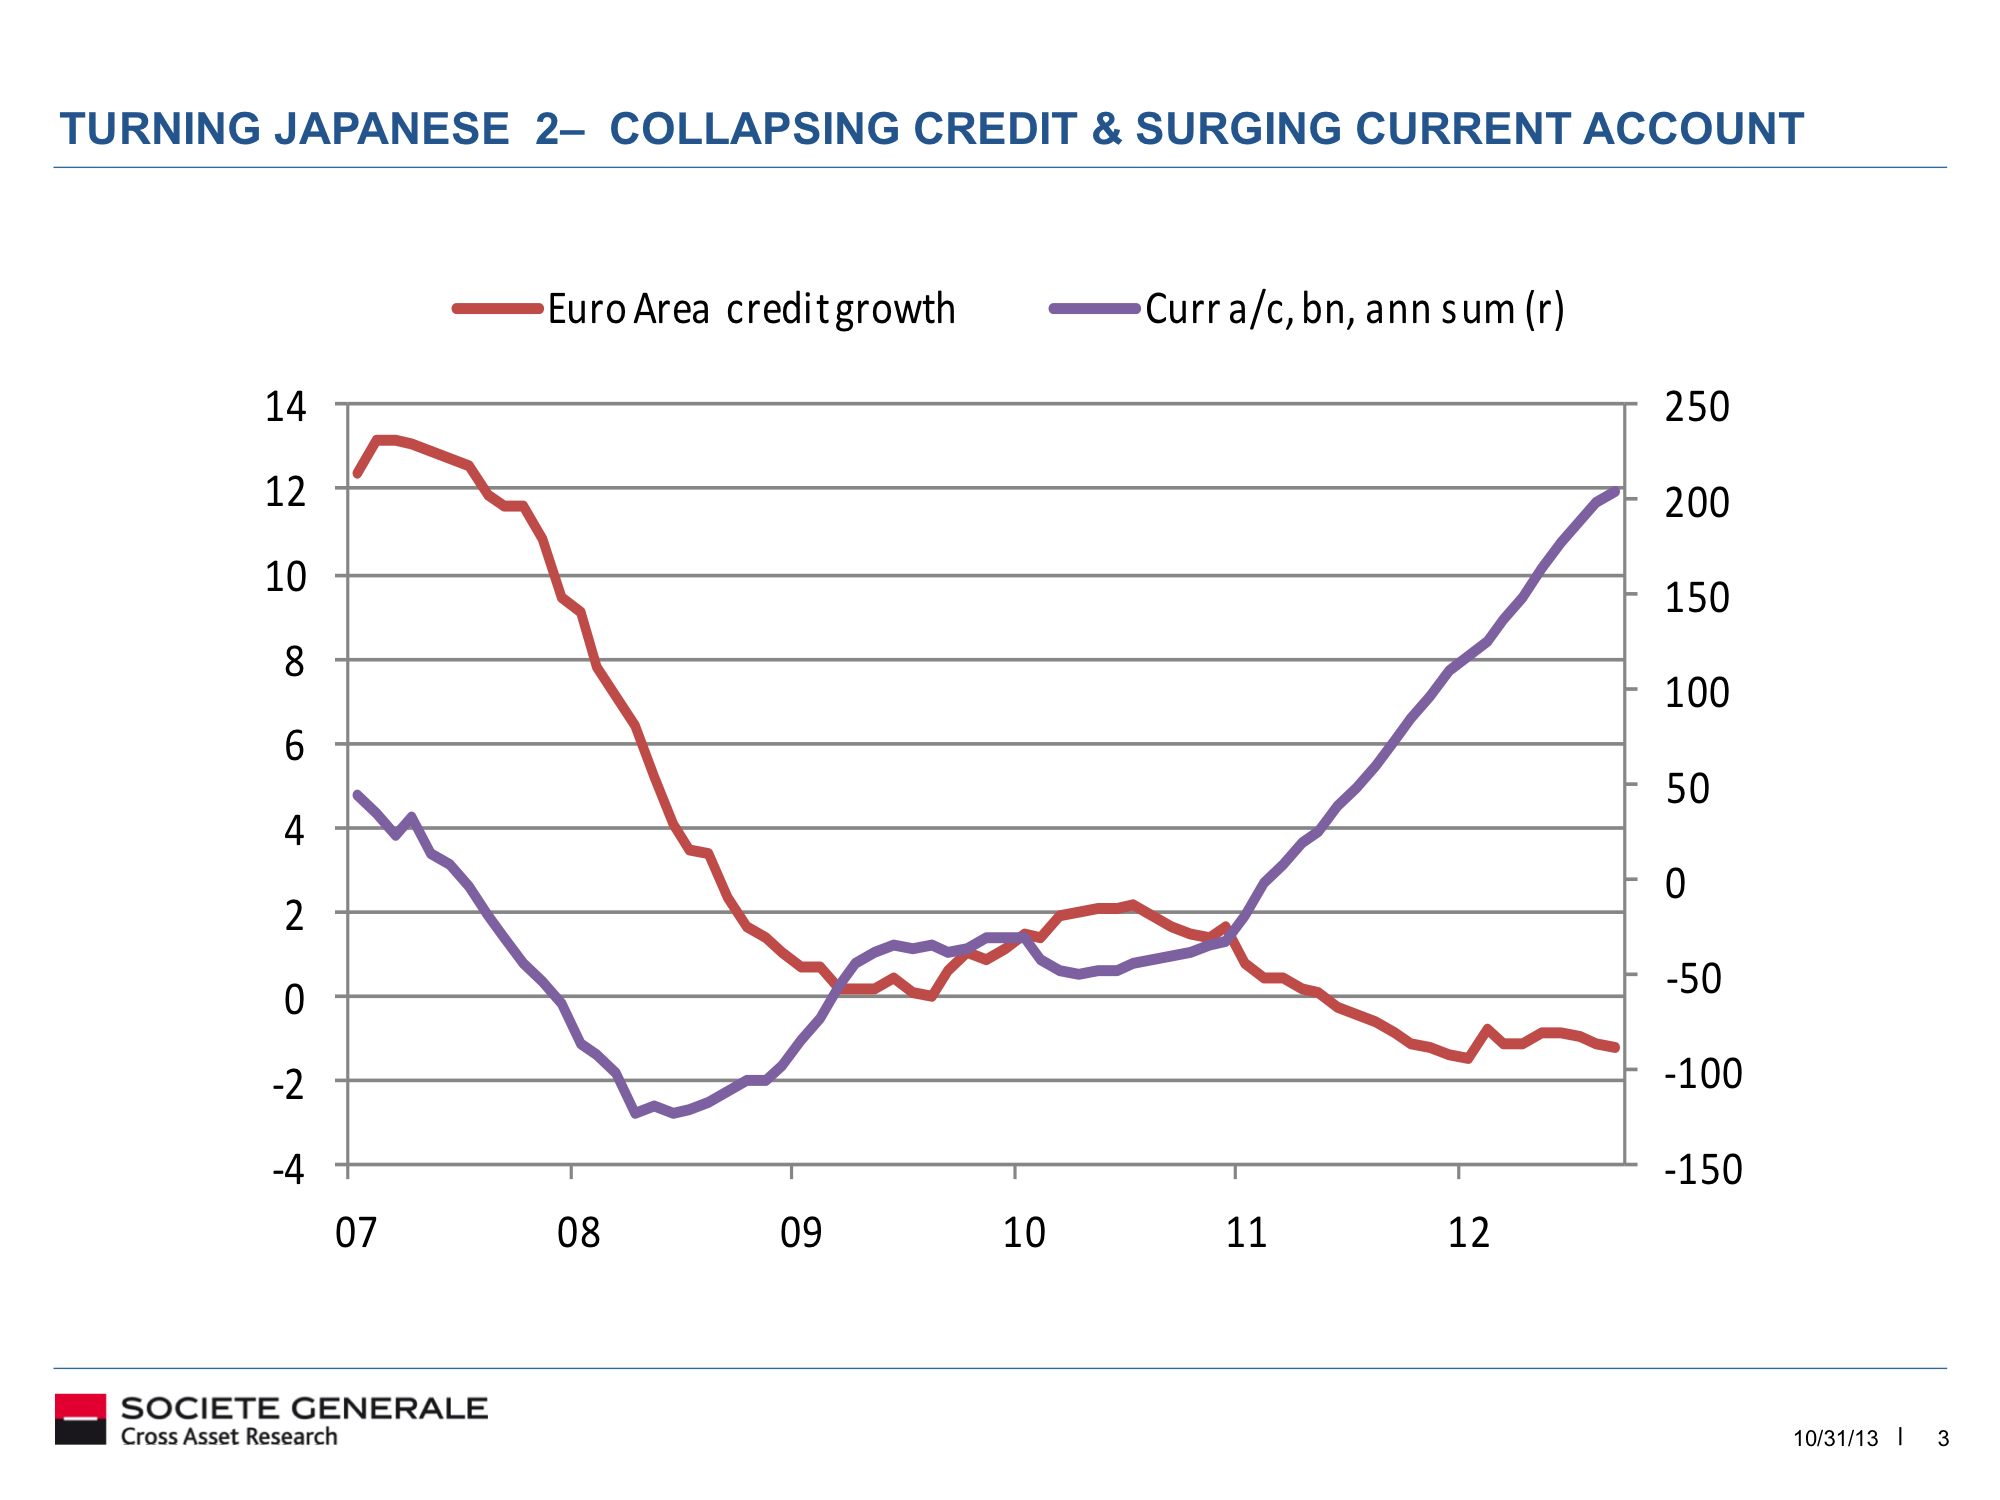
The demographic trends are pretty fixed on a medium term view, and historic evidence suggests that government / central bank intervention cannot force people to borrow or spend. Hence we see continued weakness in bank lending in Europe and the US, and real final sales of domestic product at previous recessionary levels.

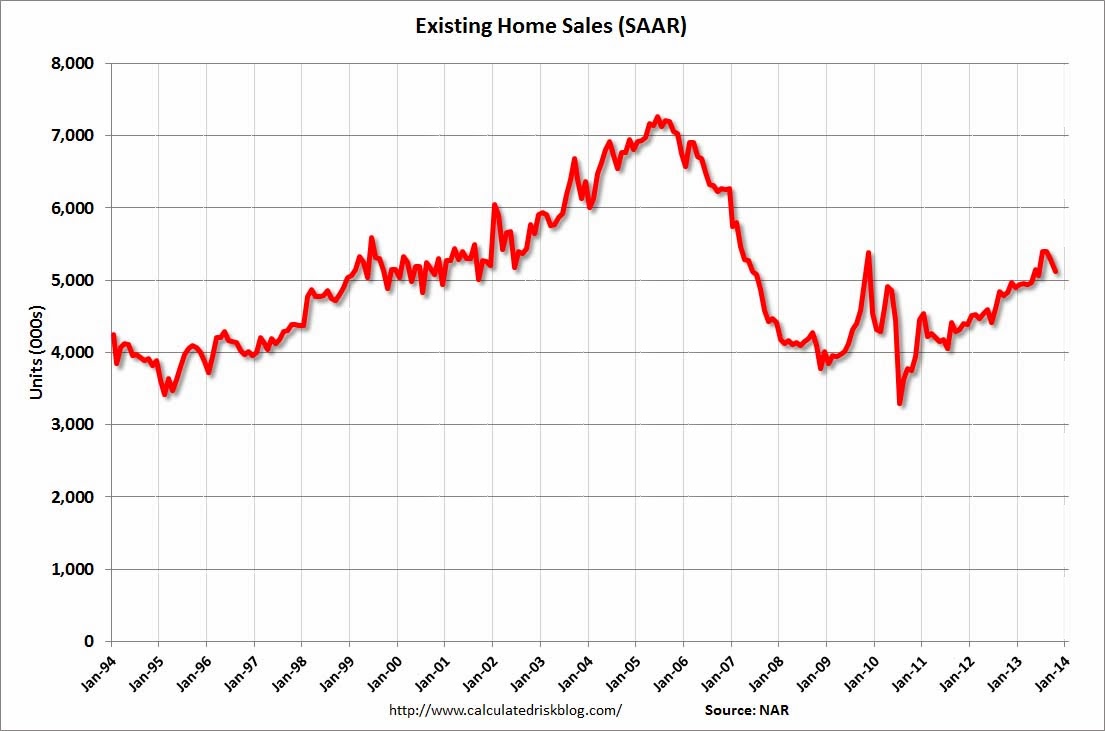
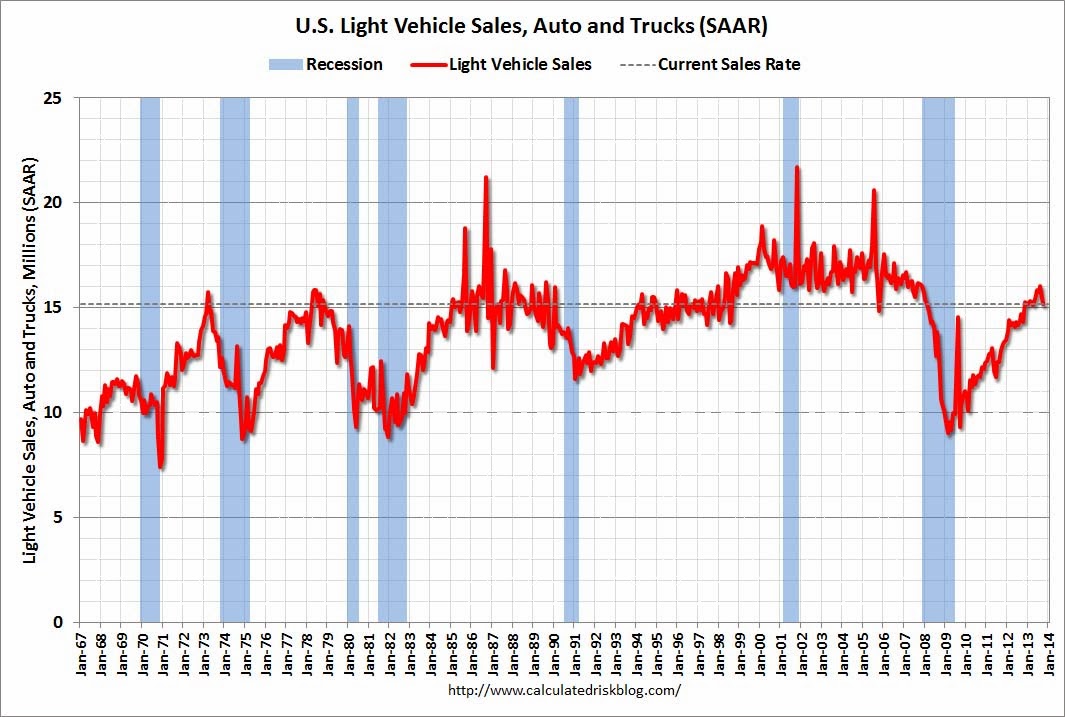
5 years after the financial crisis, ZIRP is still in place across most of the developed world, and large QE programmes are still required in USA, UK and Japan. The global economy is fragile, and this puts it risk of rising bond yields and/or commodity price increases snuffing out any pick up in growth, as the former two tend to accompany the latter. The US cannot afford bond yields to rise much further because it would have a detrimental effect on interest sensitive sectors such as housing and autos (and also because of the servicing costs of its ballooning debt), whilst rising commodity prices, particularly energies, are input cost drags on all sectors.

To sum up, from a pure statistical perspective, removing any notion of the bigger picture, the probability for 2014 is at best a flat year for equities with a significant drawdown on the way, and at worst a significant down year. Stats are just a guide, but we see united predictions across a range of measures, drawn together at the top of the page.

However, when we look at similar episodes of stock market rises without earnings growth, similar outliers in stock market valuations to now (market cap to GDP, Q ratio, CAPE), similar historic spikes and extremes in margin debt, and similar extremes in bullish sentiment or euphoria as are currently in place, the same mirrors from history keep cropping up: 1929, 1987, 2000, 2007. Together, these signals point to something more historic and devastating at hand, and the ‘fundamentals’ for that occurring are provided by demographics. Yet the bullish momentum of the market and ‘this time is different’ thinking (Fed trumps all, equities need revaluing due to suppressed bonds and cash yields) are making for widespread complacency about (and dismissal of) the parallels.

Whilst we should not overly rely on any one indicator or discipline, it’s the collective case that gives me such conviction on the short side (disclosure: short stock indices). Now do me a favour and give me a convincing case below for why equities will rise in 2014.

Major Stock Market Top Right Ahead

Second largest and third longest equities bull of the last 80 years, set against an economy that 5-years post crisis is still on life-support. More than 80% of the gains in the last two years have been multiple expansion only, without earnings growth, and the SP500 is on a run of almost 2 years without a 3-week losing streak (the second longest run in the last 40 years – source TheFatPitch).  Impressive, in a perverse way.

Click on the charts to view bigger.

20dece4

20dece320dece520dece7

20dece8

20dece120dece220dece920dece1320dece1120dece10


Tower Of Sand

The last two years gains in the SP500 have been mainly through multiple expansion, i.e. just price not earnings:

18dece1Source: Guggenheim Partners

This year, so far, earnings growth has accounted for just 17% of the gains. Digging into that earnings growth, revenues have been weak:

18dece2Source: Yardeni

So companies have boosted earnings-per-share through buybacks, at a rate on par with 2007.

18dece3Source: CNBC

Historically, companies have funded buybacks through borrowing:

18dece4Source: FT

This time is no different.

18dece5Source: NakedCapitalism

October produced a record in corporate debt issuance, and investors have piled in to this market to drive spreads to record lows this year. They have even snapped up the riskier Covenant-Lite corporate debt which offers little protection if the company gets into trouble – to another record level:

18dece6Source: SoberLook

In short, investors have gone all-in on the corporate sector, both in equities and debt. The corporates have used the debt to buy back shares, thus artificially boosting earnings-per-share whilst revenues languish. Even with that, earnings growth has only accounted for 17% of share price rises this year. The rest has been speculation built on the ‘new norm’ of Fed accommodative policy trumps all. Record low debt spreads and historic extreme equity valuations result, and now present high risk to those invested.

Earnings guidance for Q4 (reporting season kicks off in early January) is the most negative on record:

13dece7

Source: Thomson Reuters

The main reason for this is because companies have expected revenues to improve, so cut their guidance for earlier quarters but kept their year end targets in tact. Revenues have failed to materialise and therefore there is a big gap between year end forecasts and actuals, producing that big red bar for Q4 earnings.

Here we can see the persistent theme over the last two years of companies having to lower their quarterly guidance in line with economic reality:

18dece7Source: Bespoke

Of course, in response to lowering guidance analysts then reduce estimates, and with the bar set very low, companies can then peversely exceed estimates and produce a satisfying earnings beat rate, which helps shore up investor confidence. The truth of the meagre earnings and dire revenues becomes distorted.

The bidding up of equity prices without associated earnings growth has produced historic extreme valuations, averaged below:

13dece5

Source: Dshort

I suggest there are 3 secular cycles in the above chart. The 1920s saw an economic boom period with a positive demographic dividend, and by the end of the decade the thinking was that this boom was here to stay, a new norm, which gave rise to the speculative bubble and then collapse in 1929. It was not a new norm after all, and it took around 18 years to wash out excesses, to take valuations to a low enough level from which a new secular bull could erupt.

The 1950s and 60s was another (post war) economic boom period with a positive demographic dividend, and again new norm thinking took valuations to greed levels. The wash out was also around 18 years until valuations were at similar secular bull starting levels (note the demographic dividend was absent in the washout period).

The 1980s and 1990s then provided a third economic boom period with a demographic dividend in the major nations, excepting Japan in the second decade. This concluded with another ‘new norm’ bubble, and dot.com thinking took valuations to an all time exuberance record, and since then I believe we are in a gradual process of washout which should last another few years yet. US demographics peaked around 2000, Europe around 2005 and China around 2010, and we won’t see a collective demographic dividend return until 2020 or beyond. I believe this is why we face a weak economy and a gradual slide into deflation, and central bank intervention can do little to change this. Rather, central bank actions only encourage people into riskier assets by suppressing cash and bond returns, and make the cost of borrowing to do this ultra low. Hence we see another big disconnect now between the stock market and the economy.

Look again at the high outliers in the valuations average chart above: all were the peaks of economic and demographic booms (even 2007 where developing countries contributed a much bigger share to global GDP as China rose towards its demographic and economic peak). In contrast, the current exuberance is set against a weak economy and unprecedented collective demographic headwinds, which I believe makes it the most dangerous outlier yet. The ‘new norm’ this time is the Fed accommodative policy trumps all. It is a bubble.

There are multiple signs that we are reaching the top of this equities bull market (see my recent post Equities Bear Market Coming), and I believe we will see a bear market that will finally produce the washout to low extreme valuations. The negative demogaphic window is set to make this bear a deflationary shock, which means nominal values will have little protection. In other words, stock market falls will be harsh. On these grounds, Russell Napier quotes 400 on the SP500 as a possible bottom. This is maths plus history, not the peddling of fear.

The result would be something like this: a large megaphone with a lower nominal low than 2009:

26nove17Based on margin debt, euphoria, and valuation, the bear market looks set to erupt imminently. That means the Fed would be effectively out of ammo. It has had not the usual opportunity to end stimulus and raise rates to more regular levels, from which it can then ease in the face of a downturn. This should add to the ferocity of the downdraft.

By leading indicators the current window of positive economic data should turn out to be a peak, rather than the global economy finally seeing a new dawn. With commodities finely poised, I do not know whether they will rally as equities top out (in late cyclical style, similar to 2007-8) or break down as demand-supply slack outweighs. If the former, then we would see a temporary inflation until rising commodities help tip the fragile world economy into a deflationary recession. If the latter, then further commodity falls should do the job of completing the slide into outright deflation. Because of the credit excesses again (margin debt, corporate debt), a bear market would likely be unforgiving similar to 2008, i.e. forced liquidation of assets, with few asset classes spared. This time, however, treasury bonds would not seem so safe. Gold has a limited performance history under deflation, but I believe it has potential to be the go-to asset here.

The pretender to the throne, Bitcoin, which temporarily became as valuable as an oz of gold, looks to have burst, whilst gold’s washout looks very similar to 1976:

18dece8Source: Citi

The weak hands have been purged and equities show signs of topping. The next few years are an ideal anti-demographic window for gold to shine, and deliver the dow-gold ratio extreme which we have so far not seen. The question is whether it an escape a downward spiral of forced liquidations.

State Of The Markets

I think Bitcoin isn’t coming back. Bubble popped as per the bubble anatomy model below, and now at fear-capitulation:

8dece1Source: Bitcoincharts

8dece2Source: PortfolioProbe

Now what about the stock market bubble? No bubble?:

8dece3

8dece4

Source: Dshort
8dece5

Source: John Hussman8dece6 8dece7

The Citigroup Panic/Euphoria model is a composite of NYSE short interest ratio, margin debt, Nasdaq daily volume as % of NYSE volume, a composite average of Investors Intelligence and the American Association of Individual Investors bullishness data, retail money funds, the put/call ratio, CRB futures index, gasoline prices and the ratio of price premiums in puts versus calls.

Add in the declining trading volumes and I believe we have a recipe for a crash ahead – the question is when. An overleveraged, thinning stock market participation, trading at historic overvaluation and euphoria extremes. That said we have to understand the current context: surpressed cash and bond yields makes equities relatively more attractive, so worthy of higher valuations. Here’s a model I’ve used before to assess the environment for equities:

1. Inflation rate – Stocks have historically risen when the official inflation rate is between 2-5%

Inflation is below, so this is a negative.

2. Bond yields versus stock yields – Long term gov bonds yields should not exceed stocks yields by more than 6%

Equities are largely yielding more than 10 year bonds in the major nations, so this is a positive.

3. Interest rates – interest rates should be low.

Ultra low – so again positive.

4. Yield curve – should be normal.

Yield curve is redundant under a balance sheet recession, and I believe that’s the current circumstances. Therefore irrelevant.

5. Stock valuations – Stocks P/Es should be historically reasonable (historic average 17)

Overvalued by CAPE, Q ratio and a number of measures, so negative.

6. Investor sentiment – II, AAII, Market Vane should not be overly bullish

Overly frothy sentiment, e.g. II bull-bear ratio at highest since 1987. Negative.

7. Money supply – should be growing and strong

Collective narrow and broad money measures weakening to flat of late suggesting we may be seeing a top in global industrial production as we turn into 2014. But no clear trend, so I suggest neutral at this point.

8dece8Source: Moneymovesmarkets

Overall it’s a mix of positives and negatives, but notably both at extremes. Stock-bond yield differential at extreme in favour of equities, but equities overvaluations extremes, for example. So which is ‘right’? You know my view: unprecedented collective demographics point to deflation and declining equity and real estate markets that cannot be overcome by government intervention. But this may yet take time to unfold.

Corporate bond yields are also into extreme territory, putting investors into the same kind of risk predicament as in equities.

8dece9Source: SoberLook

As my trading focus is currently short term, I’ll end with my view on that. In line with excessive sentiment readings reached at the start of December, most major stock market indices pulled back last week. A notable exception was the leader, the Nasdaq, which consolidated sideways and then broke out on Friday to end the week at new highs. So more Nasdaq parabolic?

My opinion is the Nasdaq is actually going to reverse this coming week and be the last to join the correction. Volume was notably lower on Friday on that breakout, which is a sign it could be reversed. We are into the lunar negative period and there is a geomagnetic storm in progress this weekend. The Nasdaq shows a breadth divergence for the last 2 months, which again is suggestive of a correction:

8dece10Source: IndexIndicators

When the stock market reached those kind of sentiment levels in the past, normally a correction period of several weeks followed:

8dece11Source: Sentimentrader

Monentum has also waned. So it’ll be an interesting week, and for commodities too. Some signs of life last week which energy breaking out on the growth story, and some volume in the gold and silver buys in their range-bound week, whilst sentiment levels against gold, silver and miners are again at extreme lows. The US dollar is once again looking weak. The commodities indices remain in those large technical triangle noses since 2011, so still watching and waiting.

Disclosure: short stock indices, long commodities.


Nasdaq And Lessons From Japan

If the smoothed solar maximum for solar cycle 24 is occurring around now, and equities are the speculative target of solar inspired human excitement, and the Nasdaq remains the leading stock index, then we have evidence of such a speculative mania in the Nasdaq composite with a parabolic gaining traction, as referred to in the last post. Below is the longer term Nasdaq composite showing the last two solar peaks closely correlated in timing with Nasdaq peaks:

27nove1Underlying Source: Stockcharts 

Nasa predict the solar pole flip will be complete by Nov/Dec 2013, which typically signifies the solar max is complete, whilst SIDC have a sunspot projection showing a max around April 2013. Drawing those together with the possibility of a correlated Nasdaq peak, we have a window for the Nasdaq to peak out, in parabolic fashion, between now and June 2014.

If we look at the biggest four Nasdaq composite companies by market capitalisation, Amazon has at this point gone to crazy valuations under a steep parabolic, whilst Apple, Google and Microsoft are more contained. Google is the most expensive of the three at 23.9 forward p/e, whilst Apple and Microsoft are at 12.2 and 14.1 respectively. IF the Nasdaq is heading for a parabolic speculative peak (solar maxima in the past have typically correlated with parabolics in assets) then I suggest we probably would need at least another of these leaders to go to dizzy valuations like Amazon.

Now to lessons from Japan, and specifically, can the US and Europe avoid deflation or is it unavoidable?

By my research, Japan’s ‘lost decade’ was due to demographics, and with US (since circa 2000), Europe (since circa 2005) and China (since circa 2010) demographics now united in an unprecedented downtrend, I believe deflation is inevitable. BUT, Japan did make some ‘mistakes’, in belatedly adopting QE, and only keeping loose monetary policy once the economy entered periods of deflation, withdrawing once back into inflation. I say ‘mistakes’, because that is up for debate. Austrians and Monetarists argue that stimulus actually has a negative effect, for example government intervention quashes private economic activity and savers and retirees see their income quashed under ZIRP so actually cut consumption. Regardless, Japan’s massive QE and government spending programmes even failed to inflate their economy against a positive global backdrop of strong growth in the 1990s. Today, 10 out of the biggest 13 economies of the world are in demographic downtrends, making for that aforementioned unprecedented collective negative backdrop.

Analysts point to several other contributory factors for Japan’s failure.

One is the starting point of a bubble in stocks and housing prices, i.e. excesses that needed washing out. We can identify something similar leading us into the current situation for US and Europe, with a stocks bubble in 2000 and a housing bubble around 2006.

Two is associated with one, as the bursting of the bubbles encouraged households and businesses thereafter to pay down debt and not borrow, and to do so despite interest rates being brought down to negligible levels. Today we see the same occurring:

26nove3

27nove2

27nove4Three, low productivity, low capital expenditure and excessive capacity. Again, repeated today:

27nove5 27nove6 27nove7In fact, there is a theme in that US data of some key economic indicators being lower currently than at historic recession start points, and you can find the same phenomenon in data ranging from real US GDP growth to real US retail sales growth to National Activity (Chicago Fed). On which note, an inverted yield curve has historically been a reliable leading indicator of recessions in the US and the health of the curve suggests no recession on the horizon. However, the suppression of yields by the Gov/Fed essentially makes this indicator redundant, as Japan three times entered recession with a normal yield curve under the same suppression intervention.

Four, persistent fear. The financial crisis lingered in the mind, causing consumers to continue to distrust banks and feel pessimistic about the economic future, which translated into holding back on investment and spending. Below we similarly see how US consumer confidence has never really recovered since the 2008 financial crisis (whilst Eurozone consumer confidence also languishes negative, with the latest reading -15.4):

27nove8

Source: Dshort

And I shared charts in previous posts showing how private investment has dried up whilst the government has backfilled.

In short, there are broad similarities between 1990s Japan and the US and Eurozone today. But what actually tipped Japan into deflation? It didn’t happen straight away, it occurred once Japan attempted fiscal consolidation, trying to contain its ballooning public debt and high government spending. Which is where the US is today: back at the debt ceiling / fiscal cliff, aware it needs to reduce the massive QE debt ballooning. But it is in a QE trap, which Richard Koo explains like this:

The QE “trap” happens when the central bank has purchased long-term government bonds as part of quantitative easing.

  • Initially, long-term interest rates fall much more than they would in a country without such a policy, which means the subsequent economic recovery comes sooner.
  • But as the economy picks up, long-term rates rise sharply as local bond market participants fear the central bank will have to mop up all the excess reserves by unloading its holdings of long-term bonds.
  • Demand then falls in interest-rate-sensitive sectors such as automobiles and housing, causing the economy to slow and forcing the central bank to relax its policy stance.
  • The economy heads towards recovery again, but as market participants refocus on the possibility of the central bank absorbing excess reserves, long-term rates surge in a repetitive cycle I have dubbed the QE “trap.”

This year we have seen a sharp recovery in bond yields, in line with the second point, and if he is correct then we should now be seeing a reversal in automobile and housing sales, which the data from the last 3 months in the US does show:

27nove9 27nove12 27nove11

Source: Calculated Risk

Meanwhile, the Eurozone is perhaps going to pay the price for its cautious central bank policy response since 2008 (compared to US and UK) by entering deflation first. Money supply has not grown in that period and narrow money as a leading indicator suggests the tentative recovery in Europe may be about to fizzle out again.

27nove13


27nove14


Source: MoneyMovesMarkets27nove15


Source: Yardeni

Chinese monetary trends also show a slowdown into 2014, whilst producer prices have been in deflation over the last twelve months. Add China to the European Union and the USA, and that’s more than half the world’s economy in a collective demographic downtrend, before including other similarly demographically challenged major countries such as Canada and Russia. I just don’t see how this won’t escalate into a global deflationary recessionary feedback looping. If Japan couldn’t achieve it when collective major economy demographics aside itself were positive in the 1990s, and we see similar developments in data above as occurred in Japan, then it would seem the world economy is destined to slip into a deflationary recession. A QE taper and fiscal consolidation as part of debt ceiling renegociation as we turn into 2014 could provide the extra momentum on that path in the US, whilst for Europe any additional interventionary measures may well be too late at this point (and are of questionable effectiveness anyway).


New secular stocks bull market?

Did a new secular stocks bull market effectively begin in 2009 or 2011, with the recent breakouts above secular bear resistance making for a golden buy opportunity?

26nove16Source: Marketoracle

Or is a secular stocks bear still in progress and we are on the cusp of a major shorting opportunity, together with a GOLD buy opportunity?

26nove17Source: Marketoracle

26nove2Source: Approximity

The case for the stocks secular bull market would be that valuations washed out sufficiently from the peaks in 2000 to the lows in 2009, that central bank stimulus is doing enough to offset collective demographic down forces, and that exponential technological evolution will drive increasing profitability and economic growth from here. Here are a couple of charts I produced last year, pre demographic research, showing the secular bear p/e valuations progress, with the lower chart showing how I expected breakout in 2013 followed by retest of the breakout level in 2014, before secular bull momentum took hold.

26nove9 26nove10


That projection was based on historic patterns, and still seems reasonable to me, if this is a new secular stocks bull. 2013 has indeed seen the ‘pentagon’ breakout in the major global stock indices, and a successful retest of the nose of the pentagon in 2014 would reset some of the froth we have built up this year as well as giving technical validation to the new bull.

However, since my demographic research, and broader thoughts progress, I have been more convinced of secular bear continuation, and the megaphone projection above. The case for secular bear continuation includes unprecedented collective demographic downtrends and overvaluation of equities by other measures. Here are Doug Short’s 4 valuation measures all showing historic overvaluation extremes, excepting the 2000 outlier:

26nove18Source: Dshort

There is a case for a breakdown to -50% if historic patterns are to be maintained, before a secular bull could be considered. The doubt is if 2000 was not an outlier but the new norm, namely a racheting up of higher and lower valuations, perhaps as a result of technological evolution also ratcheting up. Alternatively, valuations may change in context – namely that in this current era, ZIRP and QE have killed the attractiveness of cash and bonds, and we are therefore in an era where stocks are relatively more appealing:

26nove1And commodities? Deflationary demographics may have terminated the secular commodities bull before expectations, i.e. without a collective final mania. Or commodities may yet perform as late cyclicals, making a final ascent into 2014 that tips the fragile global economy into recession. The commodities indices are still in large triangles, since 2011, and whilst they remain so, the latter remains possible.

If, however, deflationary demographics are working their way through the commodities complex, then, by my research, there still remains a place for precious metals to shine, as the anti-demographic asset. The third chart down above in this post shows the progress of the dow-gold ratio, and also suggests the two secular possibilities. One, that the rising long term channel shows a repricing in the ratio in favour of equities (due to tech evolution) which means higher bottoms for the ratio and higher tops, i.e. the 2008-2011 lows were sufficient. Or two, that the fiat capital era has produced ever increasing extreme swings, which suggests the ultimate low in the dow-gold ratio is still ahead and will be the lowest yet.

Of course this will all become clear with the fullness of time. If demographics overcome central bank actions and tip the world into deflation, recession or both, then I expect stocks to lose and gold to win. If central bank actions together with tech evolution are overcoming demographics, then we should see a gradual strengthening in economic growth and profitability which should mean stocks (continue to) win and gold loses. Somewhere inbetween would be the scenarios in which rising yields or an inflationary shock (speculative run in commodities) or both tip the world into recession, which could reset stocks to some degree but keep both secular options open.

Back to the near term, we continue to see signs of froth in equities as well as signs of a melt-up in progress. That makes it difficult as it suggests it not prudent to go long here, but the short opportunity that it is setting up could be yet, 5%, 10% higher or even higher. Depends how crazy things might get, and if this the solar maximum then that potential is there.

26nove11 26nove1226nove526nove7


Stocks, Gold, Money Supply and Debt

Here is a chart from Gary Tanashian through SlopeOfHope’s charting facility, which could be argued legitimises the current steep ascent in US stocks:

24nove1Parabolic money pump, steeply rising corporate profits, and therefore equities going vertical (on a long term view).

In fact the sharply rising monetary base is directly contributing to those rising corporate profits, as government spending (debt) has been the key driver of corporate profits since 2008:

24nove2Therefore, if the US Fed begins to withdraw stimulus, disappointment in corporate profits is likely, as the chart shows the traditional profits driver of private investment has collapsed and not recovered over the last few years. Once again, this fits with demographics, and we should therefore not expect private investment to ramp up significantly again any time soon. So it’s in the hands of the US government and Fed. Maintain or increase stimulus, corporate profits should keep rising; decrease or end stimulus, corporate profits should retreat.

Turning to the monetary base, equities are not the only correlated class. In fact, gold has had a tighter correlation, until 2013. Here 2000-2012:

24nove3Source: Fool.com

Gold displayed a similar correlation with government debt, also until 2013.

24nove4

Source: RockSituationReport24nove5

Source: SlopeCharts

The first shows the debt limit, which will be back on the agenda soon, and surely must keep rising, whilst they retain the need to stimulate, which they will due to demographics. The second shows debt as a percentage of GDP, which actually fell back a little in H1 2013 (my extension on the chart). The reason for that was better than expected economic growth and a trimming in certain areas of government spending. Total debt continues to rise at a historically rapid rate.

So are these correlations with gold broken, or is gold set to come back? One more chart shows that the US dollar and treasury yields have been largely inversely correlated with gold and the pair strengthening for much of 2013 has been a key factor in gold’s decline:

24nove6Source: SlopeCharts

In my opinion, gold’s relations with money supply and debt levels are logically sound, and both money supply and debt should continue to rise into the future under the demographic trends. I therefore I expect gold can restore its bull market if the US dollar and treasury yields tip again into sideways or declining trends. If the US economy strengthens and a little inflation is restored, then this is unlikely to happen and gold will remain in the doldrums. However, demographics and debt suggest the Fed will have to keep fighting to maintain growth and keep deflation at bay (taper disappointment, yields suppression, new measures to attempt to inflate), which could bring about such a reversal in fortunes.

I still expect equities can go a little more parabolic first, under a typical solar maximum speculation push. However the warning flags already in place of dumb/smart money, trading volumes, margin debt and trading credit balances, and overvaluations (e.g. Q ratio) suggest it is most likely limited in duration and size. I would go with something like this from trader Moe:

24nove7Source: Trader Moe

A further 10% gain in a rapid time, with a catalyst being collective major breakouts in the major global indices, to get to some crazy extreme indicator readings, and a subsequent termination. My first checkpoint is the start of December, because the 3rd is the new moon and as of the 4th geomagnetism is forecast to ramp up again. If equities can rally hard and fast into that point, with a spread of indicators flashing, then I would suggest that could be the earliest point for declines to set in (barring any external shocks). If, however, equities can rally through the seasonally strong Xmas period, and solar intensity stays high into the beginning of 2014, then the next checkpoint would be early January.


Divergences, Ratios and Surprises

Here are the latest economic surprises indices for the major nations:

19sept5 19sept4 19sept3 19sept2Source: Citibank

Japan aside, economic surprises for most of the majors topped out as we turned into September. Historically there has been a fairly good correlation between economic surprises and stock market returns, but the correlation has deteriorated throughout 2013 and turned negative:

19sept7

Source: JP Morgan

Is there anything about that period from early 2009 to mid 2010 where correlations also were anomalously negative? My take is that by March 2009 most of the major stock indices were at p/e 10 or below, and thereafter we saw a period of post-panic bargain hunting at historic cheapness, despite and regardless of continued disappointing economic data. That doesn’t apply at today’s valuations.

Here’s another look:

19sep1I’ve charted the peaks in US economic surprises versus the SP500. It can be seen that from 2006 to 2012, trend reversals in economic surprises reliably brought about corrections in the SP500, but sometimes with the stock market eeking out a marginal new high and then rolling over. But since the end of 2012 the two economic surprises peaks have been largely ignored by the market.

There have been other notable divergences since the turn of the year.

Equities have diverged from geomagnetism:

19sept12

Junk bonds, which have historically correlated with equities fairly well under ‘risk-on/off’ sentiment, have parted ways with stocks and are actually down for the year. Commodities likewise:

19sept11Source: Yardeni

I have extended this commodities:stocks ratio chart from early 2012 to the current level in November 2013, showing the degree to which stocks are now valued versus commodities:

19sept13Source: Stockcharts

Down to 0.15, very close to the level reached at the 2000 equities peak.

Versus bonds, equities have also made a sharp run up in relative valuation this year:

19sept14Source: ispyetf

If this is the solar maximum at the end of 2013, then it would be normal, by history, for the secular asset class of the time to be bid up in a speculative finale, diverging from normal correlations and leaving models behind, in a final overthrow. If this is occurring with equities (perhaps disinflation has killed off commodities), then the above charts would be evidence for that, and we are left trying to look for clues as to how much further, both in time and price, the speculative finale has to run. If it isn’t equities, but rather commodities that are bound for a speculative finale (as they would rather befit the ‘secular’ asset class leading into this solar peak), then the above charts are warnings that the rug could be pulled from under equities at any time.

Right now, the balance of evidence suggests that it is stocks being bid up to a speculative finale, if my solar thesis is correct. Even without solar, we see various evidence for that, in my last post and this. See how margin debt has accelerated over the last 12 months, as it did prior to the last 2 major stocks peaks:

19sept10

Source: Dshort

And now look at the decline in trading volumes:

19sept15Source: Marketwatch

There are fewer and fewer participants in the market chasing it higher, and the margin debt and credit account levels (last post) suggest increasing leverage to do so. Unless more people and institutions come to the market, then that is a recipe for a steep decline or crash ahead. By demographics, those additional participants are unlikely to materialise. Recall that demographic trends in the US were up into around 2000 and have since been downward, continuing this decade. I suggest that is what we are seeing in the trading volumes ‘mountain’ above.

In summary, I believe the equities bull is on borrowed time and that risk-reward is stacking up on the short side. But it comes down to how much further in price and time stocks can extend first. If solar-inspired speculation is at work then parabolic becomes more possible. If on the other hand equities are to make a topping ‘process’ rather than a parabolic, then by normal measures this has not started in a meaningful way so should at least extend for several months and postpone a major decline until 2014. If commodities are to become the speculative target then they should take off as late cyclicals whilst stocks make a topping process. This remains theory only, and deflationary demographics are a headwind to this occurring, so I have my doubts.

On that note, if we look at when gold really took off in the past, it was under conditions of negative real treasury yields. Rises in yields over the last 12 months, together with shrinking inflation, have taken real yields positive and are a problem for gold. Deflationary winds, due to demographics, threaten to take inflation yet lower, whilst treasury yields by late 2012 had reached historic extreme lows, suggesting renewed downside may be limited. So, if I could speculate how fortunes could be reversed in gold, it would be either the world tips into deflation and gold performs more ‘uniquely’ (gold’s performance under deflation is limited in history, but I suggest it ought to perform as the default go-to asset under such conditions when all others are unattractive) – or – central banks take renewed action against the disinflation in progress by increasing rather than decreasing stimulus, e.g. the ECB launches QE and the Fed maintains QE rather than tapers.

19sept9Source: Dshort