

The last two years gains in the SP500 have been mainly through multiple expansion, i.e. just price not earnings:
 Source: Guggenheim Partners
This year, so far, earnings growth has accounted for just 17% of the gains. Digging into that earnings growth, revenues have been weak:
 Source: Yardeni
So companies have boosted earnings-per-share through buybacks, at a rate on par with 2007.
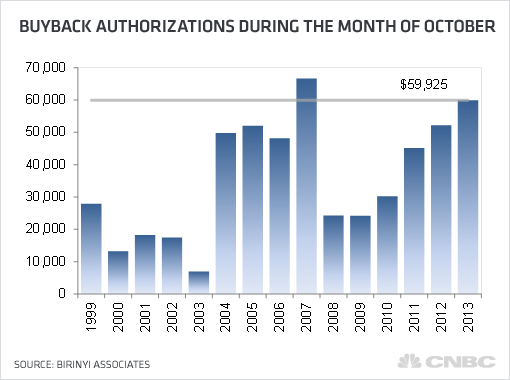 Source: CNBC
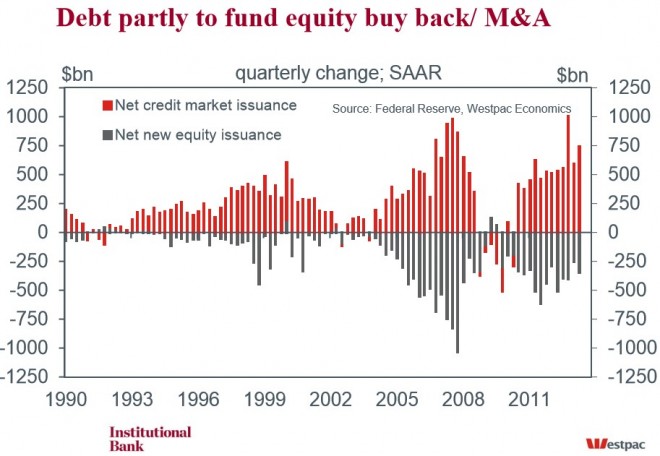
Historically, companies have funded buybacks through borrowing:
 Source: FT
This time is no different.
 Source: NakedCapitalism
October produced a record in corporate debt issuance, and investors have piled in to this market to drive spreads to record lows this year. They have even snapped up the riskier Covenant-Lite corporate debt which offers little protection if the company gets into trouble – to another record level:
 Source: SoberLook
In short, investors have gone all-in on the corporate sector, both in equities and debt. The corporates have used the debt to buy back shares, thus artificially boosting earnings-per-share whilst revenues languish. Even with that, earnings growth has only accounted for 17% of share price rises this year. The rest has been speculation built on the ‘new norm’ of Fed accommodative policy trumps all. Record low debt spreads and historic extreme equity valuations result, and now present high risk to those invested.
Earnings guidance for Q4 (reporting season kicks off in early January) is the most negative on record:

Source: Thomson Reuters
The main reason for this is because companies have expected revenues to improve, so cut their guidance for earlier quarters but kept their year end targets in tact. Revenues have failed to materialise and therefore there is a big gap between year end forecasts and actuals, producing that big red bar for Q4 earnings.
Here we can see the persistent theme over the last two years of companies having to lower their quarterly guidance in line with economic reality:
 Source: Bespoke
Of course, in response to lowering guidance analysts then reduce estimates, and with the bar set very low, companies can then peversely exceed estimates and produce a satisfying earnings beat rate, which helps shore up investor confidence. The truth of the meagre earnings and dire revenues becomes distorted.
The bidding up of equity prices without associated earnings growth has produced historic extreme valuations, averaged below:
Source: Dshort
I suggest there are 3 secular cycles in the above chart. The 1920s saw an economic boom period with a positive demographic dividend, and by the end of the decade the thinking was that this boom was here to stay, a new norm, which gave rise to the speculative bubble and then collapse in 1929. It was not a new norm after all, and it took around 18 years to wash out excesses, to take valuations to a low enough level from which a new secular bull could erupt.
The 1950s and 60s was another (post war) economic boom period with a positive demographic dividend, and again new norm thinking took valuations to greed levels. The wash out was also around 18 years until valuations were at similar secular bull starting levels (note the demographic dividend was absent in the washout period).
The 1980s and 1990s then provided a third economic boom period with a demographic dividend in the major nations, excepting Japan in the second decade. This concluded with another ‘new norm’ bubble, and dot.com thinking took valuations to an all time exuberance record, and since then I believe we are in a gradual process of washout which should last another few years yet. US demographics peaked around 2000, Europe around 2005 and China around 2010, and we won’t see a collective demographic dividend return until 2020 or beyond. I believe this is why we face a weak economy and a gradual slide into deflation, and central bank intervention can do little to change this. Rather, central bank actions only encourage people into riskier assets by suppressing cash and bond returns, and make the cost of borrowing to do this ultra low. Hence we see another big disconnect now between the stock market and the economy.
Look again at the high outliers in the valuations average chart above: all were the peaks of economic and demographic booms (even 2007 where developing countries contributed a much bigger share to global GDP as China rose towards its demographic and economic peak). In contrast, the current exuberance is set against a weak economy and unprecedented collective demographic headwinds, which I believe makes it the most dangerous outlier yet. The ‘new norm’ this time is the Fed accommodative policy trumps all. It is a bubble.
There are multiple signs that we are reaching the top of this equities bull market (see my recent post Equities Bear Market Coming), and I believe we will see a bear market that will finally produce the washout to low extreme valuations. The negative demogaphic window is set to make this bear a deflationary shock, which means nominal values will have little protection. In other words, stock market falls will be harsh. On these grounds, Russell Napier quotes 400 on the SP500 as a possible bottom. This is maths plus history, not the peddling of fear.
The result would be something like this: a large megaphone with a lower nominal low than 2009:
 Based on margin debt, euphoria, and valuation, the bear market looks set to erupt imminently. That means the Fed would be effectively out of ammo. It has had not the usual opportunity to end stimulus and raise rates to more regular levels, from which it can then ease in the face of a downturn. This should add to the ferocity of the downdraft.
By leading indicators the current window of positive economic data should turn out to be a peak, rather than the global economy finally seeing a new dawn. With commodities finely poised, I do not know whether they will rally as equities top out (in late cyclical style, similar to 2007-8) or break down as demand-supply slack outweighs. If the former, then we would see a temporary inflation until rising commodities help tip the fragile world economy into a deflationary recession. If the latter, then further commodity falls should do the job of completing the slide into outright deflation. Because of the credit excesses again (margin debt, corporate debt), a bear market would likely be unforgiving similar to 2008, i.e. forced liquidation of assets, with few asset classes spared. This time, however, treasury bonds would not seem so safe. Gold has a limited performance history under deflation, but I believe it has potential to be the go-to asset here.
The pretender to the throne, Bitcoin, which temporarily became as valuable as an oz of gold, looks to have burst, whilst gold’s washout looks very similar to 1976:
 Source: Citi
The weak hands have been purged and equities show signs of topping. The next few years are an ideal anti-demographic window for gold to shine, and deliver the dow-gold ratio extreme which we have so far not seen. The question is whether it an escape a downward spiral of forced liquidations.

Thank you John for the excellent post!
“Russell Napier quotes 400 on the SP500 as a possible bottom. This is maths plus history, not the peddling of fear”
That’s brutal… How soon are you expecting this?
Thanks. Margin debt spiking and sentiment euphoria suggest bear market should be close at hand, but we may need a multi-month topping process in which the market first corrects then crawls back up to the highs on significant divergences. I’m not sure on that because US indices have gone fairly parabolic, so Eiffel tower also possible. A deflationary event could occur and provide a trigger.
Nice post but… we may go much higher… Bitcoin crashed happy about that =)
Still believe we have a 20% drop in gold to come… Support is weak here.
Gold chart indeed looks heavy. We had 6 months of a neutral/slightly negative consolidation, and H&S completed in November is visible. If 1200 breaks, we may be fast at 900-1000. This is not the end of gold bull in my opinion. Time will tell.
Bulkowski: Over the next two weeks, I see weakness in the indices turning into strength. That means the indices might drop but then will rise going into the new year.
http://thefelderreport.com/2013/12/17/the-bull-market-top-checklist/
Leveraged Rydex bull-bear ratio an all-time record, more than double anything seen in the past:

Fundamentals are difficult to trade… Herbalife? Blackberry? Perfect fundamental case and still stock went up or crashed. Penny stocks pump and dump… Dangerous to trade on anything that is not robust pattern based. Dangerous to have a view. Eventually you will be right but until the pattern is not similar to bitcoin the view is sort of just interesting. Why force your view =)
I count squiggly line indicators as fundamentals =)
Can’t understand why you would ignore such a range of red flags and think this can only end Bitcoin style. Even if this is not the final market top, these indicators are calling for a sharp correction.
It will end bitcoin style but the time to short is after the first drop and retracement like bitcoin not when the pattern is rising =). Short lower highs and lows not higher highs… =)
Why do you continue to insist there’s only one correct approach–yours–to trading profitably? Why do you presume that John is “forcing his view”? John certainly has a view and has been very successful trading the markets based on that view. He’s also very generous with his time to create this blog and post it for all to see. I don’t see how you conclude that he’s “forcing” a view. He looks at the data, looks at what the markets are doing, and develops a trading strategy from that input. And, of course, that strategy is subject to change as more data comes in. It’s been a successful strategy. Maybe the question should be : Why do you continue to force YOUR view?
Because someone is a shill here (hint: certainly not John).
Spot on primaCanyon. Nothing wrong with challenging but Robert’s post appear to be purposefully diametrically opposed.
Are we working to an agenda Robert?
Robert, did you studied cycles? 17-years cycle is a nice clue. I´m not saying you can trade with leverage, but if you can manage your portfolio with some Etfs/funds and some knolwdge of the cycle you can have profits.
300- years cycle
90-100 years cycle
17-years-cycle
13-year-cycle.
You can see take some notes about 1906-23 or 1966-83, even if you see the prior prospections about the Dow Jones before 1900 based in US and UK economy, the patterns are so similar and works roughly.
In my opinion, after having studied the Dow Cycle since 1720 at least, we are in the last step of the 90-100 y-cycle form 1929 and last stage from 1720, 300-y.cycle, the end of Capitalism, and if you see the 1906-23 structure (Dow Jones) is similar to 2000-2017 in the upward pattern, with some diff in the timing, instead 2-3 years up-trend from bottoms, 4-5, with more than 100% revaluation.
Last year I thought we were in the top, in summer, but stimulus make the rest to modify 1976-83 structure for a 1909-16-19 strcture.
Tha mechanism to operate in this long run-term structures is not laverage or to do minimum.
It is difficult to be precise- accurate.
I was, in the march´09 bottom but i was prior short in some indices and assets since nov´08.
No matter.
Even I was short during 2007,and in loosing positions but I added short positions in sep-oct´07.
Could describe other situations in the past, before 2000, but could be so boring.
One thing never forget is to persevere CASH.
@apanalis
I trade for a living short term. Short term patterns only based on price not how I feel or think. I never try to predict. I do not believe the cycles work well in practice except for lunar cycles. I buy some long term value stocks often backed by billionaires that made their fortunes trading stocks i.e. Ican etc. I never use leverage. I used it when I worked in the PE industry and promised myself to never use it again =). I am very short term. I like the view of aim small miss small. The shorter I need to be in the market the better. Most importantly I take losess. The worst thing is to not cut losses. I cut losess. Cut losses. Cut losses. Cut losses. I am right about 60% of the time and I do not have a clue. But I cut losses and change my view based on what the tape is showing. I stopped reading the newspapers. I just cut losses. Cut them. Take the shot term pain. Never double my loosers. And if I end up in a weak psychological moment where I double a looser – it only happens on double down billionare long term buy and lose investments. Then I kick myself and hate myself. Never average loosers and cut losses. Cut them. Cut them. Cut them. Loosers average loosers.
January in bull market is a good month, if it’s bad in 2014 that would surprise me a lot. New highs are likely. Although upside momentum waned around November Fomc statement, it’s still a correction that is likely to continue with sideways/slight downside bias, likely to retest the highs and less likely to become a deeper correction. Is today’s statement going to deliver a surprise blow…to the upside? It’s difficult in top/bottom picking to catch the market safely at the very top/bottom because only in rare cases we deal with V type end of market, usually we have retests, fake-outs, lower highs/lows by a small margin, so that it’s much safer technically to get a position when the market is moving down for real. I once heard a comparison that market is like a big ship, it needs time to reverse and it won’t happen with an easy pattern. Topping/bottoming formations are IMO ideal for short time trades. I understand the challenge of precise timing the market as a specialization, though. The way Livermore timed the top in 1929, looking at the market activity as a whole. At that time there was no stock index and charts were a niche. I don’t know what will happen, but I am sure I will make some money either way. I like the comfort of not worrying about the market overnight, I never roll over losing positions. Every day is a new day and whatever the market does, it does it some way, this way is clearly visible to me and ready to utilize.
V type tops happen in fast market that goes even faster/parabolic – Nikkei in May 2013. The powerful sell signal in this kind of price action is the return into the previous channel, with no risk of fading the momentum move: we catch the top by going with the new momentum to the downside. S&P and DJIA are not that fast at the moment.
Good stuff this past week John. In my mind you have all the credibility in the world as you’ve been staunchly bullish for as long as I can remember (until very recently). Only two options I can see….1. the current one you’re laying out or 2. it is actually different this time (for time ever) and we enter into a hyper inflationary bull mkt that Jim Rogers talks about from time to time. I would side with you on option 1 but who knows with all the Fed and CB intervention world wide.
.
WOW John,
Your arguments are compelling, and seeing you took your family round the world with your profits and I struggle to take mine to Cape Town, I must listen.
Thank you to you and all the other commenters for a “must read “blog.
Merry Christmas all . Off to Cape town…. goods train.
I wonder if the T Theory expert (I think its Jan) would comment on Johns bleak forecast.
Time to look for another market
Heres everybodies christmas present…. SELL the AUS $ with a target of 80c (9 months)
regards
bobc
There’s another clue to the imminent direction of commodities in yet another low-sunspot cycle – SC14. MGI Commodity Price Index rallied hard into the first SSN peak around 1905, then after a 50% correction rallied even harder into 1910 – right into the dying embers of SC14’s SSN plateau. http://www.shannononeil.com/wp-content/uploads/2012/04/Commodity-Prices-1990-2011.gif
Commodities are in the process of doing the same thing now…
The changes associated with low-sunspot cycles are so persistent that they cause a huge build up in impatience, agitation and speculation.
A characteristic of secular commodities rallies is a huge correction, leaving the subsequent real profits in the hands of the 5%. Its incredible how the other 95% wait for opportunities to buy at low prices, and when the time arrives they are consumed by the instinct to sell at low prices (and buy at high prices).
Mark,
You mentioned a 50% correction. Are the data points in the chart you posted avg yearly measurements? B/C by visual inspection after 1905 it does not look like a 50% correction.
I recall you mentioning the “magic number” 1033. Is that b/c it was once big time resistance and then was never fully backtested on the breakout to 19xx?
I like the number b/c it would match up nicely with some analogs i’ve been looking at. Unfortunately I think the analog data snooping methodology is getting too crowded amongst us mkt participants and will render plenty of failures.
Hi Joseph,
The 50% correction I’m referring to is the MGI giving back about half of its gains from the rally so far, rather than losing half of its value. Granted, the very long timescale of this chart makes it difficult to read actual figures, but I’m only interested in comparing proportions – gold made a comparable correction during the mid 1970’s, and is doing so again.
I agree with you that many analogs are unreliable – especially those which merely compare current price highs and lows with previous ones. In fact, I believe that these are doomed to break down once they become apparent. But comparing previous major market reactions in historically comparable fundamental and natural circumstances is much more useful I think.
$1033 is one of several price levels which are inter-related by Fibonacci proportions. If you look back to my answer to Milan in John’s 19 November post Divergences, Ratios and Surprises, and try those couple of Fibonacci retracements on your charts you’ll see what I mean…
Mark
Joseph,
Forgot to mention that these Fibonacci proportions can also be applied to time, as well as price (courtesy of Milan). He has shown that gold’s timing is pointing to major turning points around now/January, July 2014, March 2015 and May 2016. These tie in convincingly not only with low-sunspot cycles, but other cycle analyses such as the Delta Phenomenon.
The big question, for me, is whether gold will bottom imminently or in about 7 months time…
Mark
Mark,
I will have to look into that info you posted further. 1050 is about the 50% retrace of the runup from 255ish to 1920ish?
Thanks all.
For the market to move materially higher from here – say a steepening parabolic – it needs new buyers or same buyers leveraging higher. The link below shows institutions have been selling out at an accelerating pace, hedge funds neutral, and it has been private investors driving the rally this year. This is reflected in smart/dumb money spreads. The kind of leverage levels we are seeing in margin debt and credit accounts are already at the levels seen at the 2000 and 2007 tops, and that’s pre November’s data, suggesting we are likely not far from exhausting the fuel for the rally.
where was I in Dec 2008? Lol. Trend follower says to leave it alone while the gutsy one say let me try to pick a top here (based on reading the tea leaves and a stop..
I admire the spirit of the gutsy one.
Hi John,
When the new money are create out of thin air, it will always end up with inflation. The inflation is ether visible (if money flows to CPI index), or non visible, if new money are directed somewhere else, out of products to be found in CPI index. The FED developed a lot of tools over the years and can use more and more sophisticated methods, how to transfer new money directly to places where they want to have them (out of CPI index, of course).
They were really successful within last 5 years transfer this huge amount of new liquidity what they have create directly to stock market and bond market, so inflation is now not visible in CPI index, because almost all of new liquidity is “sitting” at equities right now. As we know from history, this is always temporary, because liquidity will always find its way to CPI index and make inflation visible, this all can only postpone it.
BUT !!!!, history also show, that this approach will prevent the CPI index to rise as long as stock market is rising itself, because new liquidity can be easily “forced” to “sit” in equities during the cyclical bull. But once S&P has topped (in the past), the opposite was true, and all this liquidity was always immediately released from equities to all other economy, and to the CPI index as well, because the huge amount of money flowing out from markets could not to be stopped to end up somewhere else.
That is the reason, why inflation measured through CPI is always quite low during cyclical bulls in equities and very high in a few months after they topped. And this is reason why we did not have a visible inflation last 5 years, and why we will have huge inflationary spike after cyclical bear will start.
So make the long story short, I don’t think so, that we could have crash in equities and deflation both in the same time. Its just not logical. Your second option what you mentioned in article (crash in equities and deflation together) is going against this logic behind this semblance of low inflation via CPI index. And also this is why I think that commodities could not have final spike in prior to equities during this solar maximum (and maybe I am wrong but I suppose that commodities never had final spike prior equities also in the past).
John, I like your posts very much and consider this to be one of the best blog I found on the internet, and I follow it every day. You are doing very good job, and I like your style of thinking about market.
Peter
Peter,
This is quite interesting. I completely agree. Please see the section I quoted from the book “Dying of Money” (pg. 87 from original hardcover text) in the post at the bottom of this thread.
Thanks Peter. My view is demographic. Inflation needs both money supply and money velocity. The latter has been in steady decline because of demographics, IMO, hence no inflation. I think we will have a deflationary recession, in which central banks will have to even more gung ho with money supply, then post 2020 when demographics turn up, we will see money velocity rise and all the money supply that has built up will then turn inflationary.
John,
What is your take on biflation? Old folks w/ be unable to bid on debt based assets but they must continue to buy the essentials (commodity based assets).
Also in order to fund the pensions, medical benefits, & other gov liabilities for this demographic cohort, I see no other option than devaluing the dollar further. From the stats I’ve gathered, beginning 2017 the peak velocity of baby boomer retirements begins (assuming 1952+65).
Exemplary, provoking, distinguished. Exposing diligence and hard work in search of the reality and in seeking the probabilities ahead. Unparallelled.
The bigger, fatter Toad, of Toad Hall fame, croaks – Do Not Fight The FED!
So many times has this doctrine been so effectively proven (as now) to be fallacious, for now is the newer norm, now this FED thing is doomed (whereupon, all agree, and so are we all forthwith)… and yet another round ensues and the Circus audience commands yet another performance. And the Toad gains even more in dimension.
We could use Lewis Carroll, for I fear our Lutwidge would produce even better returns from pure irrelevance!
Thanks Peter
I wrote some comments on another board , as it relates to gold, w/ ideas sparked from my analysis of information retrieved from this site. John I wish I discovered this site much earlier. Thank you for sharing your work.
Please read and let me know your thoughts:
Thanks for sharing. I started following that site this year when I became interested in solar cycles. IMO John’s site is the best out there on the subject; very straightforward and no unclear contrived posts (those typical rhetorical tactics used by these soothsayers to buy themselves outs on any outcome)
I’ve been spending some time in particular these last couple of weeks researching demographics (idea sparked by John’s discussion on his site). There’s plenty of demographic models out there that have been back-tested and are suggesting stock indices are headed back to single digit P/E s by the end of this decade. But even as the back-tests have shown there can be intermittent deviations such as right now.
My conjecture of things is that the metals cannot make a run w/o stocks taking a hit. Stocks are acting as a reservoir for latent inflation.
pic.twitter.com/SIfsB1ylTb
Even so, there is still leakage and we are seeing price inflation. You can riddle me all you want but the tuna cans, the yogurt containers, the cookies, the potato chips are all shrinking or the supposed “New and Improved” formulas are just fancy vernacular for the substitution of quality ingredients and parts with cheap crap. But even though the CPI measurement has become spurious, bonds are artificially being propped up as well keeping the yield low. So the direction of each bias still leads to a semi useful REAL 10 yr bond yield which can be compared in a pseudo apples to apples comparison to the 1970s.
Here’s a couple analogs I’ve been following:
4/3/74 vs 9/5/11: http://twitpic.com/dp0xji
12/27/74 vs 10/4/12: twitpic.com/dp0xpw
12/27/74 vs 10/4/12: http://twitpic.com/dp0xpw
The conclusion from all this is the bottom will be nearly impossible to nail. The latent inflation trapped in the mkts was not being released until after the bottom (Aug 1976), real 10 yr rates did not start to decline until after the bottom, the inflation rate did not increase meaningfully until after the bottom.
I am trying to get my head around the current market psychology and it’s relation to when stocks top and how it relates to the current solar cycle’s speculative target class. As much as it looks like the dow can top from 16.4k to 17.2k, the current market psychology does not suggest a top is in. I still think too many think this is a bubble. You cannot have that type of aggregate psychology and have a top. So I see one of two things happening: stock indices will grind along these long term trend lines from yr 2000-Current (see djia 1976 grind along resistance) or we get a massive run with some big monthly bars to suck in a sizable amount of retail. Before the 2000 top and 2007 top there was a last minute pop of a 6% increase in retail participation (Gallup was my source on that (implicitly) ). Going back to how it relates to Solar Cycle 24, a low sunspot, lengthy plateau topping cycle, I think it’s still unclear whether the finale of the solar top will top with stocks or if there will be a sudden blastoff for gold and other real assets. From some analogs Ive looked at in solar cycle 24 vs. 10 14 and 16, the final top of the plateau is likely in late 2015. So will stocks keep running until then or will there be some abrupt action coming soon to bring gold out of the woodwork. We shall see.
Thanks Joseph. Yes that’s my conundrum too. If equities top out whilst commodities start to rally, then it will be akin to 2007. There were several factors as to why commodities had a big 6-9 month rally whilst the global economy was already tipping over in 2007-8.
Commodities do typically perform as late cyclicals and suck the remaining life out of the economy whilst it is already in decline, that’s history.
In 2007 demand supply was tighter in commodities than it is now, so that factor back then doesn’t apply today. Rather, collective demographic trends could weaken demand yet further and that in my opinion is the alternative: that commodities sink and we go straight into deflation.
Back then, speculators turned to commodities once stocks lost their luster – and the same easy money speculative conditions apply to today to enable that again if stocks roll over – the rally back in 2007 was more speculative than fundamental, as most commodity rallies in history are proven to be.
The US dollar accelerated declines in 2007-8 which was another reason for commodities to rally. The dollar is currently weak and flirting with another break down, but it is too early to say if that will happen. If it does, I think it could be enough to offset the demand-supply issue.
A story to which traders can attach. Back then it was the idea of peak commodities. Now it could be anything ranging from geopolitical developments to some idea that hard assets are the only store of value under ongoing currency devaluation. Just my speculation.
Post FOMC fireworks, RUT shorts stopped out.
No decisive breakout in the US indices but clearly strong bullish performance and that may come next, probably pushing us out to Jan for a correction.
Investors intelligence spread stayed at the same record spread this week, meaning despite the pullback in equities last week, sentiment stayed super bullish. This maintains the likelihood of sharper correction ahead.
There is also a possibility that yesterday’s gains are instead given back gradually and it becomes part of the overall consolidation/correction range. The Hang Seng today reversed all yesterday’s Fed leap and more, falling back beneath the resistance which it broke out of in November. So need to see how things unfold today and tomorrow.
Japan tapered QE in 2006, stocks rallied for 2 weeks then entered bear. Japan was more aggressive than US is being though – Japan stopped short term operations completely over course of few months but maintained buying long end. Nonetheless, if you subscribe to my idea that this is a bubble and the Fed policy is the pump, then tapering may potentially not be taken so well on digestion.
HI John,
i have posted before but i will say it again, you keep an excellent blog! Anyway, I think the HSI fall today has been prompted by the overnite spike of over 100bp in the SHIBOR rate – one can see today how the HSCE did even worse than the HSI and finally closed under the 50DMA. Not to mention that there are heaps of callable bull contracts in the 22600 to 22900 asking to be killed.
Yes. Liquidity (the lack of it) forced traders to sell their contracts. It took gold down with it. China is problems galore and should be bought (lightly) only based on a long term hope. For now, a lot of bad things can happen.
What did Japan do with interest rates at the time?
I propose you all post and verify your trades on profit.ly =). I have not attacked anyone. Why do you feel that way? The market does not care what I think or what you think =). It will do what it will do.
You are trading short term and you are right, but I think that John means intermediate term and long term. So I think John is right too.
Excessive greed in a bull market is always purged with very sharp, but short living corrections 10%-20% for several weeks and this time it will be the same…
I think the next bigger move will be to the downside… from 1800 or from 1850 sp500 I do not care:)
I was short at 1810 took profits and reversed long, but I am still a bear for the intermediate term.
Yes I am watching the charts like you, but with bears at 14% and DJ for example hitting the upper trend line with MACD and RSI divergence expecting something more (intermediate term up move 3-4 or more months and >10%) than short term gains is nonsense for me.
In the next 2-3 months we will see who is rigth:)
WEEKLY MACD and RSI divergence very important:)
RSI and others don’t show, if the move is out of steam or not. It may be at 70 or 90 and the move still continues! RSI divergence doesn’t show anything, the move may continue at slower pace and then accelerate again, and RSI takes off to retest its highs/lows. When the market goes, it can slow down, correct a bit, correct more than a bit, correct much, reverse, or just stop for a while, and in all cases RSI will display a kind of divergence.
For example, Wednesday 5m DJIA price action. RSI 14 peaked at 75 (19.10 UK time) and retested the high (19.40), made lower low at 63 (19.50), while all the time the market was on the move till the closing bell (21.00). Why wasting time looking at RSI? Do you want to fade that move coz you fancy fading? Let’s say you fancy to go with the flow, and you buy at the close of every decent red candle of that move up with 11 point stop. We had 6 decent red candles between 19.10 and 21.00, your result would be – one loss and 5 wins with over 500 points gain. Such is the meaning of momentum and pyramiding.
And another example: using karni’s weekly MACD divergence, you’d have bought the Dow at 6296 on 8 March 2009 – and now be up more than 9250 points.
@Mark
As far as I am concerned, 2009 low was a clear case so that most moving average crosses worked, trend line breakouts, high/low inversions etc. But how often the price action is that clear? Take any technical method, all of them worked in 2009, even if you trade 666 number, you would make more that 9250 points.
What there is no valid weekly MACD divergence signal for the next 10-20 years? What if there is no another 666 at all?
I do not believe in squiggly MACD, RSI, Boolinger etc. Price is same on all time frames. I only believe in horizontal lines. Why would you use an indicator that is squiggly based on candle sticks? Ask yourself why?
Simple because it shows when a move is out of steam…. and now it is definitely time to be cautious, take the chips of the table and trade only short term.
P.S. my system signals are based of course on levels not on indicators…
When squiqqly gets hit I buy with confidence / hit the gas =). It can stay like that for a long time as shorters get sqeezed. Only when the short sellers capitulate and price confirms on the chart I short. What is the magic RSI number =) 7 perdiod, 14, fib number, your grandmas birth date? Indicators suck together with equity research analysts sorry… =)
I shall be quiet now and only observe that is my New Years promise to you’all =).We are in a bull market you know… God bless.
This is a quotation, use “” please 😀
still think this has a feel of 2000-top and 2007-shoulder. Meaning that we get a topping formation, extended by the new-year rally… and breaking down in January.
Today I had a look at fourier spectrum SPX weekly last 50 years, and the dominant cycle has been a ~6,5 year, that tops out here around New year…
To unwind FOMC / taper purchases @ $10 billion a month per month. $85 billion in purchases to unwind in $8.5 months. Looking at July/August 2014 for tapering to be done. Then a period of time where interest rates remain unchanged. Rates to begin rising a year later mid-to-late 2015. Stocks face temporary drop due to taper reaction but regain with new highs breaking through to 2015, but not at pace seen in 2013. Need to pay attention to China’s QE and Japan’s QE now that we are tapering.
Increasing GLD shorts
Mark:
Further to your post on 12/18 where you correlated commodity prices with the progression of SC 14; the chart indicates that prices bottomed approximately
18 months prior to the price lows in 1907. This assumes a peak in March, 1906
re the monthly SSN? It’s hard to read the chart to know the exact month of the price low in 1907 (I’m guessing October, 1907); so this is the best my eyes are able to see. Looking at SC 16 the SSN peak occurred in April or May of 1928? Dome Mines and Homestake bottomed on November, 1929; or roughly 17 months–again–after the SC peak. I’m attempting to draw some time comparisons to see where we might expect a low in the price of gold; using the same data for the current SC24? Just some thoughts; and maybe someone in the group can chime in on this information? It seems the batting average is 3 for 3 although gold was already moving up w/SC10 when it peaked on 12/31/1861. (The SSN peak occurred that year in circa March, 1850.) Thanks for your thoughts.