
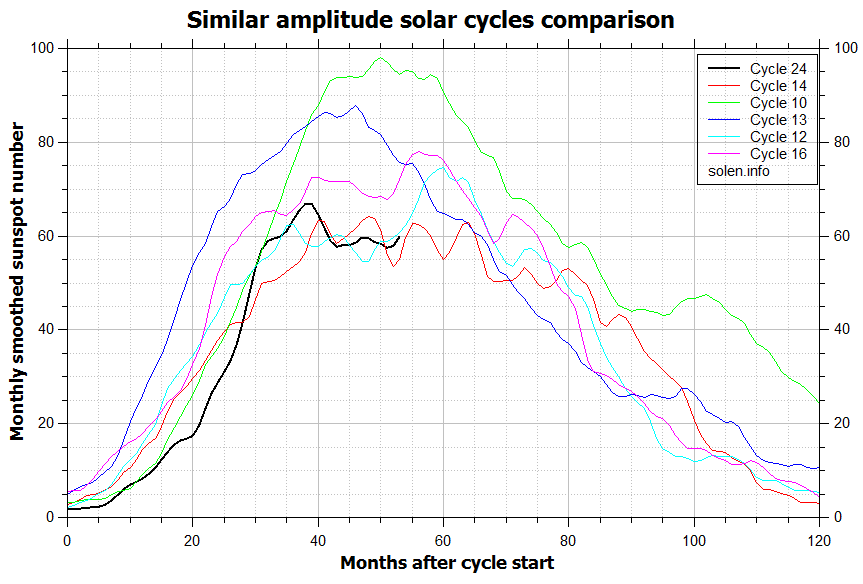
Here is the progress of current solar cycle 24 overlaid on previous solar cycles of similar amplitude (i.e weak sunspot cycles):
 Source: Solen
Solar cycle 24 is going to be flat-topped, making SC16 and SC14 most similar in progression pattern.
Weaker solar cycles such as these generally produce less geomagnetism (geomagnetism being negative for risk markets), whilst flat-topped elongated peaks could produce a sustained period of sunspot-driven speculation (assuming sustained biological impact on humans). On the flip side, we might presume weaker solar cycles produce less human excitement/speculation overall, although markets history does not suggest so (correlating market manias with solar cycle peaks of differing amplitude).
So, a bit of weekend speculation on my part, but here are solar cycles 14&16:

The source is Solen.info again and I have added the market peaks.
Solar cycle 22, whilst of bigger amplitude, also had a flat top from 1989-1991, and we saw Japanese stocks peak out in 1989 then Japanese real estate in 1991. Solar cycle 20 was also flat-topped from 1967 to 1970 and we saw various markets peak out in turn in this window (as per my recent Solar Parabolics chart). The Dow’s big bull market into 1929 largely ran from the beginning to the end of the flat solar top. Therefore, I am wondering whether there is something in a flat-topped cycle producing a ‘period’ of human excitement and speculation.
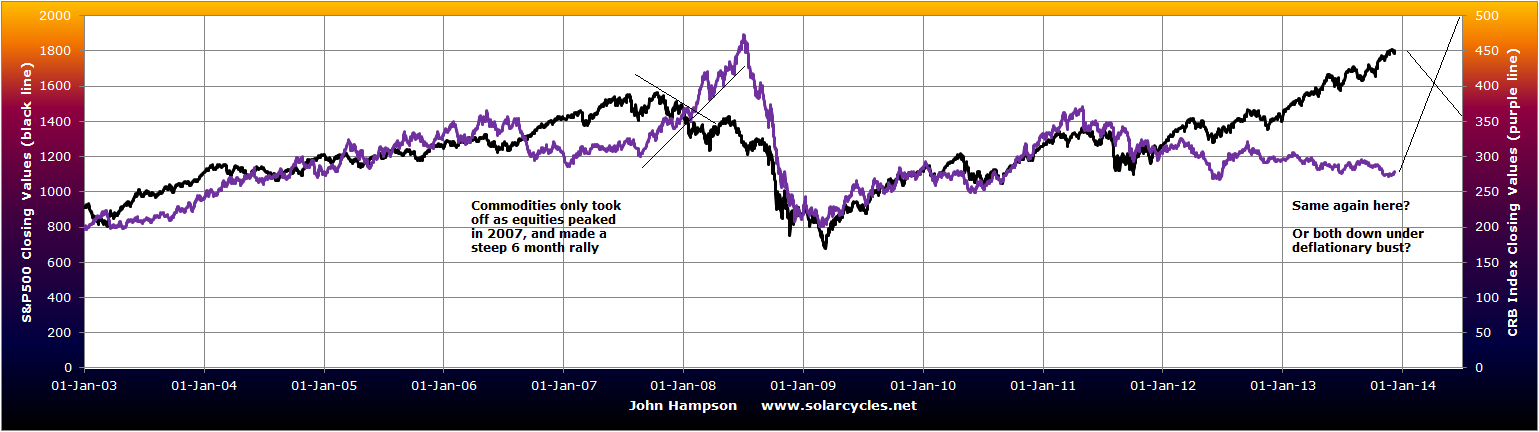
Our current solar cycle, 24, is likely going to look flat-topped from 2011 to 2014 in retrospect. Commodities (by CCI index) peaked in 2011? Equities to peak as we turn into 2014? Both with bumper gains from the lows to the peaks.
I previously focused on the correlation between smoothed solar maximum date and market peak dates, and occasionally there was a notable gap, but this is resolved if the ‘range’ of the solar maximum is considered, rather than just the smoothed peak. There’s also logical appeal of sustained human excitement whilst peak sunspots are sustained. Again, just speculation on my part, but we can expect solar cycle 24’s flat top to end by mid-2014, and I therefore suggest we could see one of two possibities playing out. One, equities peak out within the next 6 months, commodities don’t come again, and we thereafter enter the typical post-solar-peak recession (deflationary). Or, two, equities are peaking now and commodities are breaking upwards out of their large consoliation triangles since 2011 to produce a typical late-cyclical final rally and help tip the weak economy into that recession.

We’re a year away from the mid-point of the decade, and BRIC stock markets are in bear markets. Do people think they will all start to stage a recovery in 2014, or will the 2010s serve as a lost decade for BRIC stock market investors?
My view: they will be brought down in global bear market.
It appears from ye olde P&F that gold objective has turned bullish, now targeting $1350 & portending ongoing weakening of US$, albeit in an obtuse & dis-inflationary trending environment. Nature points to a man-made malady.
I see a rounded bottom on gold being formed. Precious metals and miners sentiment extreme low. Physical demand for PMs still strong, so I think a decent chance of a change in trend.
pretty good edge for some more upside in Norway, but if we reach minimum target tomorrow, I cash in longs
In my opinion, both down
@apanalis
John, please, is possible you can add the 14-15-16 Solar Cycles with th Dow Jones in the same chart attached? My thesis is that current Dow Jones is in the same stage 1906-23 (2000-17/2023) before the final step to 1929 ending-spike-90-100 years cycle (from 1835), in this case 300-years cycle since 1720.
It would be illustrative to compare also with 1966-83 solar cycle to regard some similarities.
Thanks a lot.
@apanalis
I don’t know how to do overlays.
You did. In your chart from 2000 to 2013.
I only request for Solar Cycle in those periods to see similarities to current one from 2000 to 2017.
Thanks.
@apanalis
Think the chart at the bottom SP500 regarding the intersections is plausible for that phase of the cycle. I don’t believe the phases match i.e start of next cycle versus decline of the existing one. Think in 2019 your last chart with the purple and black intersecting will have a possibility. I think gold to go up but back down again. Seen the 2014 Bradley? The overall height is lower then 2012 and 2013. Also don’t think you can make connections to 1927-1929. Seen some talk about that lately. I still think I am onto something if you factor in price weighting, buybacks, and share volume versus QE/money supply. It would be interesting to see the DJIA in terms of euro and yen price today past 30 years. Apply forex rates and valuation to inflation and disinflation. Even in price-weight indices this should show up. Think stocks dropped so much that half of their gain since 2009 /2010 should be ignored completely as smoke and mirrors. If it were would folks still consider it a bubble? I don’t.
The charts in my post Equities Bear Market Coming suggest it is a bubble. Plus it has the ‘new norm’ of ‘Fed’s accommodative policy means stocks can only go up’, i.e. a suitable this time is different mantra. Dot.com and 1929 bubbles were at least blown during boom times – this is potentially a more dangerous bubble in that it has been created against a global economy on life support.
I think the charts reveal a bubble and traders as yourself will act accordingly producing a drop and the central banks cannot control it. However, I don’t foresee it being like 29 or 99. More like 87 and recover. The fact that charts factor in price when looking at if it is a bubble is why I think you have some stating this is not a bubble, but noticeably different from other times. Call it something different. Stock buyback on major companies will have an effect. I heard they are doing it to get bigger bonuses at end of year versus investing in working capital expenditures to create something. Buybacks have to do with demographics and low interest rates. All the money from the bond markets also be funneled into equities this past year. I also read somewhere there is still a lot of idle cash – above the average.
I think we still need the inexperienced users to enter the market and acquire based on sentiment and price crashes due to demand is not there. If QE were not there, what would be the value today. Japan and USA QE dwarfed China’s QE provides some equilibrium. My gut is telling me there is more to the picture. 1929 and 2008 lowest points in multi-decadal Bradley – something to think about also. If I saw folks like me becoming like you John, to mimic your choice of profession, like we saw here in USA real estate, I would be worried.
Isn’t like the US economy picking up? Last time I looked at train cargo loadings they looked very good… The economy does not matter for the stockmarket. Also demographic theory is utterly flawed. Older people do not need as much money as younger so they spend less and give more to their children who can invest more. Only thing that mattters is quantity of money :). The flat peak may cary own for a year, or two or three or whatever. You do not know where the solar peak will be 🙂
Ask yourself why you are obsessed with having a view or thesis or whatever in the market? How does it feel to look smart and be smart? Is this feeling more important for you than making money consistently?
Older people need as much money. Just what they spend it on changes. Typically they spend less because they have less to spend, but if given an asset providing passive income and all expenses are covered, they are apt to spend it and not give everything they have to their descendants of some sorts.
I thought I saw train loads decreased YoY recently somewhere.
Gold will either hold support or break and then timber below. No way to know in advance… If you are a dip buyer then buy but they your losses if you are wrong. If you are a trend trader then it is a short 🙂
Robert, like I’ve said before, it’s my personal leaning to trade global macro and try to work out the puzzle, it’s a crucial part of the job satisfaction. I couldn’t do some repetitive mechanical trading. I am also a top and bottom picker. Making money is more important than being right, but doing both is the goal. Both the global macro predicting and the top/bottom picking have made me good money since I went full time 5 years ago, but getting commodities wrong this year has provided an impetus to improve my technique (not change my approach).
I see a correction in the stock markets in place since the start of the month and gold has stabilised in a price range. So I can’t agree on either that they are momentum or trend trades, at least until breakout or breakdown occur. There is compelling evidence to consider extremes in sentiment, valuations, margin and divergences in breadth – which are all flagging that it is very dangerous to keep playing long at this point, at least until we have seen a proper correction. The risk-reward is on the short side.
Very cordial response…and good point taken about trading styles… we CHOOSE how we want to trade.
John, you try to pick a top with a stop….It is a trade based on good discipline. Carry on.
Thanks
Ok. My feeling is that gold will crack and go lower… =)
3 sessions before FOMC are usually quiet. Not this time…
Stock markets and Bitcoin both made their peaks-to-date on 29 November. Anyone got any telling insight about that day/date?
Gold and Bitcoin crashed in the same week in April this year. I personally think Gold bugs get caught up in the conspiracy theorist group mentality and get roped into buying Bitcoin too.
Some one once must have said that one needs his own style in the market : style that fits his personality. Now more and more market people repeat this phrase as if it was true – although it’s BS. We need to find our own style for two reasons : 1)looking for a way around the market, we gain experience which is necessary to make money 2) we all need a different style to have an edge among other traders. Probably the best way nowadays is sheer stupidity while there is so many quantitative expert funds and computers in the market.
I mean style has nothing to do with personality. If people can work underground, nights, on the battlefield, in the ring, in the hospital and in any other kind of hazardous conditions regardless of personality, traders can adapt to trade 20 times a day S&P or once a month pork bellies, only if they find for themselves that this is profitable.
Or, we may look like cycle 12
Could you please provide a chart with sunspots for cycle 12
http://www.solen.info/solar/cycl12.html