

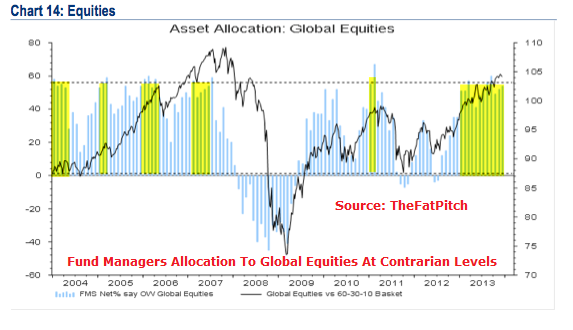
Second largest and third longest equities bull of the last 80 years, set against an economy that 5-years post crisis is still on life-support. More than 80% of the gains in the last two years have been multiple expansion only, without earnings growth, and the SP500 is on a run of almost 2 years without a 3-week losing streak (the second longest run in the last 40 years – source TheFatPitch). Impressive, in a perverse way.
Click on the charts to view bigger.


Yesterday was a flat day in the US stock markets, but breadth was 2:1 negative. Gold may finally be capitulating, Demark target 1155-1180. Stocks to top, gold to bottom, but as close to Xmas now, may have to wait until January for action.
if you’re right we’ll be looking frwd to seeing you on CNBC soon John 🙂 that said, that Demark guy has been calling for various tops since early this year (none of which has come to pass needless to say and about 300 SPX pts since his Spring call).
“that Demark guy” has made some of the most accurate calls in the business, just not this year. with how accurate he normally is, i’d say its a perfect time to pay attention to his recent one. especially when people are ignoring him after a few premature tops calls.
His recent call is aligning with John’s for a top now thru early Jan.
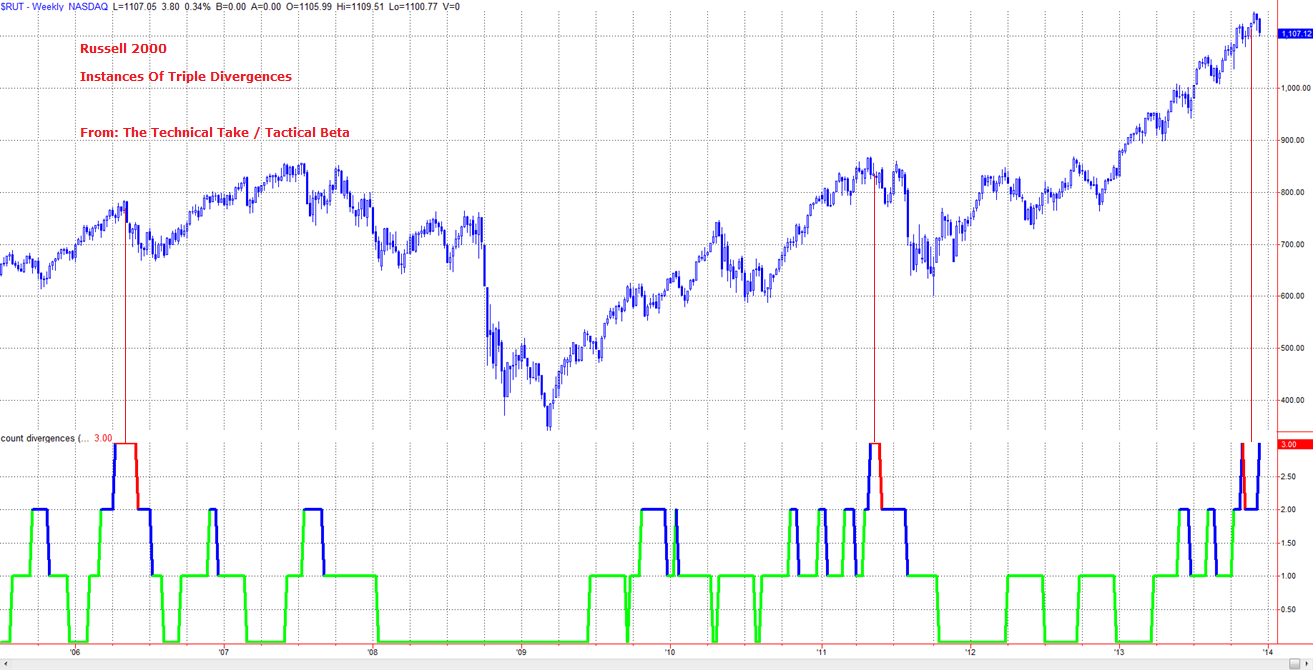
As always, thanks for your blog and the time you put into sharing it. In this post, do you know what is meant by the “Triple Divergence” in the Russell chart above?
Thanks again. John
Cluster of 3 negative divergence price bars in a short space of time
The single best gauge for the “economy” are train cargo loadings according to Buffet. His dessert island indicator. Not looking that bad I think. Where does the life support paradigm come from? Gld broke support yesterday and is in a downtrend…
His favourite equities valuation tool is total market cap to gnp – not looking so great
train cargo loadings is his desert island indicator… GDP is flawed. HS broken on the 15 min in GLD retrace a bit and then it goes down. Increasing shorts.
GNP numbers may improve… =) valuation is bogus. just buy the break outs of what goes up a lot and sell short the break downs. Blackberry, Herbalife, Facecbook, Linkedin….
Robert-
the GDP and GNP numbers are not far apart. Valuation is not flawed and never has been. It wasn’t flawed in 1996, 1997, 1998, 1999, or 2000 and same in 2005, 2006, 2007. It’s only flawed in the present and “so obvious” in hindsight. And since you are quoting Buffett you probably know what he says about short term and long term with regards to what drives stock prices.
Maybe you said this in sarcasm, but I’ve seen many come across with this attitude of recent. Either they are a) too new to the game (green) or b) can’t process history or don’t want to (this time its different meme/crowd)
The major problem I am seeing is that people do not understand the difference between the different types of bubbles that have or are occurring. They use typical valuation metrics to argue we are not in an “stock” bubble. This isn’t 2000 b/c “x” company/ industry/ sector/ index isn’t trading at “y” (insane) multiple. Guess what, we weren’t in a stock bubble in 2007. We were in an asset bubble driven by leverage (debt accumulation).
The issue here is most don’t take into account for debt and how the growth of debt inflates asset prices. No one accumulates debt and sits on it – they spend it – on plants or equipment or buybacks or M&A and so forth and thus leverage earnings.
Most know corporate profits are at an all time high but they are nowhere close when measured against total debt. This has been fueled by the Fed’s ZIRP. Here is the link for the total non-financial corporate debt to asset ratio: http://research.stlouisfed.org/fredgraph.png?g=qff
During the recession this indicator spiked as asset prices collapsed relative to corporate credit market instruments. We are now at 27% debt to assets, which is only 1% away from the all time high. There is no deleveraging taking place on corporate balance sheets. What was being deleveraged was the consumers debt but the Fed has equally (now more) created what was lost here by buying up “assets” (UST/MBS) to the tune of $1 trillion this year, $900 billion next year.
Back to the corporate debt situation, and I mentioned this in a previous post, debt investors are significantly more complex than equity investors in my opinion. They are the true smart money. A small lot in stocks is 100 shares where in the credit space it’s $1 million. Credit investors are moving out of some of the more riskier corporate bonds. I’ve been following some companies bonds (low quality debt) and finding that while the companies equity is up to the tune of 50% on the year, their bond prices are down (yields are up). This divergence is deeply concerning.
High yield and investment grade spreads are tight on the broader scale but once you begin to get a bit more granular, thee are pockets of deep concern. 2014 will tell us how this ends.
I agree with John on being short, however I am not “blunt short”. I have long exposure as well in certain equity and historically positive correlated instruments. However, I do not like high beta equities (proxy: Russell 2000) and transports. I am building a concentrated short portfolio with these two as the largest holdings.
Secondly, on the short front, I am looking to get short some of these equities that have had extreme upside equity performance and poor performance in their bonds. Again, these are “junkier” bonds and as I watch the bond/equity performance diverge, I’ll look for technical entries.
Yeah I am green for sure and constantly keep on learning. I am a market student but not a yale student. Somehow I have been able to trade for a living for some years and I am happy about my life. What I have learned is to never get married to a view. Neither up or down and most importantly not pay attention to analysis or funnymentals =). The market will do what it will do. The markets can get more overextended than any funnymental model or view can ever capture so I think it is a waste of time to keep track of it, try to learn it or most importantly put any value into your psyche about it as we are entirely controlled by our emotions. When looking for information this way we use something called confirmation bias to confirm our views already and the market just does not care. Since 95% of traders lose money and most of you are bearish here I look to go the other way. Simple equation. As I am quite good with programming I have tested most relationships and indicators etc and just do not find it useful for longer term trading survival. =)
GNP or GDP or whatever is something us people have invented or rather governments and you can never be sure about the statistics or how it changes or whatever so it is completely pointless. But sure it is taught at universities etc and brainwashed people look at it. Buffet says alot of things that you then believe as if he was your friend. =)
Train cargos are good however as you are only counting something that is actually there. It is good as a gauge for where the economy is going. However, the economy and the financial market game are two different animals. =)
If things are going well for you in your trading just post your trades and verify them at profit.ly
Robert-
Most cannot separate book from bias. Plenty of recent examples as bearish fund managers (both in book and bias) are now flipping on both ends only to protect their financial reputations. That’s a statement in itself.
Timeframes can make both right and wrong. I suspect my timeframe is longer than yours. More importantly, I focus on size and weighting (exposure) rather than timing. Take Bill Ackman as an example. How long was Ackman wrong on MBIA? Over 5 years. What a fool he looked liked. Then, in less than a year, it became one of his most successful investments. Unlike MBIA, he clearly overexposed himself in HLF – therefore size and weighting was not his concern as it was timing. I know what % of my portfolio I am willing to lose on a certain bet versus what I might receive out of being right (risk/reward right?).
History should not be ignored but doesn’t indicate set levels until “x” happens. Clearly you are a momentum trader and nothing wrong with that at all. Our views are different. Fundamentals always matter and always will. Hindsight is an amazing tool and everyone is/was right when it is used.
Longer term survival, as you say, based on your measurements doesn’t mean it is wrong. It’s based on your inputs and I have no doubt you haven’t covered them all. Plenty of money is made by fundamental investors (long term) as well as technical investors. The biggest money has been made by those with fundamentals views and especially those who took contrarian views (typically bearish on certain assets) when everyone else was… well…. following the momentum. This list is well known.
Good luck to ya.
In terms of DeMark he stated in a recent interview with Michael Covel that the reason for his indicators not working as well as they have in the past is due to, surprise, the activities of the Fed. To his credit, this activity was not something he pointed to in hindsight – he alluded to it a couple years ago without knowing exactly what was going on, only that he noticed something strange going on in markets. The question for DeMark advocates is whether the retreat in QE will result in his market exhaustion calls gaining greater accuracy.
Tom Demark = Elain Garzarelli…..flashes in the pan….class A clowns.
I kind of agree with everything you say Egg, but I think the one thing everyone forgets is that with interest rates so low, equities are the only game in town. Cash is looking for return and there are few places you can get one. Until interest rate go up or overall divis drop to a point the risk aint worth it, then this thing could keep going? what do you think?
Hi TC. That’s what’s happened: cash and bond yields have been suppressed, making for this big bull in equities despite earnings and economy, until we have got to the point where leverage, bullishness and valuations have reached extremes. I guess you are implying they could all go yet crazier but I think we’re reaching a craziness limit, as the various charts I’ve put up are drawing together. E.g., Rydex leveraged bull-bear ratio is over 4 times what it reached back at the peak in 2007.
Hi John,
I think you have quoted Chris Puplava;s work in the past.
His recent article argues the opposing case to yours.
Any thoughts?
http://www.financialsense.com/contributors/chris-puplava/maximizing-profits-identifying-major-market-turning-points
Cheers
W.
See my newest post, I touch upon some of that. I think he’s got this one wrong.
Global Auto Index loosing steam.
http://stockcharts.com/h-sc/ui?s=CARZ&p=D&b=5&g=0&id=p11631398750&a=297721515&r=1387624948145&cmd=print
And a potential divergens between RSI and Price on Baltic Dry Index.
http://stockcharts.com/h-sc/ui?s=$BDI&p=W&b=5&g=0&id=p77228697824&a=220135997&r=1387625124550&cmd=print
Maket Vectors Retail is getting a bit extented.
http://stockcharts.com/h-sc/ui?s=RTH&p=M&b=5&g=0&id=p77441393661&a=254303027&r=1387625242111&cmd=print
http://www.amazon.com/The-Signal-Noise-Many-Predictions/dp/159420411X
Good book but I think there is NO SIGNAL only NOISE =)
Heed to the trend-follower. An open minded trader may want to explore trend-following as a “do”/way. Choose as you wish as there are many paths leading one to Rome.
I expect a low in gold not until 2014. Ideal would be a low around March 2014. I derive this from my indicator shown here once.
I, for one, would like to know how said trend-follower avoids the whipsaws that so often snag the breed. If one reviews the performance of CTA trend following over the past few years it has been, well, poor. That is not a commentary on Robert’s approach. Rather, I’m interested in his take on how one avoids the traps that befall others. I’m also curious how he determines when a trend has permanently changed. Are there particular metrics he uses that he cares to reveal?
One of the best trend followers is Jon Boorman, IMO. You can check his work and see how he does it. The moving averages he uses and his bases for open and close his positions….
http://jonboorman.com/
Thanks, Newt. I’m also interested in Robert’s thoughts, in detail.
http://pragcap.com/the-single-greatest-predictor-of-future-stock-market-returns
had a nice bearish setup, but I wondered whether FED and the seasonality would ruin it… and they did.
So we got a new buy-signal, but never got oversold. Is this for real, and very bullish, or is it a fake?
—-
6 month cycle is now bullish into Feb-March ++
SPX tried to correct at the cycle low, and the T-expiration in December… but it was very very shallow, and interrupted by FED and the bullish Xmas seasonality.
And allthough SPX never met the minimum closing target of 55ema ~1760, it has turned up and made a new buy-signal that projects a February top.
So this may either be very bullish, and SPX shoots up into February
OR it can turn into a collapsing T, and a collapsing cycle, which both is very bearish
Weakness next weeks and in January is not allowed, and the critical level is ~1775. Breaking below probably means a collapsing T/cycle, and should produce a downtrend into the summer.
But for now, the buy-signal is in work, until it expires or is cancelled…
ridiculous action of late…never had a “low” per se over the last month + and back up we are going….
Everything I know and use to trade is based on info available to all…I quantify that info by collecting examples of the same setup… I usually stop at 3000 examples.. Then i ask how often does price go to the minimum target given by the setup… In the case of an abc retrace that completes @.382 the target is the beginning of the pattern, i.e. a new high.NOTHING I use is 100%…the abc 382 is 85%…I can CHOOSE to trade against the setup on the short term…. but I always keep the bigger picture in mind…
http://stockcharts.com/h-sc/ui?s=TNA&p=60&yr=0&mn=8&dy=13&id=p59532245979&a=326760386&listNum=26
if you go to your GLD chart you will see the same at the late sept high…with the new low, it was added to the archives….
I VALUE GREATLY the work posted here by our host….but i also understand completely Robert’s view of trading the technicals… I simply will not trade a forecast unless i am entering based on a setup i have seen the computers hit countless times.
I know this too…I still feel bad over a year later about being tossed from a forum where I was originally an invited poster but over time posted too much and often at odds with the host . I wish in retrospect I had done differently.
Thanks all