
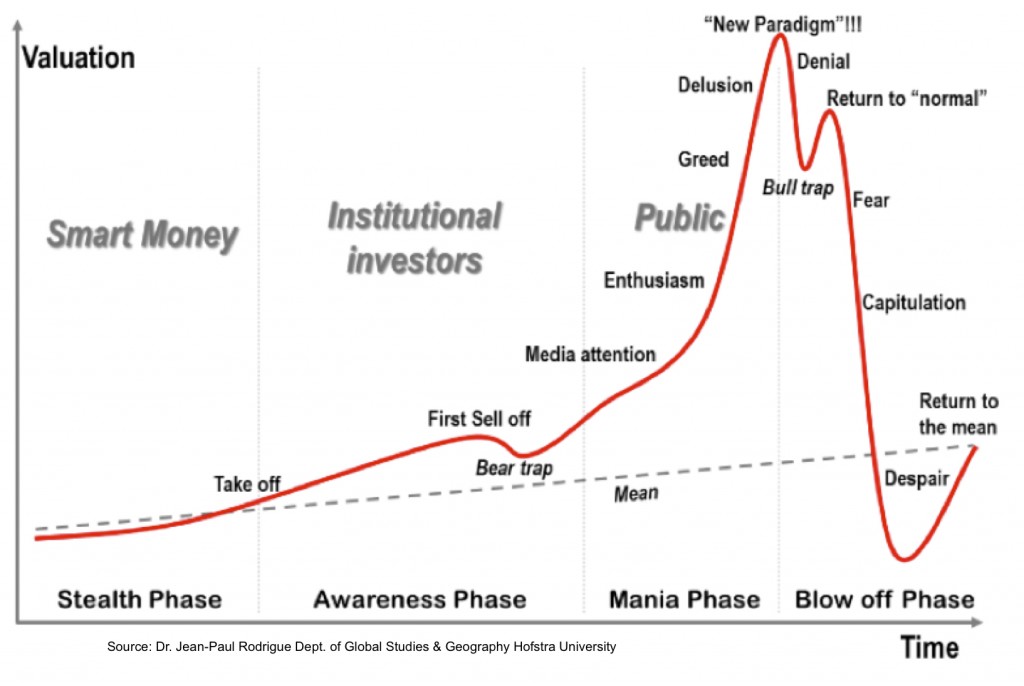
I think Bitcoin isn’t coming back. Bubble popped as per the bubble anatomy model below, and now at fear-capitulation:
 Source: Bitcoincharts
 Source: PortfolioProbe
Now what about the stock market bubble? No bubble?:

Source: Dshort

Source: John Hussman
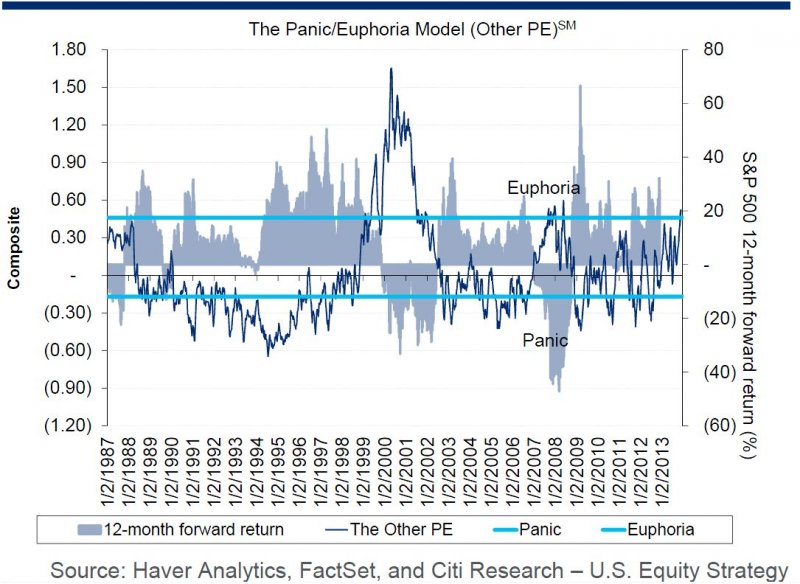
The Citigroup Panic/Euphoria model is a composite of NYSE short interest ratio, margin debt, Nasdaq daily volume as % of NYSE volume, a composite average of Investors Intelligence and the American Association of Individual Investors bullishness data, retail money funds, the put/call ratio, CRB futures index, gasoline prices and the ratio of price premiums in puts versus calls.
Add in the declining trading volumes and I believe we have a recipe for a crash ahead – the question is when. An overleveraged, thinning stock market participation, trading at historic overvaluation and euphoria extremes. That said we have to understand the current context: surpressed cash and bond yields makes equities relatively more attractive, so worthy of higher valuations. Here’s a model I’ve used before to assess the environment for equities:
1. Inflation rate – Stocks have historically risen when the official inflation rate is between 2-5%
Inflation is below, so this is a negative.
2. Bond yields versus stock yields – Long term gov bonds yields should not exceed stocks yields by more than 6%
Equities are largely yielding more than 10 year bonds in the major nations, so this is a positive.
3. Interest rates – interest rates should be low.
Ultra low – so again positive.
4. Yield curve – should be normal.
Yield curve is redundant under a balance sheet recession, and I believe that’s the current circumstances. Therefore irrelevant.
5. Stock valuations – Stocks P/Es should be historically reasonable (historic average 17)
Overvalued by CAPE, Q ratio and a number of measures, so negative.
6. Investor sentiment – II, AAII, Market Vane should not be overly bullish
Overly frothy sentiment, e.g. II bull-bear ratio at highest since 1987. Negative.
7. Money supply – should be growing and strong
Collective narrow and broad money measures weakening to flat of late suggesting we may be seeing a top in global industrial production as we turn into 2014. But no clear trend, so I suggest neutral at this point.
 Source: Moneymovesmarkets
Overall it’s a mix of positives and negatives, but notably both at extremes. Stock-bond yield differential at extreme in favour of equities, but equities overvaluations extremes, for example. So which is ‘right’? You know my view: unprecedented collective demographics point to deflation and declining equity and real estate markets that cannot be overcome by government intervention. But this may yet take time to unfold.
Corporate bond yields are also into extreme territory, putting investors into the same kind of risk predicament as in equities.
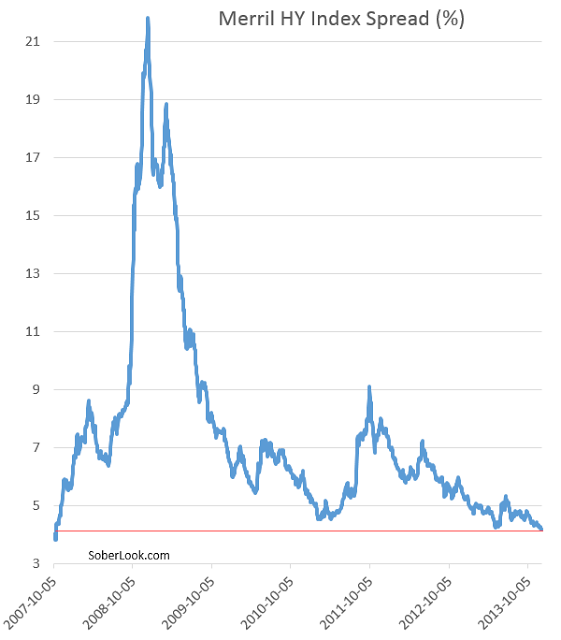 Source: SoberLook
As my trading focus is currently short term, I’ll end with my view on that. In line with excessive sentiment readings reached at the start of December, most major stock market indices pulled back last week. A notable exception was the leader, the Nasdaq, which consolidated sideways and then broke out on Friday to end the week at new highs. So more Nasdaq parabolic?
My opinion is the Nasdaq is actually going to reverse this coming week and be the last to join the correction. Volume was notably lower on Friday on that breakout, which is a sign it could be reversed. We are into the lunar negative period and there is a geomagnetic storm in progress this weekend. The Nasdaq shows a breadth divergence for the last 2 months, which again is suggestive of a correction:
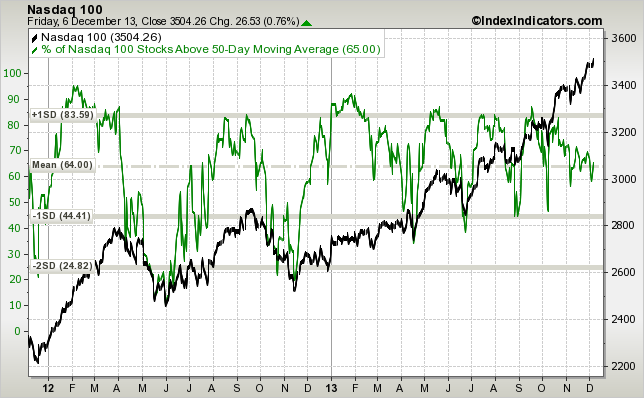 Source: IndexIndicators
When the stock market reached those kind of sentiment levels in the past, normally a correction period of several weeks followed:
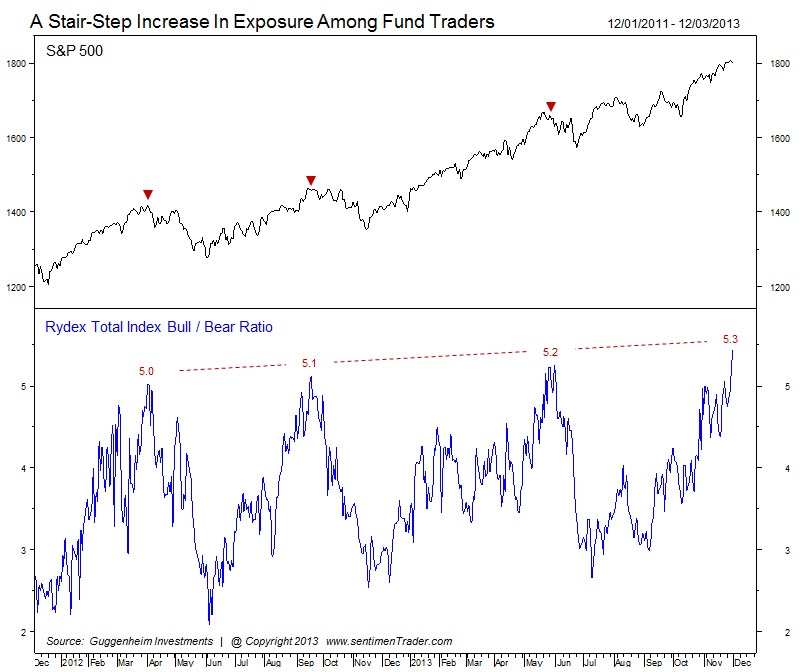 Source: Sentimentrader
Monentum has also waned. So it’ll be an interesting week, and for commodities too. Some signs of life last week which energy breaking out on the growth story, and some volume in the gold and silver buys in their range-bound week, whilst sentiment levels against gold, silver and miners are again at extreme lows. The US dollar is once again looking weak. The commodities indices remain in those large technical triangle noses since 2011, so still watching and waiting.
Disclosure: short stock indices, long commodities.

Where to deploy my money? China Just reported export beating expectation. Export was a drag this year until now. Adding to stability. China is in stealth phase. My rating: ACCUMULATE.
US also reported record export last week. Something to think about …”global activity”. Yes. US is frothy but price must confirm and my finger resting on the sell.button for now..
For commodities, my solo bet is Oil bought last week.
The latest on gold from McClellan……
http://www.mcoscillator.com/learning_center/weekly_chart/?utm_source=McClellan+Chart+In+Focus+-&utm_campaign=2ce6907e81-CIF_Gold_COT_Data_Again_12_6_2013&utm_medium=email&utm_term=0_9e79f8200f-2ce6907e81-151432569
Thanks John.
Thanks both.
All models updated this morning.
Everyday short term appreciation is mostly driven by fashion – herd mentality. Whether its art, politics or stocks. Its all very superficial, as are the explanations for why events happen – just noise. The underlying fundamentals of solar energy or demographics may explain the longer trends but don’t help with timing. When big changes happen its largely due to inexplicable synchronicity – the same decision made by many people in different places at the same time. This event cannot be predicted – it simply happens when the time is right. Perhaps its group consciousness. Therefore the only thing to rely on is value. When something with intrinsic value is going cheap then buy. When it seems expensive sell. Well – that is the way I am going.
I heard it from somewhere before. ‘Those who made crystal ball prediction are bound to eat their own glass’. Marc Faber, Roubini, Byron Wein all made dismal return prediction for the year 2013, and it worked against their judgement.
The same exact “bubble” chart was applied by skeptics to Bitcoin back in 2011, and people all said back then that it wasn’t coming back…