In addition to counting sunspots, here are two alternative methods of measuring the solar peak:
1. The angle of the heliospheric current sheet drops back below 70 degrees after the solar peak; but it is worth bearing in mind that the measurements are smoothed (ie. not confirmed until six months later) and relate to the past three high SN/short duration peaks. So at present, the most I would read into this data is that there is no evidence that the SC24 peak is over. http://wso.stanford.edu/gifs/Tilts.gif
2. The neutron monitor drops noticably below “-8” between 6 to 18 months before the solar peak – see the Cosmic rays variations (%) graph here: http://cr0.izmiran.rssi.ru/mosc/main.htm
When set to “monthly”, the graph shows that this count has not yet dropped below the “-8” line indicating that SC24 peak should still be more than 6 months away. When the graph is set to “daily”, it shows that there was a temporary dip below -8 during May 2013 – corresponding closely to the SSN peak so far.
Hi John
The high platou in sunspots at solar maximum is normally around 2 years long, and it started late 2011.
My long term planetary cycles suggested solar maximum around Sept-Oct 2013, based on a 2-3 month moving average (not the 13 month smoothed).
The shorter term tidal cycle has a strong tide in January 2014, so the 2-year platou could still stretch into the winter.
However I have a strong suspicion (backed by data) that the platou has ended just about here and now, and wont go much higher in the winter.
And that leaves winter 2012 as the solar maximum based on the 13 month smoothed average.
Looking at DOW versus the 2 year high platou in sunspots, shows a spread variation:
-DOW can make the solar maximum bullmarked top at the start of the platou, in the middle, or at the end (and a few times outside before/after the platou)
So for DOW now… I expect the solar maximum bullmarket high here and now, at the end of the platou. May stretch a bit into 2014
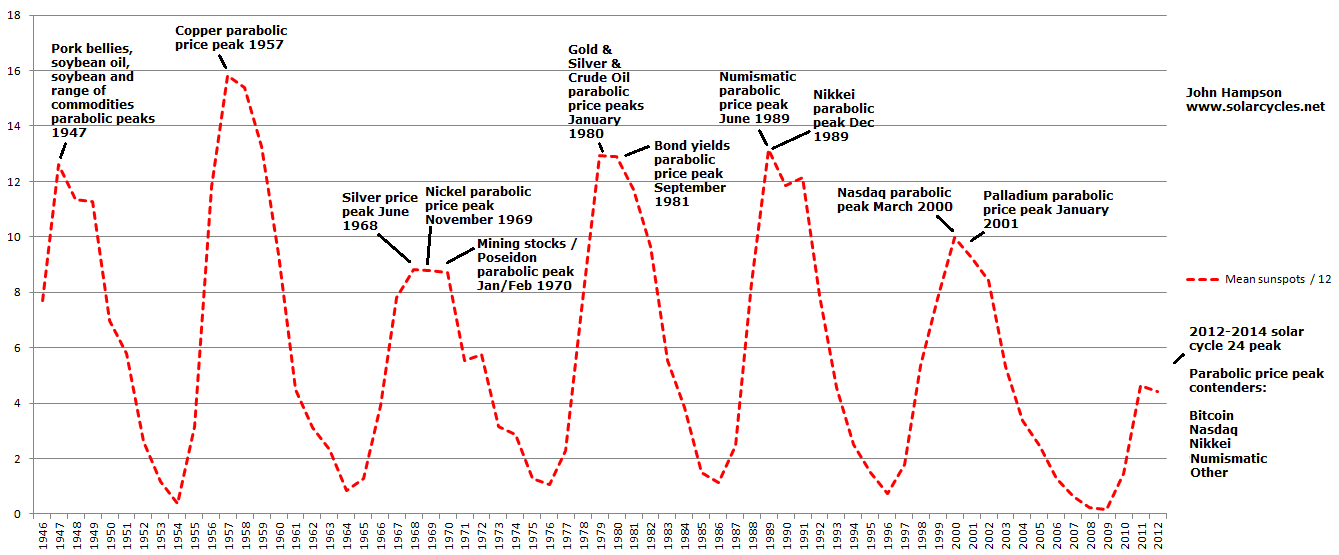
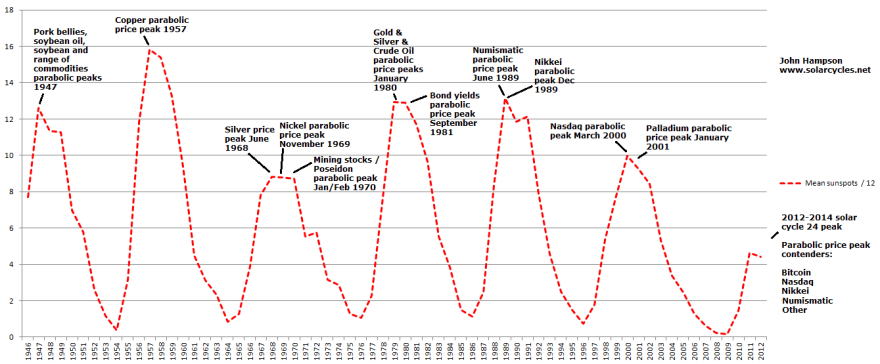
It is. I found it interesting that a money-metal has gone parabolic each solar peak. Is it Bitcoin this time (a kind of virtual money metal) or is one of the more regular metals going to step up as a late cyclical?
Devil’s advocate / more scientific purview: a separate chart (and one combining the two ) of parabolics of peaks not on solar cycle and troughs of all peaks? Not sure if you have this data also. Thanks for sharing.
Fair query wxguru, would be a good chart to make when I have the time. There has been a concentration of parabolics in the last decade, clearly outside of solar peaks. As per Richard Koo, in a balance sheet recession the private sector doesn’t fund the economy but does fund asset markets, hence the multiple bubbles and disconnect from the economy.
John, the second largest economy is having its Sub-PE10 moment…I want to refer to your master piece..the “pentagon” analysis. Sufficient wash-out? may be or may be not. Notwithstanding the demographic pressure, I am buying the CSI 300 index (American ETF “ASHR”) which captures 86% of all profits of the China “A” shares. The PE stands at 9.8X. I can sit and wait.
Thanks Newt. I have a different perspective on p/es since the demographic analysis, i.e. they have to been relative to demographics. I see China’s demographic headwinds now as too significant. That said, from a technical perspective it looks ripe for a breakout so could be profitable nearer term.
I wait to see if productivity can compensate (some of) the demographic drag. China may engineer a lower GDP rate of 7% for 2014, seeking stability and focusing on the quality of growth.
China is talking a good talk. Let see if it can walk its talk.
Chinese have been disgusted with the market. New “A” share brokerage accounts opened during the second week in November only one-tenth of the peak 5 years ago while funded accounts continue to disappear. This is a classic contrarian buy signal for those who have the patience to sit tight.
Bulkowski: 12/02/2013 The market is struggling to find direction. Alan Battista found a rising wedge in the S&P 500 index from mid September. That could break out in any direction, but it looks as if it’s going to be down. That would not be good news.
John referring past article about Japan, US, Europe heading deflation, some points: The stocks and Real Estate bubble in 3 cases made 3 different ´solutions´¨:
1. In 1990,Japan delayed QE policy and markets plunged over and over.
2. US, after 1st deflation, appilied agressively QE policy but is heading to a deflation- Bonds are rising and economy is slowing down.
3. Europe was reluctant to stimulus, but is running to deflation equally.
The difference stimulus/ not stimulus is the strcture US indices are forming, if you compare IBEX35-Spain is very similar to 1990-96 NIKKEI225 and in the same way Eurostoxx, Cac40, etc.
FED wanted to avoid deflation and the result is a parabolic forming structures on markets but same destination.
No inflation, no growth.
Economy will be again in trouble, no matter the policy was implimented.
All, I am busy short term trading as we approach calendar year end, trying to offset the precious metal drags on the account. So for now it’s going to take priority over postings here. Largely momentum trading with stops.
Tracking 3D printing and Big Data craze… wondering how the energy for a delayed solar max might be reflected more in the underlying stories… Innovation and world population growth (cumulatively up to this point in history) and it’s carry over effect. See http://research.chicagobooth.edu/cpe… thinking how these forces can buoy the economy and markets verse total implosion and collapse… John’s ‘pentagon tip’ dip (referenced above by Newt) before advancing in this new secular bull.
Thanks HVA. The solar maxes of the past have been correlated with growthflation. IF the solar max is H1 2014 it’s not impossible that the current better growth data spurs commodities and delivers the inflation. But all theoretical.
That’s the ‘danger’: increasing parabolic meltup. But to me that would set up an even greater short – considering volumes, margin debt, extreme bullish sentiment, overvaluation etc.
Chinese cancels its plan to send a man to the moon and redeploy the resources on the Reform instead. Exercising FISCAL Constraint. Smart move. It is just an example why it deserves a bid in the Newt book for the (new bull trend) long term.
After 10 years of trading and study I have realised that predicting is easy – whatever happens among all the possibilities, is the one the genius’s say they thought would happen – but always looking back.
The latest Fed Report on Consumer Revolving Credit for October 2013 is a parabolic blowout juicier than the Michigan Confidence Report of 82.5 (rising trend at a similar level as 1983 and 1993 and you know what happened after the time-frames).
In mid October I made an experiment. I picked quite randomly about 40 stocks that looked to me as if in an uptrend (making higher time frame higher lows) and about 30 stocks that looked like going down, including many gold miners. The ‘up’ portfolio is up by 12% ( the biggest risers GOOG 22%, GTN 53%, DNO.OL 42%, the biggest loser : ORAN -9%. The ‘down’ portfolio is today down by 4%, the biggest fallers : BBRY -27%, SA -24%, OXF -22%, the biggest losers in this portfolio : HPQ 21% up. It took me less than 30 minutes to assembly the portfolios. To assess the market, I needed only one look at the chart, no indicators, no fundamentals, no Fibos, no levels, only face value high and low. That stupid strategy beat the market, beat my results, and beat my intelligence, this is why I would never trade like this…:)
 Click to view larger.

In addition to counting sunspots, here are two alternative methods of measuring the solar peak:
1. The angle of the heliospheric current sheet drops back below 70 degrees after the solar peak; but it is worth bearing in mind that the measurements are smoothed (ie. not confirmed until six months later) and relate to the past three high SN/short duration peaks. So at present, the most I would read into this data is that there is no evidence that the SC24 peak is over. http://wso.stanford.edu/gifs/Tilts.gif
2. The neutron monitor drops noticably below “-8” between 6 to 18 months before the solar peak – see the Cosmic rays variations (%) graph here: http://cr0.izmiran.rssi.ru/mosc/main.htm
When set to “monthly”, the graph shows that this count has not yet dropped below the “-8” line indicating that SC24 peak should still be more than 6 months away. When the graph is set to “daily”, it shows that there was a temporary dip below -8 during May 2013 – corresponding closely to the SSN peak so far.
Mark
Thanks Mark
Thanks MarkA
Hi John
The high platou in sunspots at solar maximum is normally around 2 years long, and it started late 2011.
My long term planetary cycles suggested solar maximum around Sept-Oct 2013, based on a 2-3 month moving average (not the 13 month smoothed).
The shorter term tidal cycle has a strong tide in January 2014, so the 2-year platou could still stretch into the winter.
However I have a strong suspicion (backed by data) that the platou has ended just about here and now, and wont go much higher in the winter.
And that leaves winter 2012 as the solar maximum based on the 13 month smoothed average.
Looking at DOW versus the 2 year high platou in sunspots, shows a spread variation:
-DOW can make the solar maximum bullmarked top at the start of the platou, in the middle, or at the end (and a few times outside before/after the platou)
So for DOW now… I expect the solar maximum bullmarket high here and now, at the end of the platou. May stretch a bit into 2014
JAn 🙂
Thanks Jan
Domino’s pizza is going parabolic. So are US small cap stocks. Check out VB.
Thanks. I’m wondering whether Apple is shaping to go parabolic again – or whether it is going to make a lower peak in the typical bubble anatomy.
Is the chart showing parabolics concurrent with sunspot maxima?
It is. I found it interesting that a money-metal has gone parabolic each solar peak. Is it Bitcoin this time (a kind of virtual money metal) or is one of the more regular metals going to step up as a late cyclical?
Thanks, and that Bitcoin is interesting.
It is certainly reflective of our time in that we do not view money as requiring a physical form.
Devil’s advocate / more scientific purview: a separate chart (and one combining the two ) of parabolics of peaks not on solar cycle and troughs of all peaks? Not sure if you have this data also. Thanks for sharing.
Fair query wxguru, would be a good chart to make when I have the time. There has been a concentration of parabolics in the last decade, clearly outside of solar peaks. As per Richard Koo, in a balance sheet recession the private sector doesn’t fund the economy but does fund asset markets, hence the multiple bubbles and disconnect from the economy.
John, the second largest economy is having its Sub-PE10 moment…I want to refer to your master piece..the “pentagon” analysis. Sufficient wash-out? may be or may be not. Notwithstanding the demographic pressure, I am buying the CSI 300 index (American ETF “ASHR”) which captures 86% of all profits of the China “A” shares. The PE stands at 9.8X. I can sit and wait.
Thanks Newt. I have a different perspective on p/es since the demographic analysis, i.e. they have to been relative to demographics. I see China’s demographic headwinds now as too significant. That said, from a technical perspective it looks ripe for a breakout so could be profitable nearer term.
I wait to see if productivity can compensate (some of) the demographic drag. China may engineer a lower GDP rate of 7% for 2014, seeking stability and focusing on the quality of growth.
China is talking a good talk. Let see if it can walk its talk.
Chinese have been disgusted with the market. New “A” share brokerage accounts opened during the second week in November only one-tenth of the peak 5 years ago while funded accounts continue to disappear. This is a classic contrarian buy signal for those who have the patience to sit tight.
Bulkowski: 12/02/2013 The market is struggling to find direction. Alan Battista found a rising wedge in the S&P 500 index from mid September. That could break out in any direction, but it looks as if it’s going to be down. That would not be good news.
Thanks Robert
My personal feeling is that we might go supernova first but I am always clueless.
John referring past article about Japan, US, Europe heading deflation, some points: The stocks and Real Estate bubble in 3 cases made 3 different ´solutions´¨:
1. In 1990,Japan delayed QE policy and markets plunged over and over.
2. US, after 1st deflation, appilied agressively QE policy but is heading to a deflation- Bonds are rising and economy is slowing down.
3. Europe was reluctant to stimulus, but is running to deflation equally.
The difference stimulus/ not stimulus is the strcture US indices are forming, if you compare IBEX35-Spain is very similar to 1990-96 NIKKEI225 and in the same way Eurostoxx, Cac40, etc.
FED wanted to avoid deflation and the result is a parabolic forming structures on markets but same destination.
No inflation, no growth.
Economy will be again in trouble, no matter the policy was implimented.
@apanalis
Thanks Antonio, I largely agree.
And a likely plunge is around the corner, once again.
@apanalis
All, I am busy short term trading as we approach calendar year end, trying to offset the precious metal drags on the account. So for now it’s going to take priority over postings here. Largely momentum trading with stops.
Sounds good!
Go for charts that are not messy and go up. New highs breaking out. Keep it simple. Less stress
Great work… great comments…
Tracking 3D printing and Big Data craze… wondering how the energy for a delayed solar max might be reflected more in the underlying stories… Innovation and world population growth (cumulatively up to this point in history) and it’s carry over effect. See http://research.chicagobooth.edu/cpe… thinking how these forces can buoy the economy and markets verse total implosion and collapse… John’s ‘pentagon tip’ dip (referenced above by Newt) before advancing in this new secular bull.
Good luck trading John.
HVA
Thanks HVA. The solar maxes of the past have been correlated with growthflation. IF the solar max is H1 2014 it’s not impossible that the current better growth data spurs commodities and delivers the inflation. But all theoretical.
Good trading, John
@apanalis
Last thing, John, this NASA chart doesn´t fit with yours>
http://www.distressedvolatility.com/2013/12/technical-alert-on-sunspot-cycle.html
@apanalis
I deliberately noted a range of 2012-2014 in the above pic to include the range of forecasts that I keep track of – your one being Nasa’s.
2000: Environment… Many short sellers go bankrupt before proven correct =)
That’s the ‘danger’: increasing parabolic meltup. But to me that would set up an even greater short – considering volumes, margin debt, extreme bullish sentiment, overvaluation etc.
Do not try to force something that is not there =)
We will soon see if EEM is the convergence trade for 2014. Get ready to take advantage if and when it is there.
combined 4/6 month cycle projection suggest a low around/just before Xmas

Thanks Jan
Chinese cancels its plan to send a man to the moon and redeploy the resources on the Reform instead. Exercising FISCAL Constraint. Smart move. It is just an example why it deserves a bid in the Newt book for the (new bull trend) long term.
After 10 years of trading and study I have realised that predicting is easy – whatever happens among all the possibilities, is the one the genius’s say they thought would happen – but always looking back.
http://www.zerohedge.com/news/2013-12-06/hugh-hendry-throws-bearish-towel-his-full-must-read-letter
I am a huge fan of Hugh Hendry, and think you might like to read his December letter to clients – yes, Robert, lots to smile about.
Thanks John.
The latest Fed Report on Consumer Revolving Credit for October 2013 is a parabolic blowout juicier than the Michigan Confidence Report of 82.5 (rising trend at a similar level as 1983 and 1993 and you know what happened after the time-frames).
Sitting tight on all my longs.
http://www.federalreserve.gov/releases/g19/Current/
In mid October I made an experiment. I picked quite randomly about 40 stocks that looked to me as if in an uptrend (making higher time frame higher lows) and about 30 stocks that looked like going down, including many gold miners. The ‘up’ portfolio is up by 12% ( the biggest risers GOOG 22%, GTN 53%, DNO.OL 42%, the biggest loser : ORAN -9%. The ‘down’ portfolio is today down by 4%, the biggest fallers : BBRY -27%, SA -24%, OXF -22%, the biggest losers in this portfolio : HPQ 21% up. It took me less than 30 minutes to assembly the portfolios. To assess the market, I needed only one look at the chart, no indicators, no fundamentals, no Fibos, no levels, only face value high and low. That stupid strategy beat the market, beat my results, and beat my intelligence, this is why I would never trade like this…:)
Thanks all