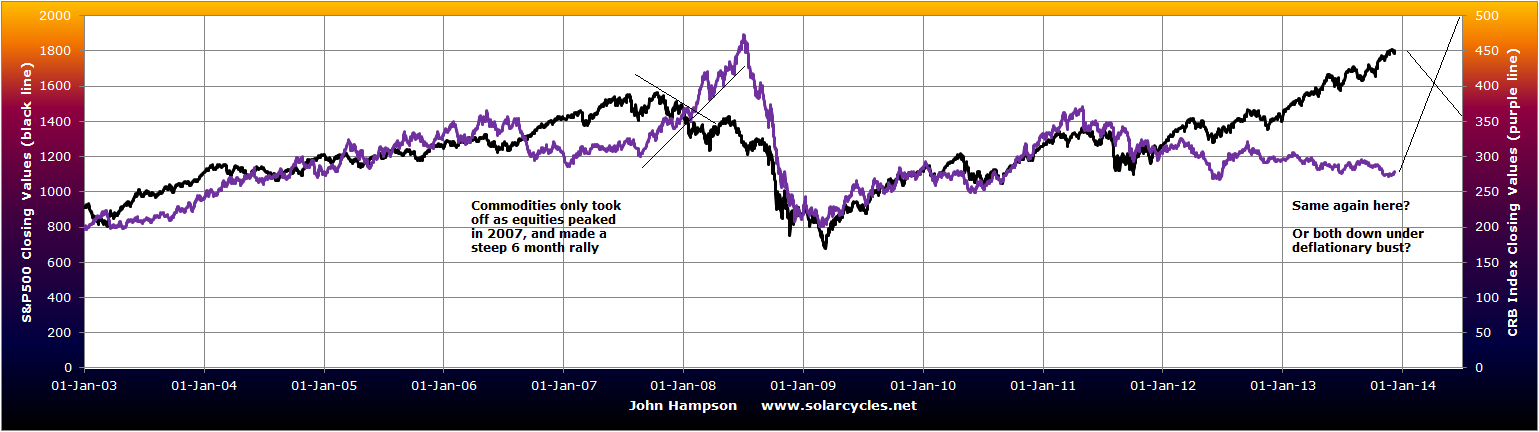
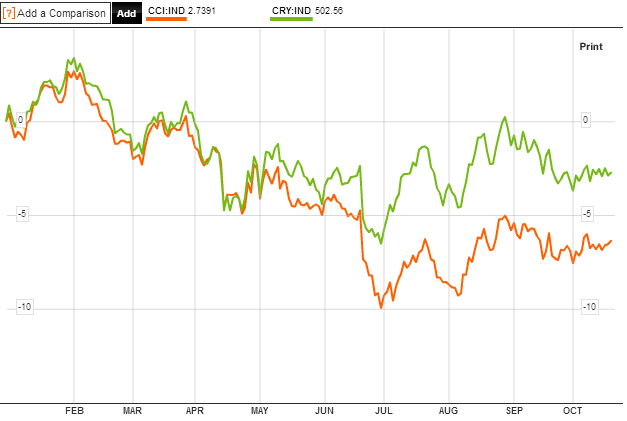
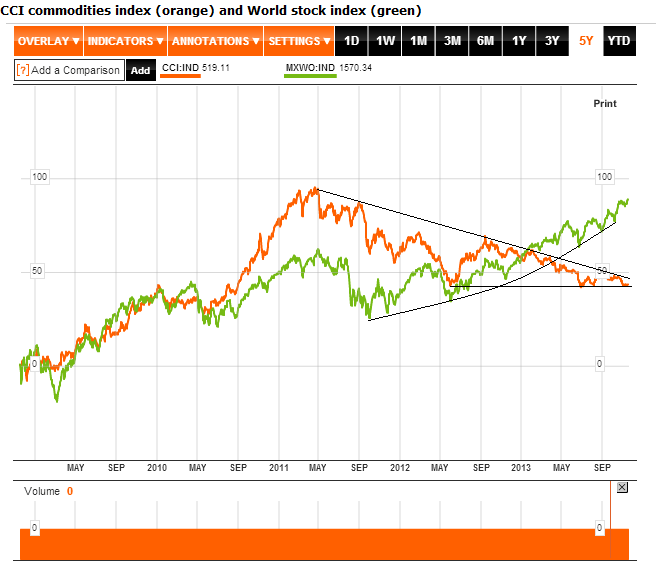
Starting with the equally-weighted commodities index versus the world equities index:
 Source: Bloomberg
Commodities remain depressed but still within a large triangle. Last chance though here as the triangle compresses and they test horizontal support again. Their underperformance, based on supply and demand, is consistent with the demographic trends now in place in most of the major nations.
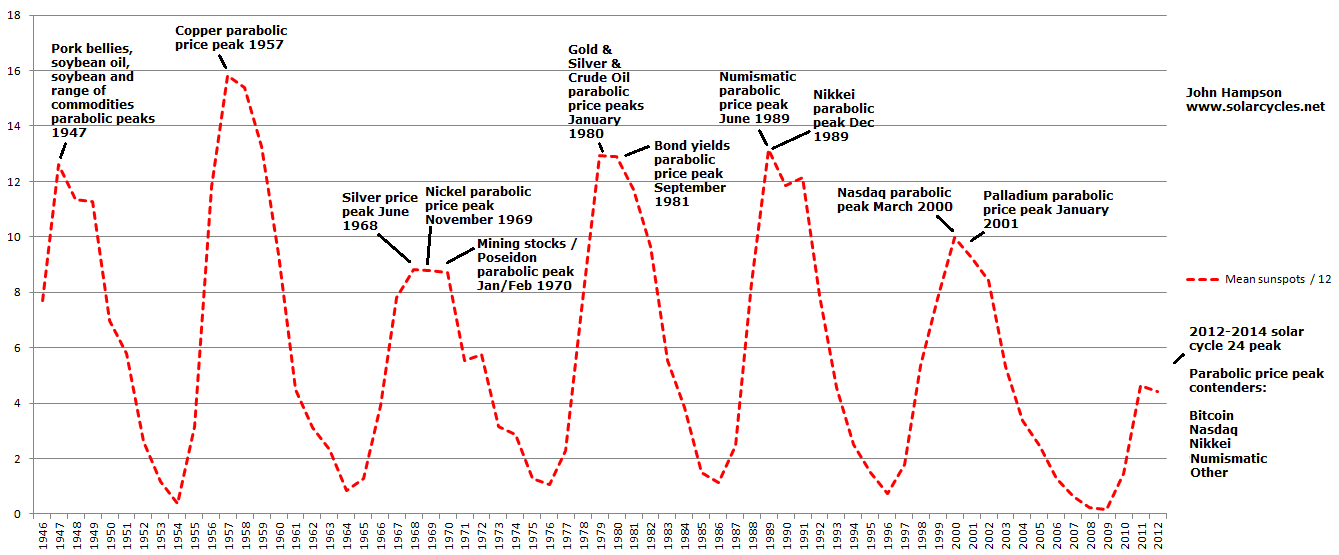
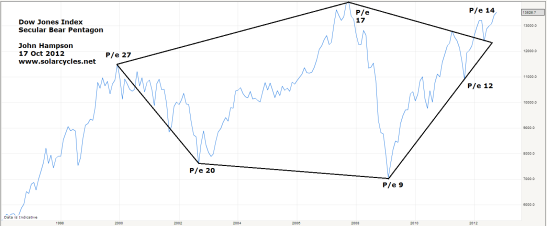
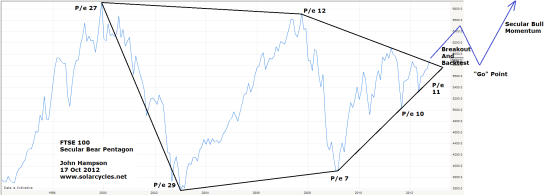
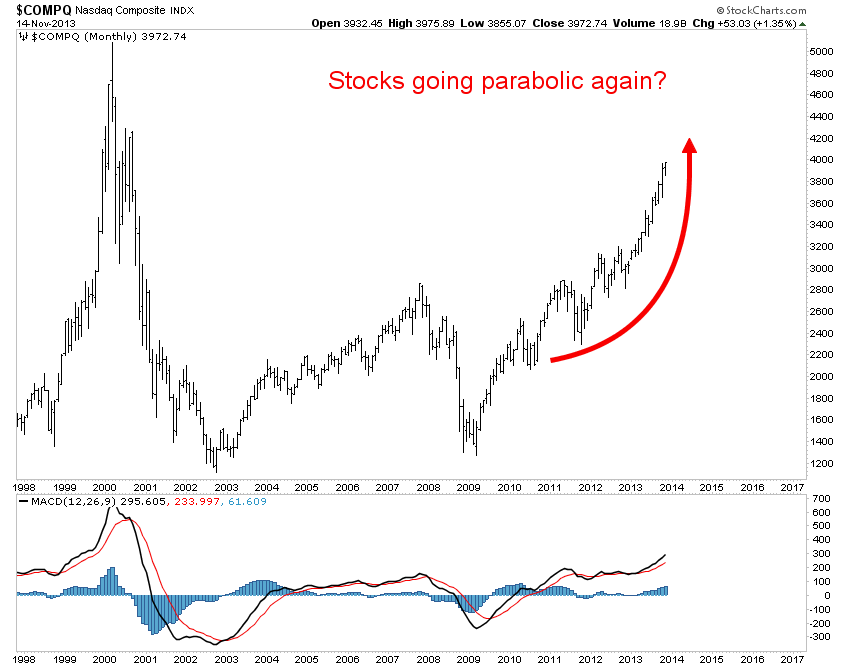
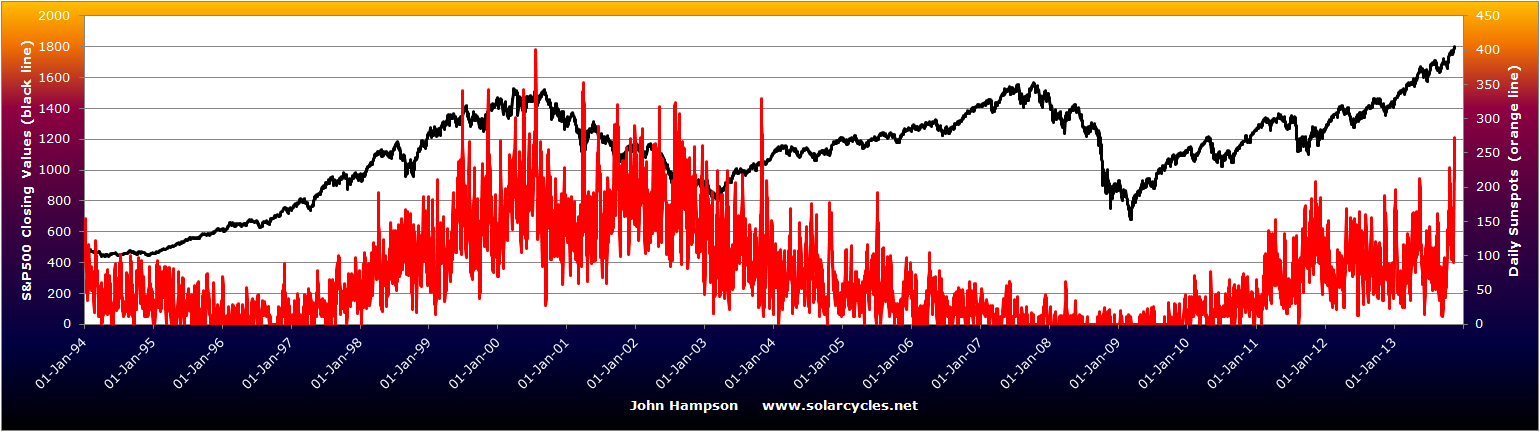
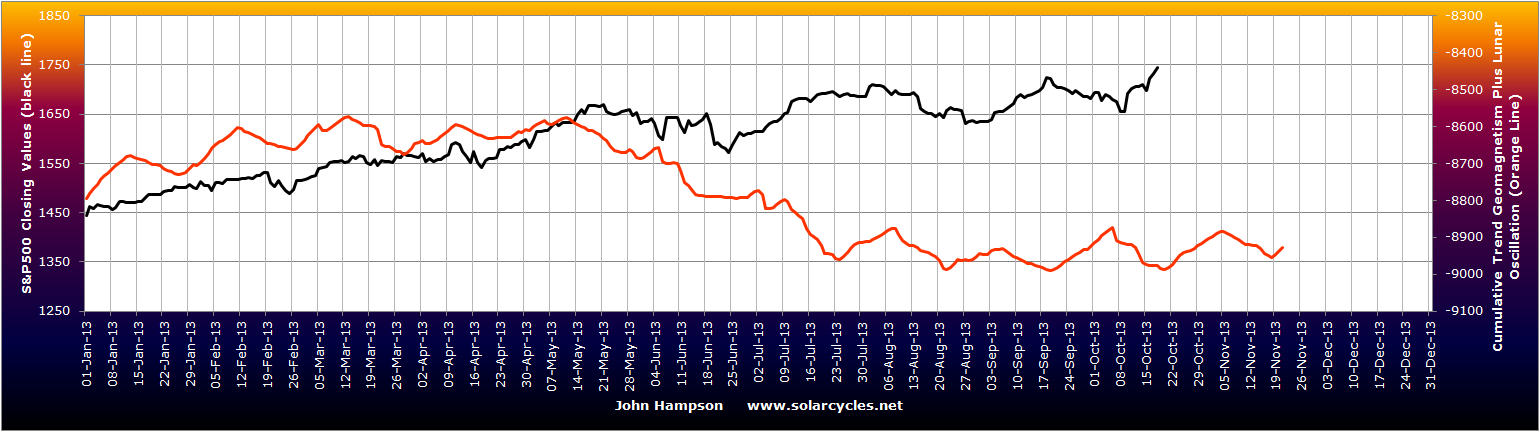
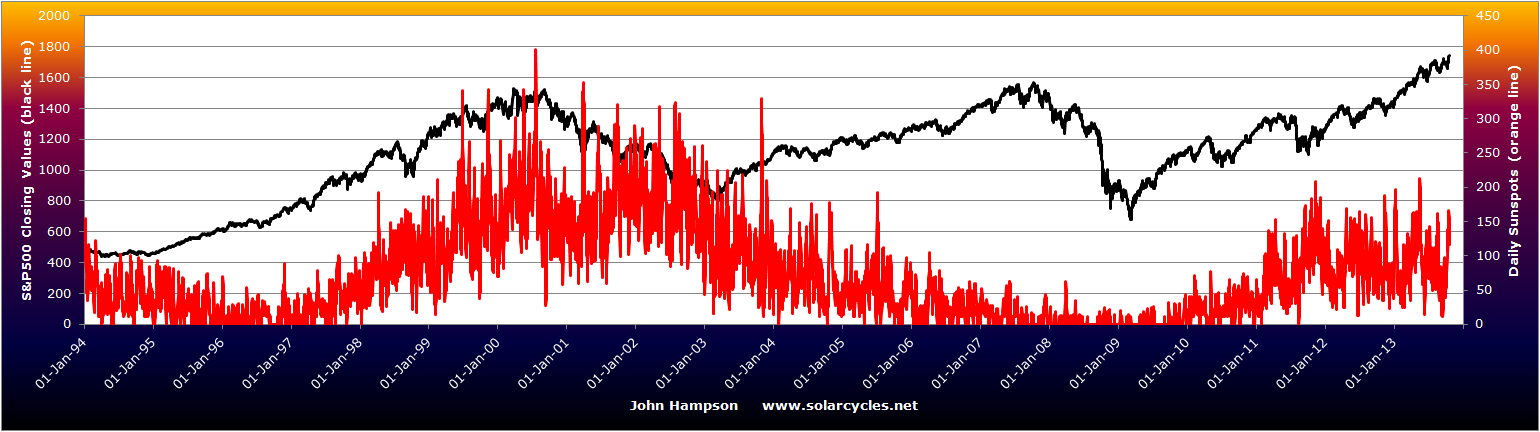
World equities broke out of their mid-year range, rendering the potential topping process redundant. That means equities need either to start over a multi-month topping process at some point ahead, or make a parabolic top instead. The increasing rate of gains, shown by the trend, suggests the latter could potentially occur (or be occurring), and this is supported by increasing evidence of a solar maximum taking place now:
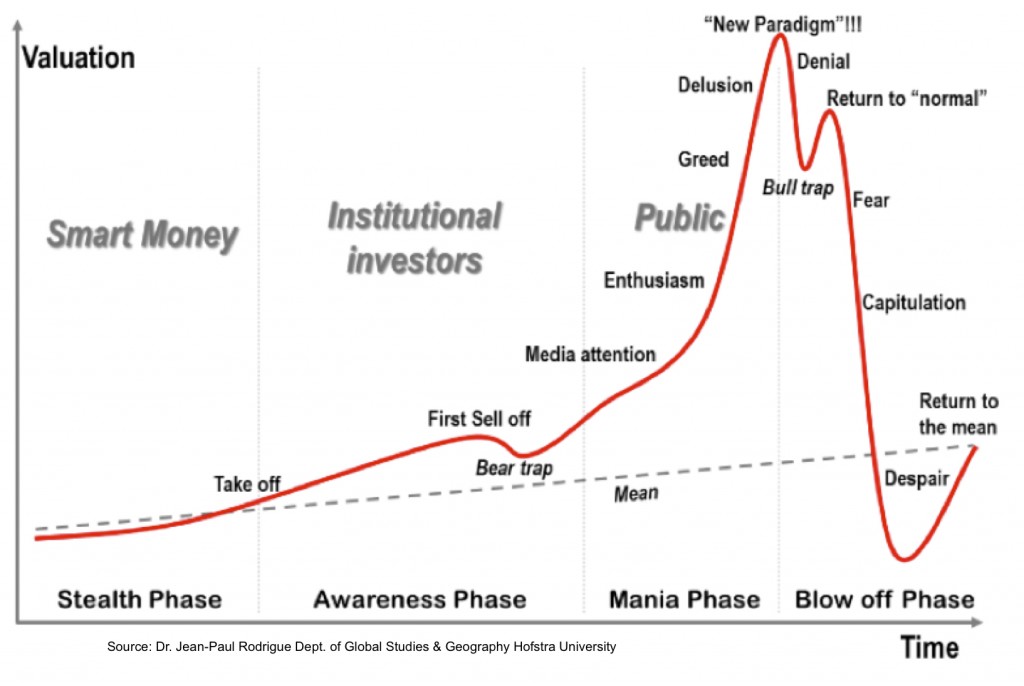
 Historic solar maximums have been correlated with speculative manias, such as Nasdaq 2000, Nikkei 1989, gold 1980 (last 3 solar maximums). I anticipated that commodities would be the speculative target for this solar max but there is reasonable evidence that such speculation froth is taking place in equities, as the next 5 charts show.
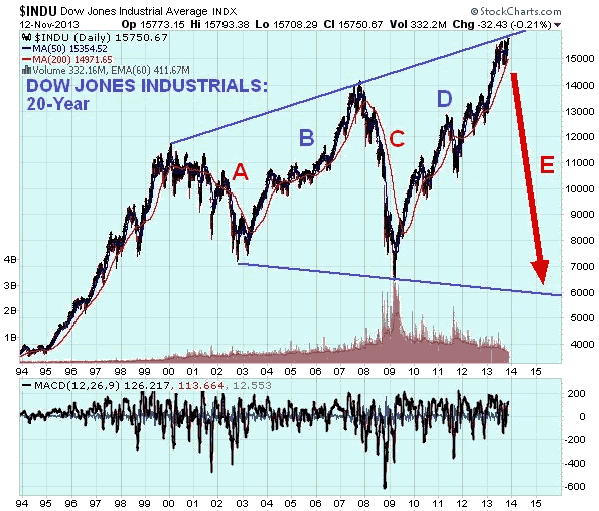
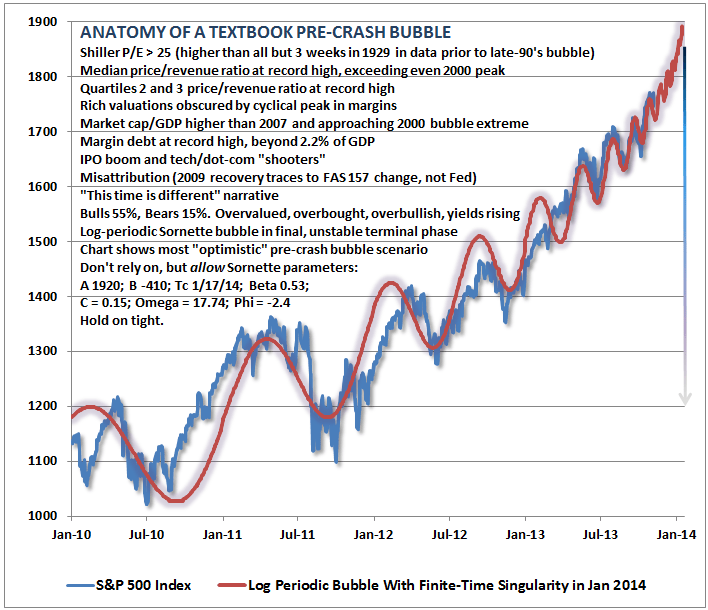
Firstly, Hussman’s long standing bearish call on the markets has to be taken with a pinch of salt, but the ‘bubble’ technical overlay shows what could be occurring:
 Source: Hussman
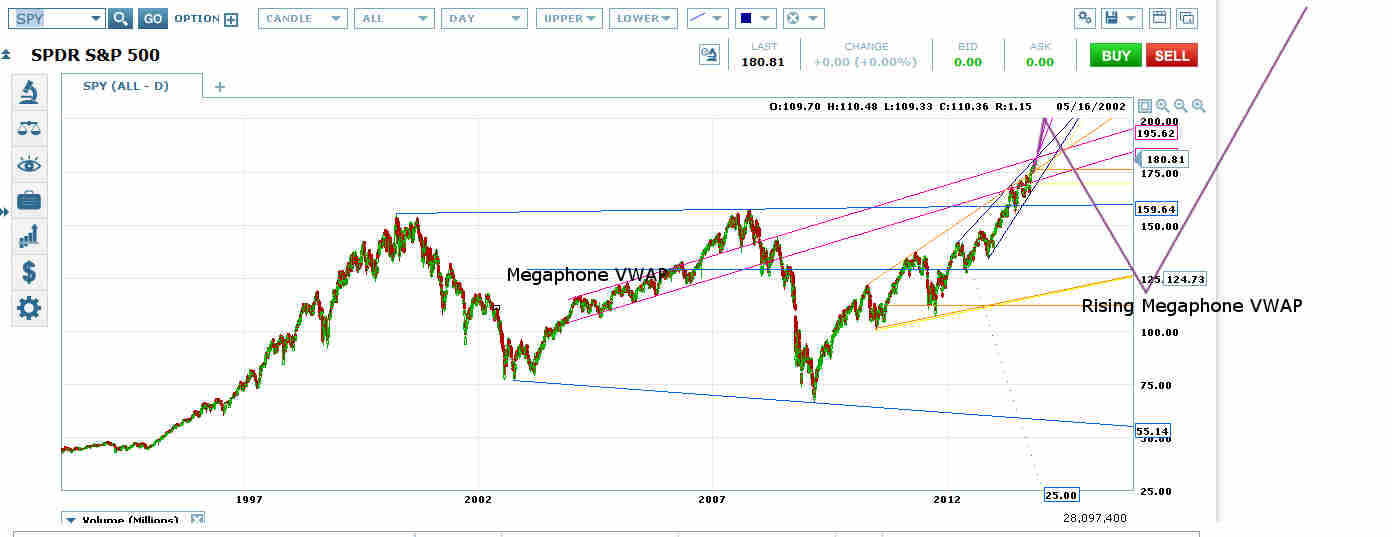
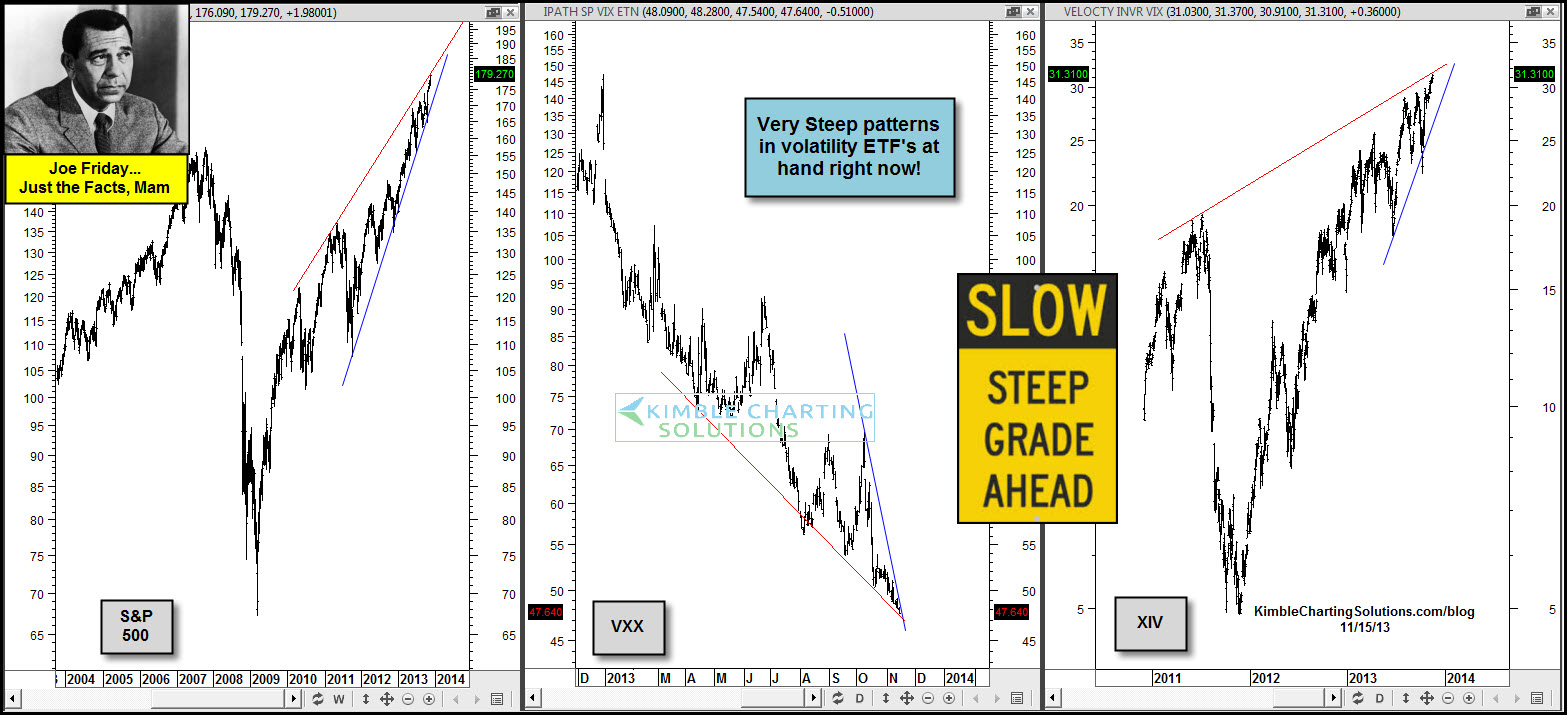
Secondly, the steep wedging of both the SP500 and volatility indices is also indicative, and suggests both could be heading for a pop:
 Source: Chris Kimble
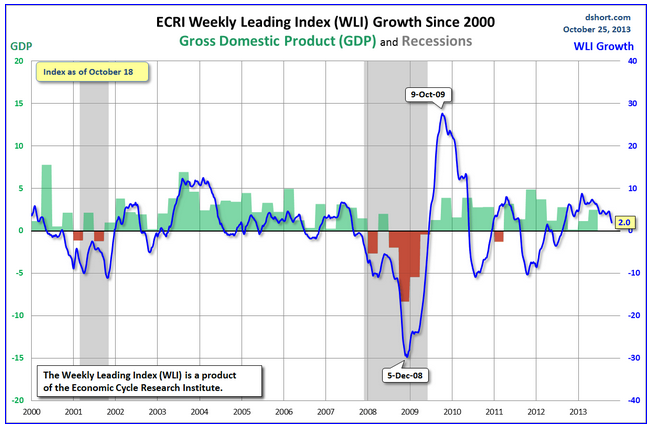
Third, the situation for free cash in margin accounts together with margin debt levels reveals a dangerous extension, which is also suggestive of excessive speculation:
 Source: Dshort
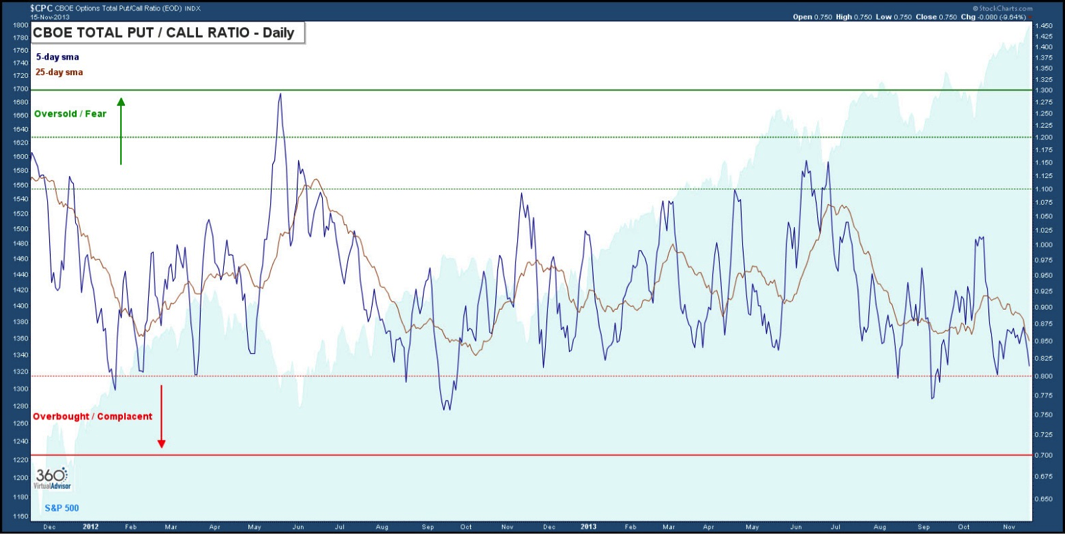
And fourth, a lack of hedging to go with that:
 Source: Sentimentrader
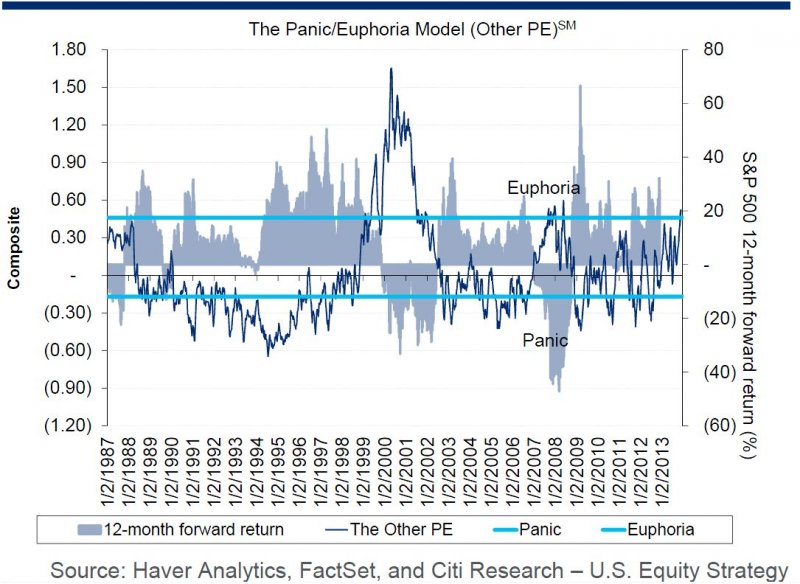
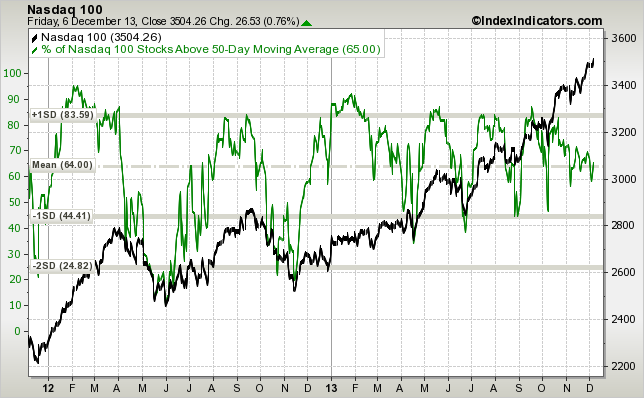
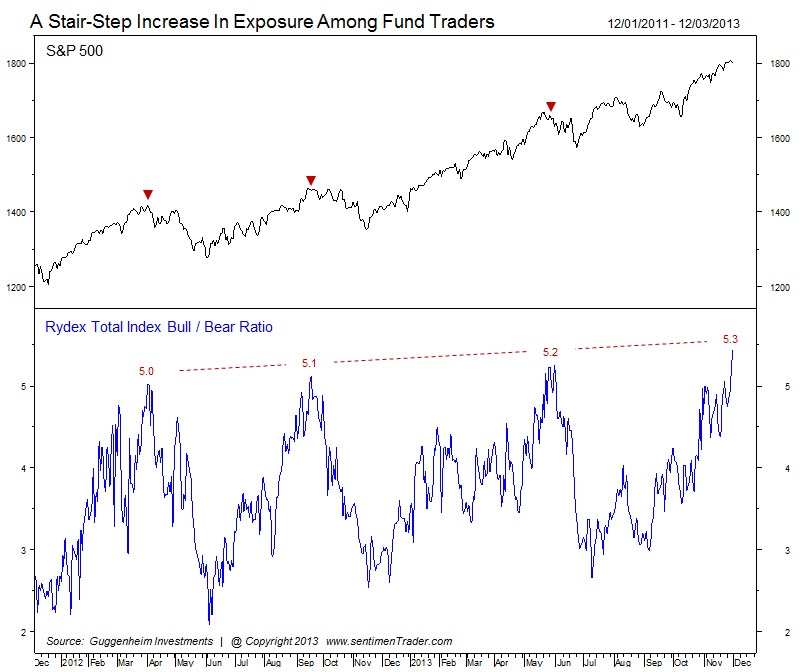
Finally, fifth, the rally is now much more weighted into the hands of traditionally ‘dumb’ money rather than ‘smart’ money participants:
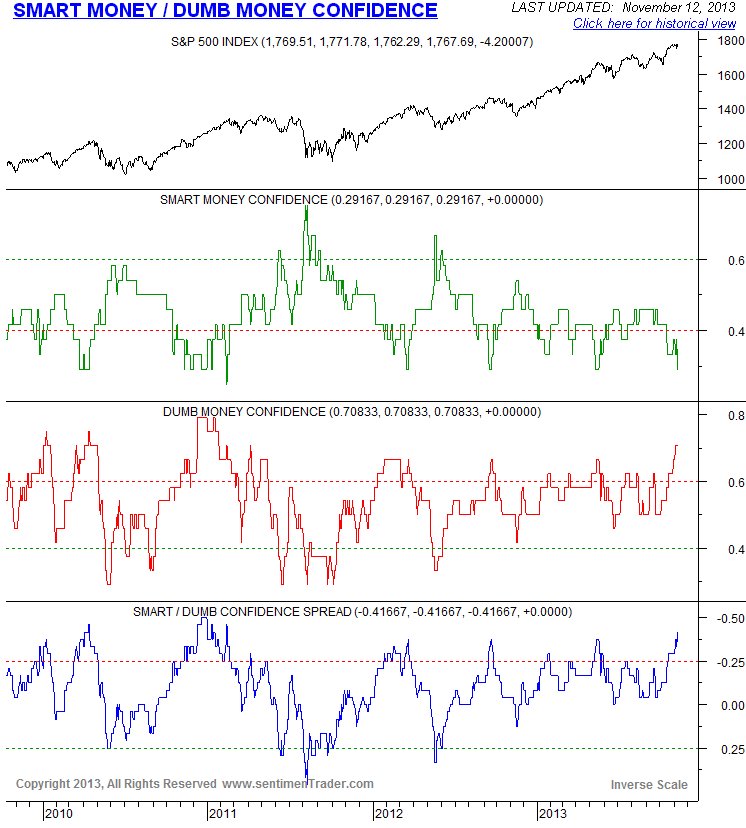 Source: Sentimentrader
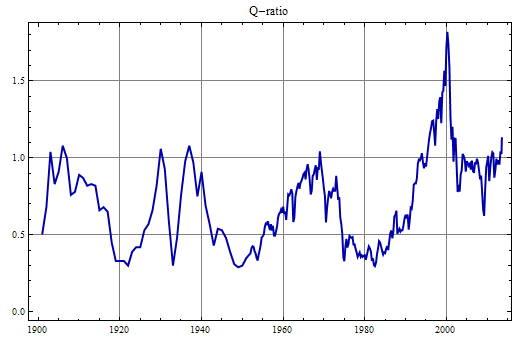
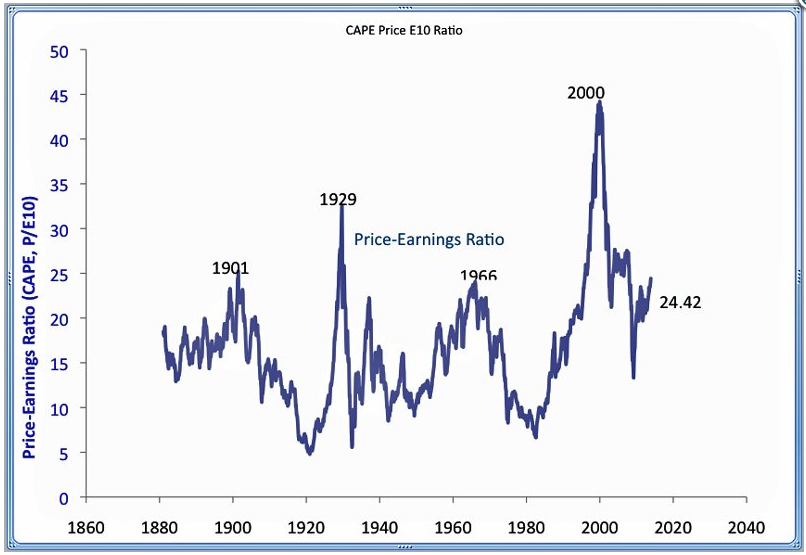
On the flip side, we do not see significant deterioration in breadth nor rotation into defensives that would ordinarily warn of a top in the markets. The next 2 weeks are the positive lunar fornight so there is a reasonable chance that equities continue to rally through that period, and indeed could feasibly carry that through the traditionally strong Xmas period into the beginning of 2014. I believe the technical breakouts and steepening trends in stock indices together with the solar-inspired excitement could potentially make for a parabolic finale here. It’s a tough one to call because of the extremes already reached in some of the indicators above. Complacency is high and it has been a long time since a 10% correction. Stocks are also overvalued, historically, as the Q-ratio and CAPE reveal:

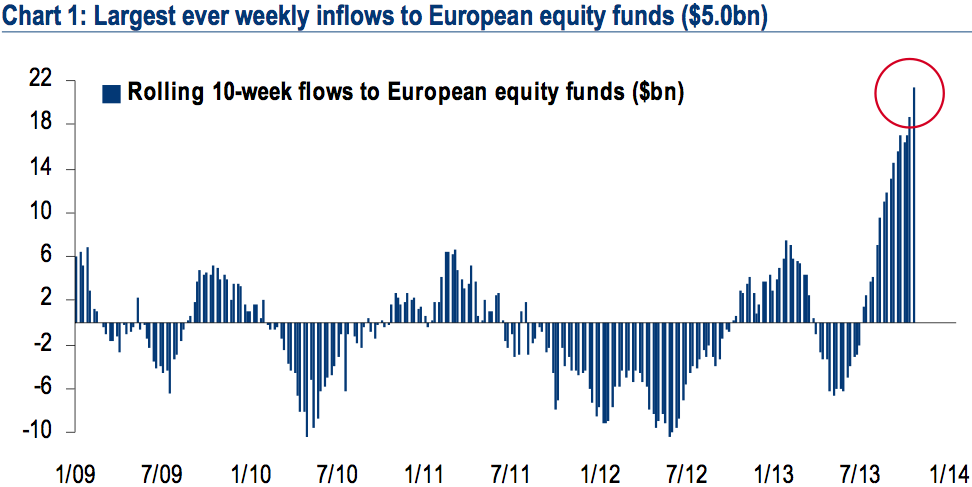
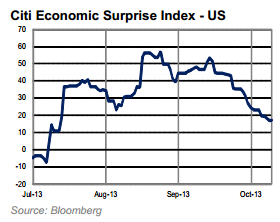
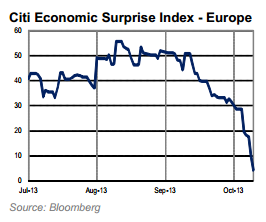
 The 2000 outlier shows how much further overvalued stocks could feasibly yet become, but that anomaly aside we can see that by both measures warning signs are flashing. What could tip the market over? Rising rates (bond yields are back on the rise), an inflationary shock, or a deflationary shock. Normally, stocks would tip into a cyclical bear under excessive inflation. Right now we see the opposite. Take a look at the rate if disinflation in Europe:
 Source: Yardeni
Add to this a crisis emerging again in emerging Europe, and I can see a case for the ECB taking to QE. If that were to occur, then maybe commodities can catch a bid again and make their speculative rally, under a brief but significant inflationary shock. Chris Carolan’s solunar model for crude oil paints the possibility that oil could come back here:

Source: Spiralcalendar
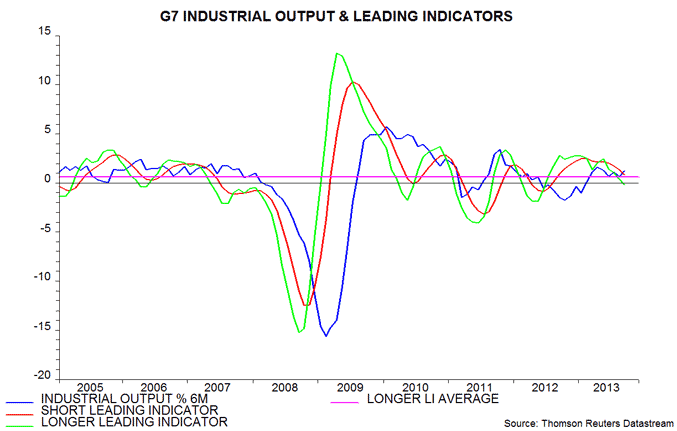
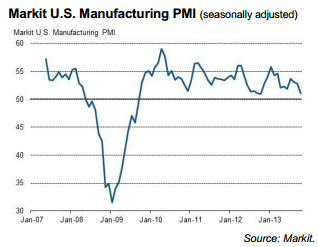
If the whole class cannot rise again, then precious metals alone could, under a deflationary shock, i.e. the world tips into a deflationary recession. This could occur with further commodity falls dragging global inflation rates yet lower. Emerging markets such as India and Brazil are in trouble again with low growth and high inflation, sinking currencies and debt problems. And leading indicators suggest global growth could be tipping over as of year end in the developed nations:
 Source: Moneymovesmarkets
Under deflation, equities would normally fall hard and fast, to the lower ranges for CAPE and Q ratio above. That would likely mean sub 2009 lows in nominal terms. But under inflation, equities normally more slowly wind down to those valuation levels, and in nominal terms the damage is less severe. Under deflation the US dollar should rally, whereas under inflation the US dollar should break down. The US dollar was on the cusp of a major breakdown several weeks ago but has since rallied away from oversold and overbearish conditions, leaving both possibilities on the table, and its performance from here should be a key signal.
Right now, the deflationary outcome looks the most likely, which would make a short on the stock indices a very tasty trade. However, before that there is the potential for stocks to climb further, and possibly at an increasing trajectory. That makes for difficult timing. With the positive lunar fortnight right ahead, and momentum still with equities, I am expecting stocks can rally further in that period, barring any external shocks. But with various high danger levels already reached for this stocks bull, I am looking to build short here, not chase long. Regarding commodities, I continue to watch and wait, still long the complex, but not adding. I believe precious metals will come again, due to the unprecedented demographic downtrends, but am less sure about the broader complex due to the demographic impacts on demand. But let’s see – the moment of truth draws nearer – see below – and I don’t want to try to front-run or second-guess it. A speculative and final rally in commodities remains a possibility whilst the complex continues to consolidate up high. Yet if they cannot rally, and break down below the major support, I believe the global tipping into deflation will accelerate and kill equities in due course.
 Source: Martin Pring

 Source: Solen