Time for a more in-depth post.
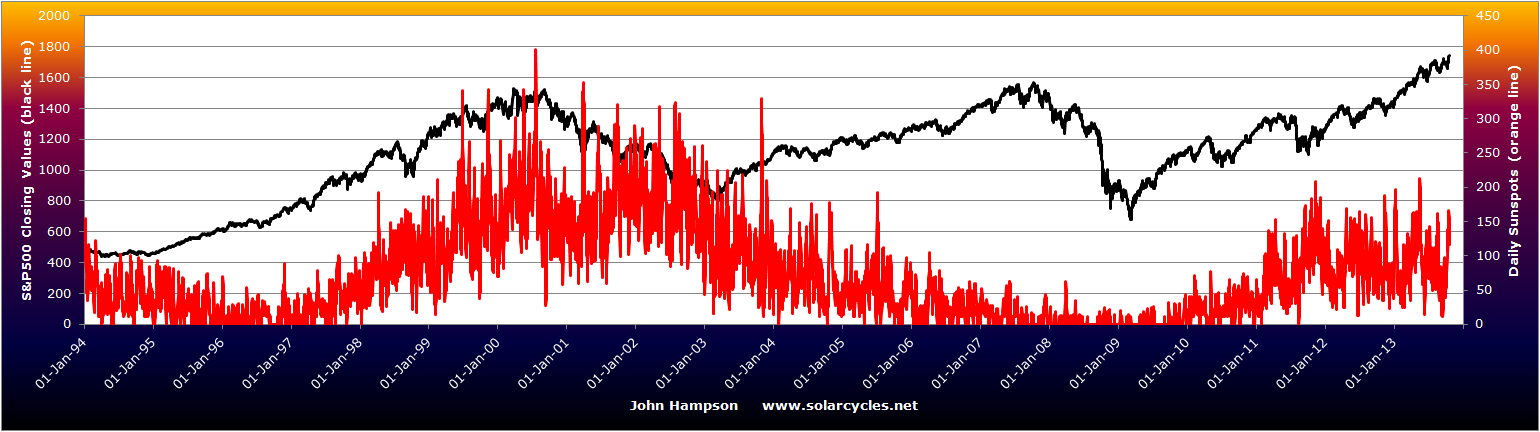
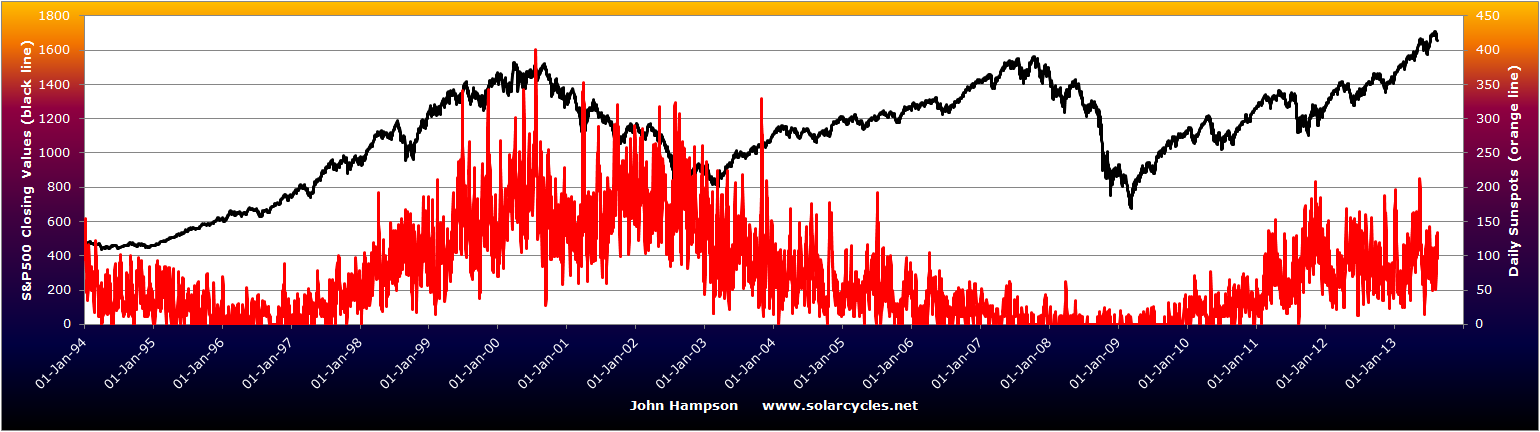
1. SOLAR CYCLES
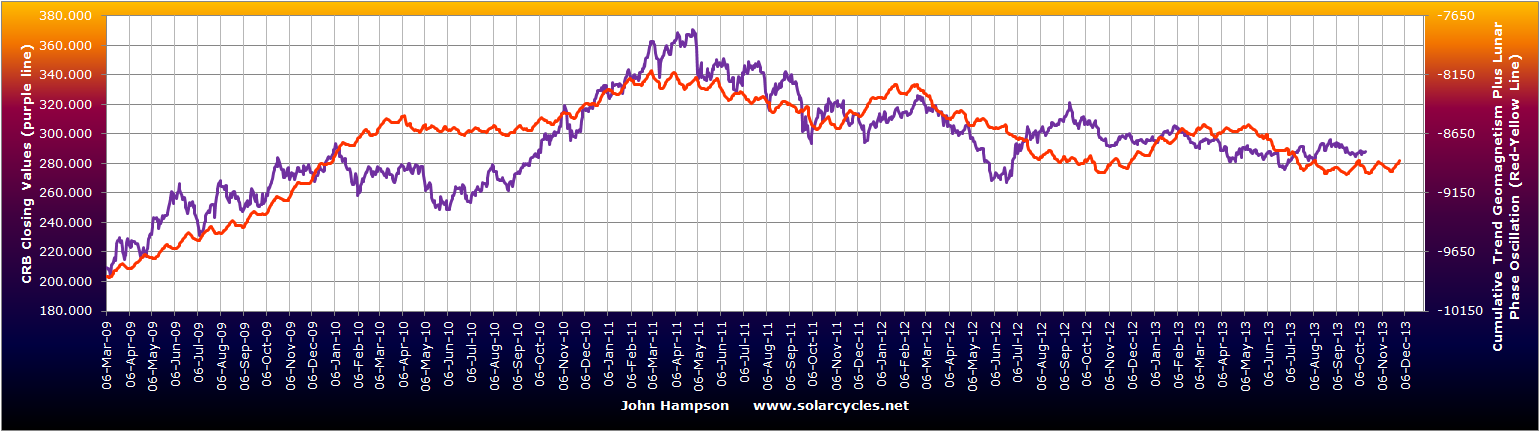
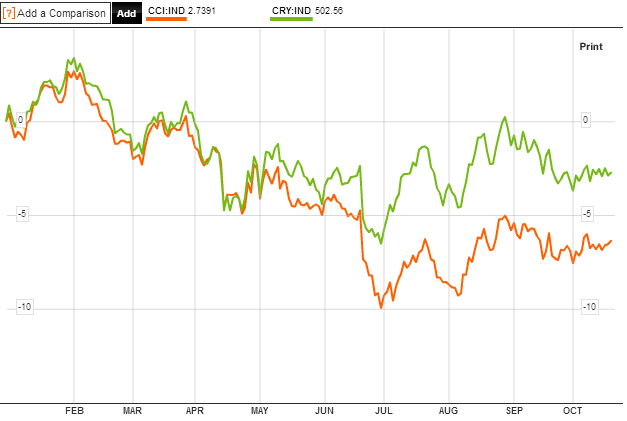
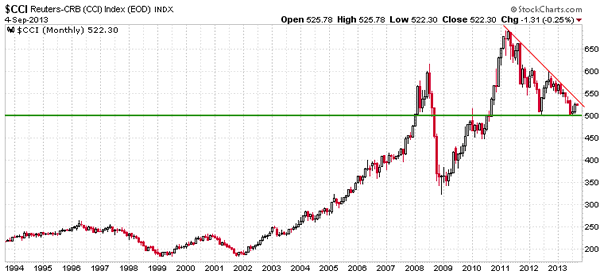
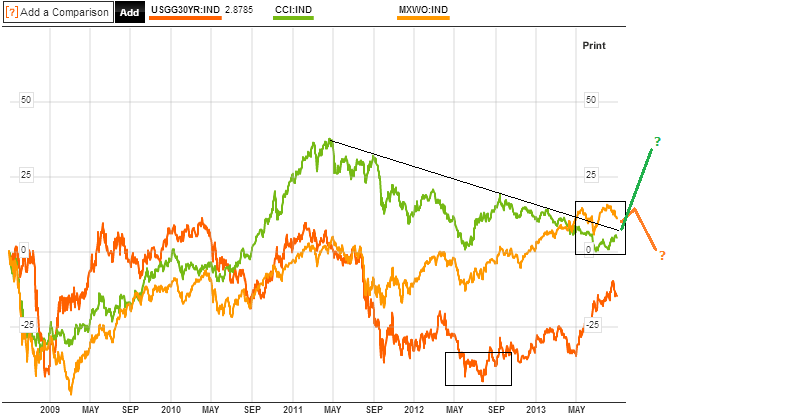
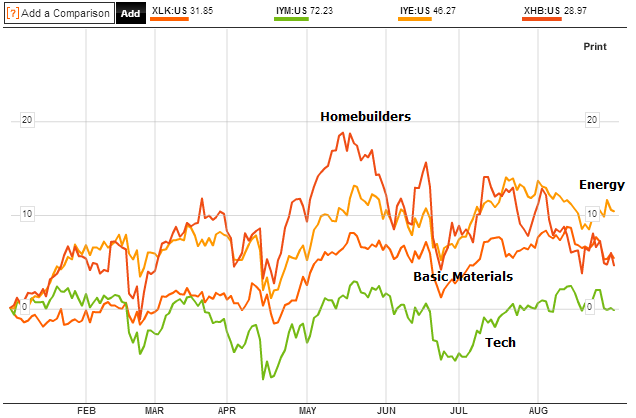
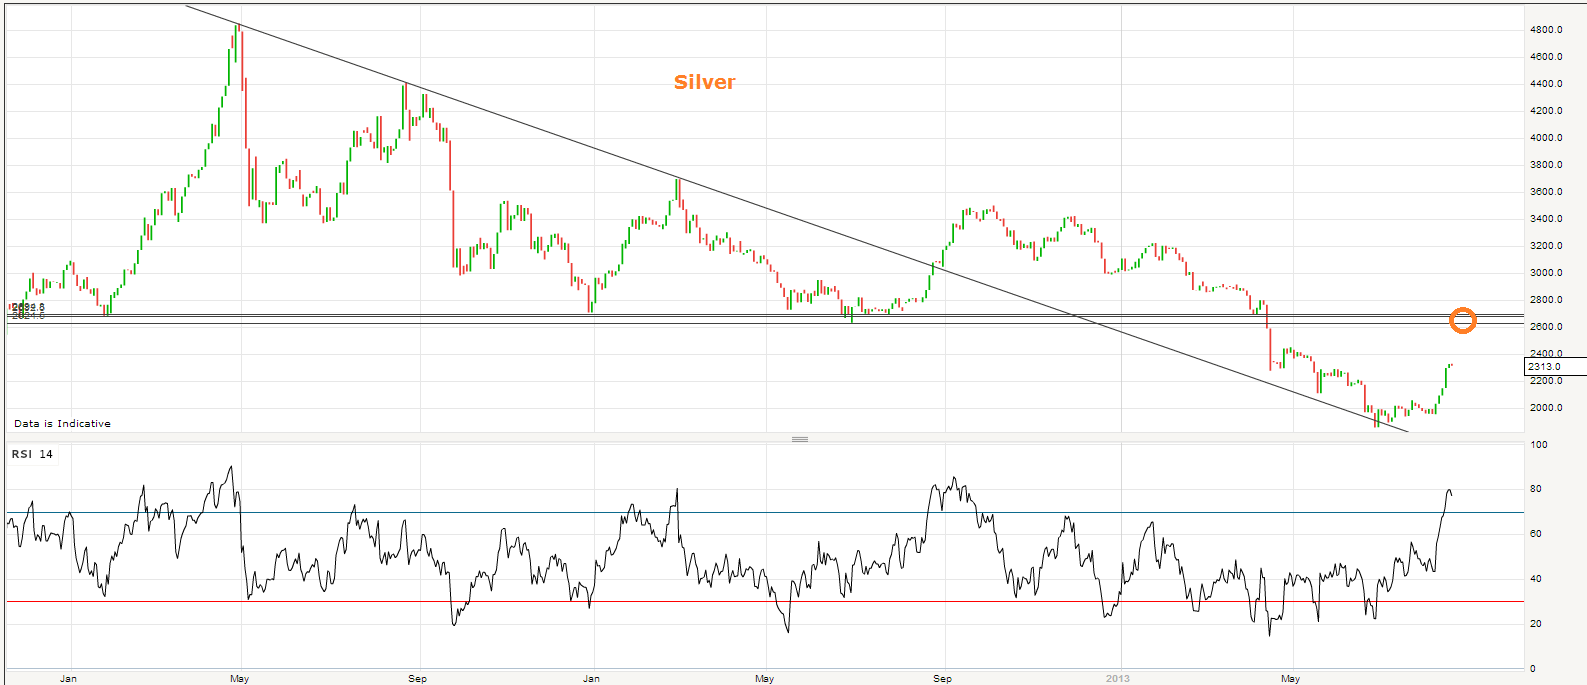
By my work the secular (more accurately demographic or anti-demographic) asset class should be bid to a peak in a solar-inspired speculation blow-off close to the solar maximum, which for this solar peak should be commodities to round off a decade long (plus) bull market. If the smoothed solar max has passed and was Feb 2012 and the CCI commodities index made its ultimate peak April/May 2011 then neither should now be exceeded. If this turns out to be the case in hindsight, once the solar max has been agreed, then the commodities peak would have occurred 9 months prior to the solar peak and would within normal parameters to continue to validate the theory.

Source: Gary Tanashian / Stockcharts
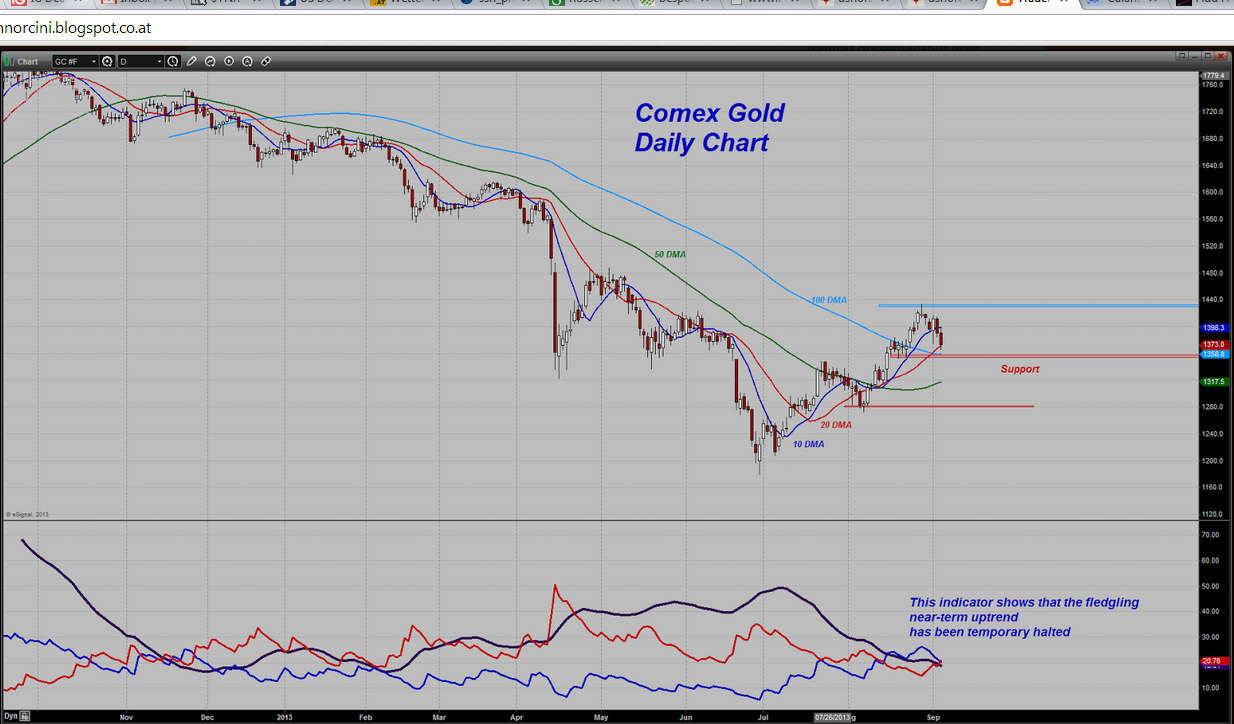
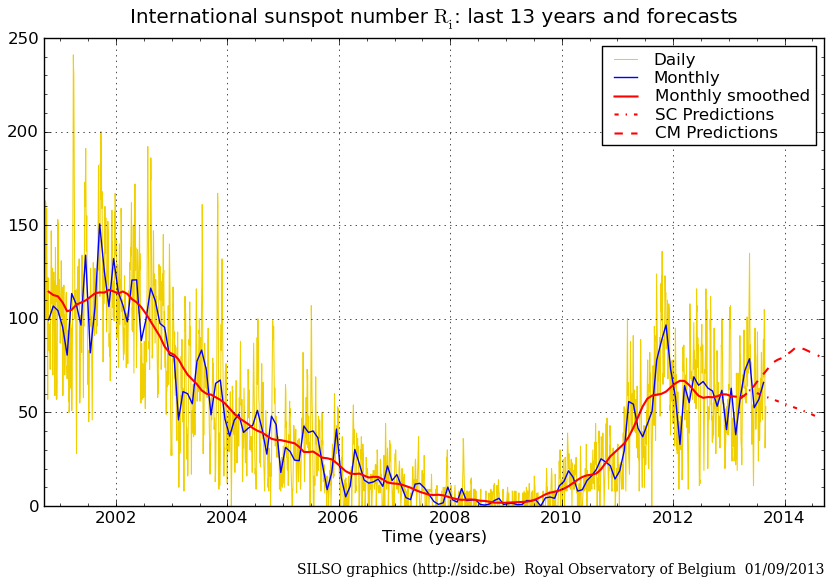
If, alternatively, the solar peak is ahead late 2013 into early 2014 (which is SIDC’s second option, and also Leif Svalgaard’s prediction – shown below), then that 2011 CCI peak is too far away and if the theory is correct we should get another commodities peak closer to the solar peak, which would mean a higher peak in the CCI ahead. We have the possible seed for this in a fledgling CCI uptrend following a base established in July/Aug 2013 together with their historic performance as late cyclicals in what is possibly a cyclical topping process in equities occurring. However, this CCI uptrend is currently tentative, devoid of momentum and without broad participation thus far. The dips in oil and precious metals at the end of this week cast further doubt for now, but their drops coincided with money flowing back into equities. If equities are in a topping process then money should flow back to commodities in due course as they go outperform as late cyclicals. I would suggest the higher peak in CCI to be possible as speculative money pours in, under these easy money conditions globally. ZIRP and QE may not be able to generate growth but they can generate bubbles.
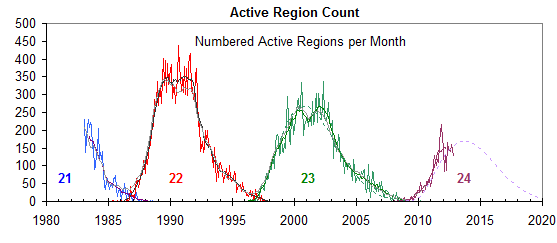 Source: Leif Svalgaard / WattsUpWithThat
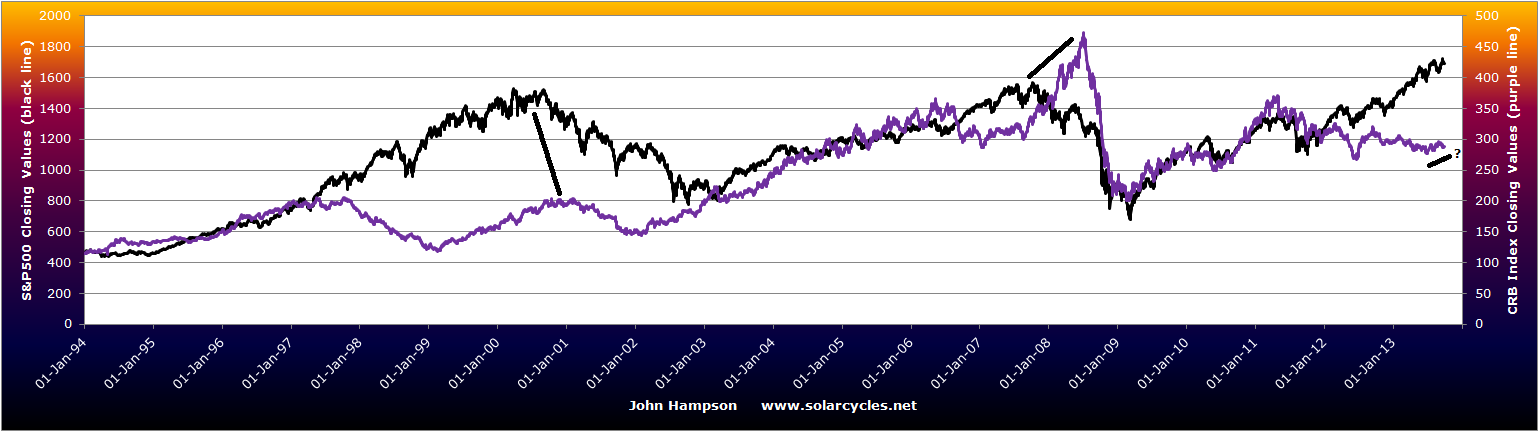
If the first alternative turns out correct, and both the solar peak and commodities peak are behind us, then historically we have seen a new long term bull market in equities underway at this point, and the current easy money conditions could spell big momentum into equities (which would be the polar opposite to the second alternative of equities in a new bear and commoditites sharply rising, thus vital to call correctly). However, my demographic research shows that this is unlikely to be the case, at least not yet, as the positive demographic support for a new global secular stocks bull is absent. Indeed, the collective demographic trends of the major economies, bar Japan, are in an unprecedented collective downtrend.
2. DEMOGRAPHICS
This brings me to the question of whether central bank policy actions have been aggressive and potent enough to compensate for demographic headwinds. If that were to be the case then perhaps an enduring stocks bull and sticking economic growth could be achieved, albeit only whilst ZIRP and QE are maintained. I can very much recommend a read of the next link, which nicely summarises what QE can and can’t do and what Japan’s most-aggressive-to-date QE is likely to achieve:
http://www.scribd.com/doc/137092515/Richard-Koo-Quantitative-and-Qualitative-Easing-2013-04-16
In a nutshell, QE and ZIRP aren’t that potent as they cannot force people and companies to borrow or spend or invest. In the 1990s Japan tried to offset demographic downtrends with QE and ultra low rates and other stimulus tools. Even though most of the major economies were in demographic uptrends in that period (with booming asset markets and economies), this positive global environment AND these central bank actions were not enough to get people and companies to borrow, spend or invest.
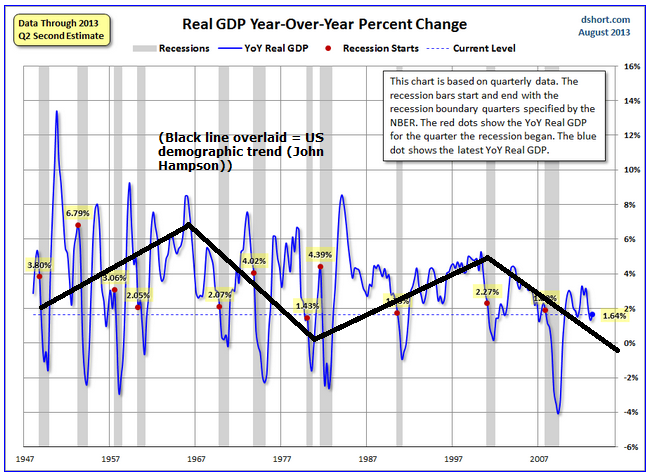
I have overlaid the overall US demographic trend against Doug Short’s real US GDP growth chart here:

Underlying Source: Dshort
The yellow dots reveal that real US GDP is currently lower than any previous recession start point. I suggest this shows the relative impotence of QE and ZIRP, and would argue that the demographic downtrend which should be in place for the bulk of this decade, suggests that real GDP growth level should fall negative again in the near future and another recession kick in. The question is whether this occurs with or without the tipping help of a speculative rally in commodities.
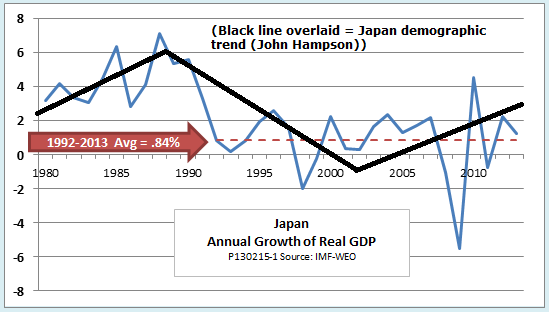
Here is the same for Japan: real GDP growth versus overall demographic trend.
 Underlying Source: Economonitor
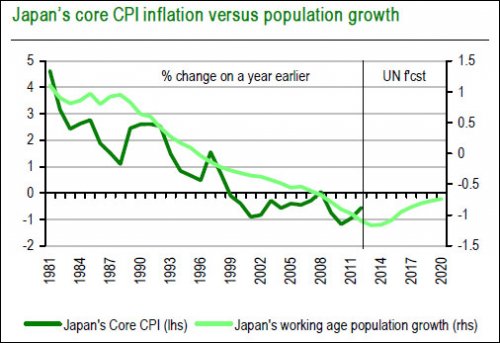
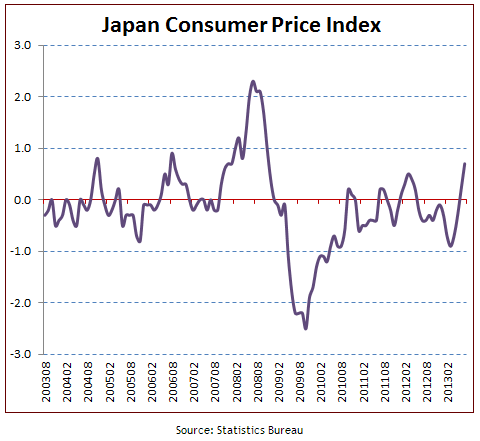
By demographics, Japan should be able to nurse along positive real GDP growth for the next few years. It should also be able to succeed in stopping price deflation:
 Source: Andrew Cates
Note that both should be feasible by demographics alone, without ‘Abenomics’. The demographic trends for Japan mean that we should see underlying growth, price stabilisation, and rising asset markets, which I believe will be touted as positive results of Abenomics when in fact largely written by the demographic change of trend.
3. JAPANESE EQUITIES
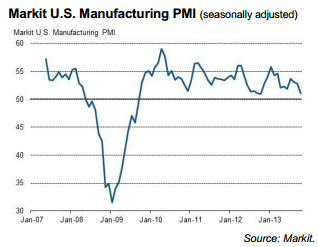
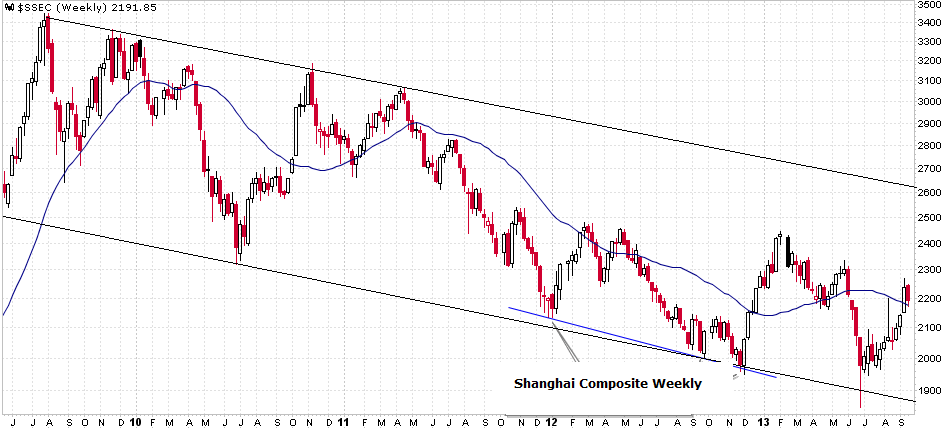
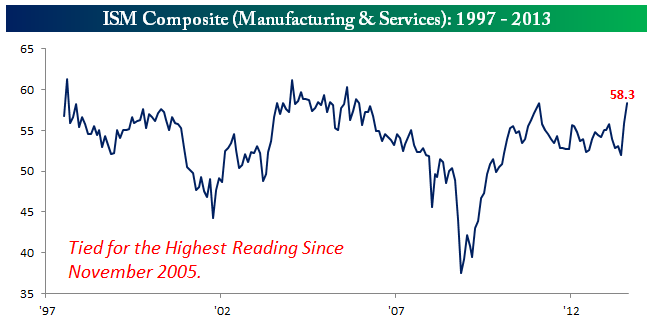
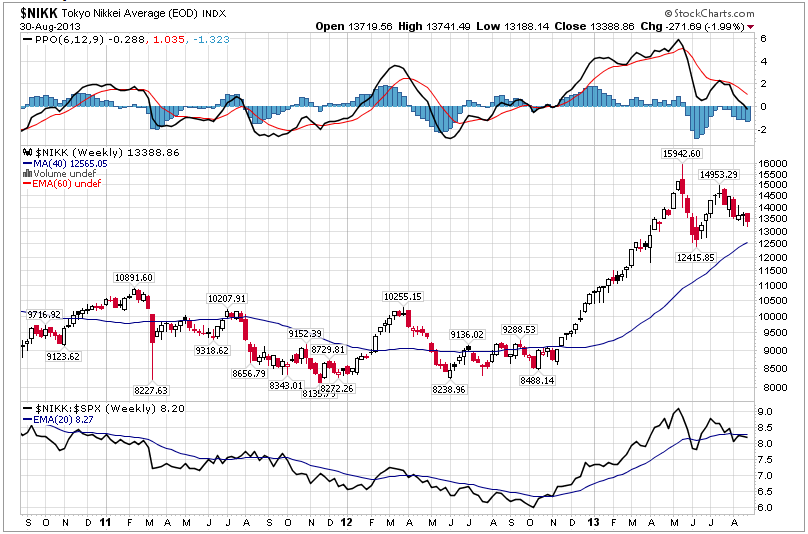
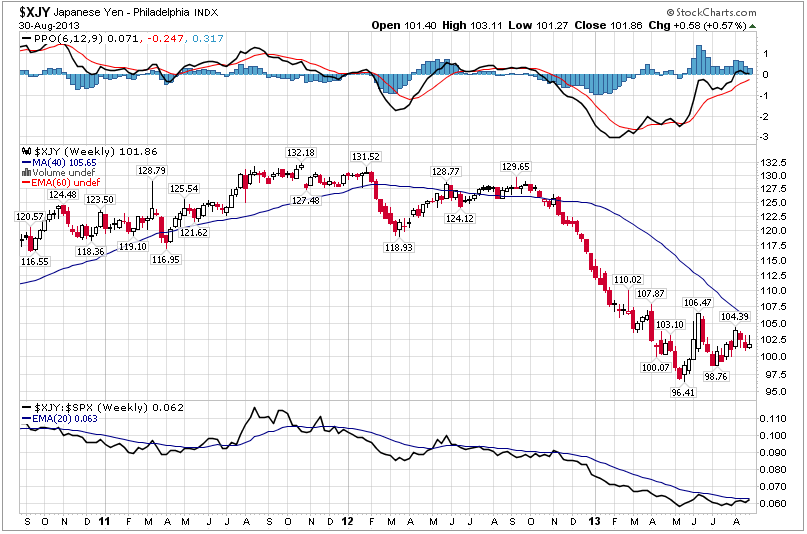
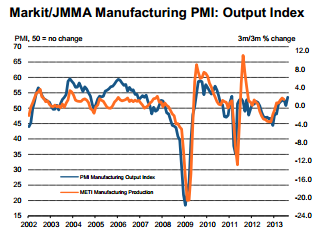
So is Japan a buy? Not all recent economic data has been supportive, but manufacturing and service PMIs are indeed in runs of positive growth, revealing underlying economic improvement. The Yen and Japanese bonds both dropped sharply following the launch of Abenomics but have since retraced some. However, the Yen now appears to have broken down out of a bear flag, whilst Japanese bond yields are shaping for a higher low and a potential push on from there. The Nikkei also consolidated following the big run up earlier in the year, but has now broken upwards out of two consolidation patterns shown:
 The line you can see coming into picture at the very top is the 2-decade declining resistance, the containment of the long term bear. I believe a retest of this should be on the cards and I have decided to add to playing Japan equities on the long side. However, if US equities are in a multi-month topping process and soon to enter a new cyclical bear market, then I would not expect Japanese equities to go their own way, only rather to relatively outperform, which would mean decline less. Nonetheless, a new bull market in Japanese equities is belated relative to demographics and I feel happy here trying to make profits on the long side – expecting any downside is more limited than other markets – whilst still trying to assess where US and global stocks are headed. The supporting evidence for Japanese equities to rise should come in real GDP, real economic improvement, and indeed an underlying bid in Japanese risk asset markets. So I will continue to watch the data releases.
4. USA
So back to the US. Here is the latest picture for ECRI leading indicator growth:
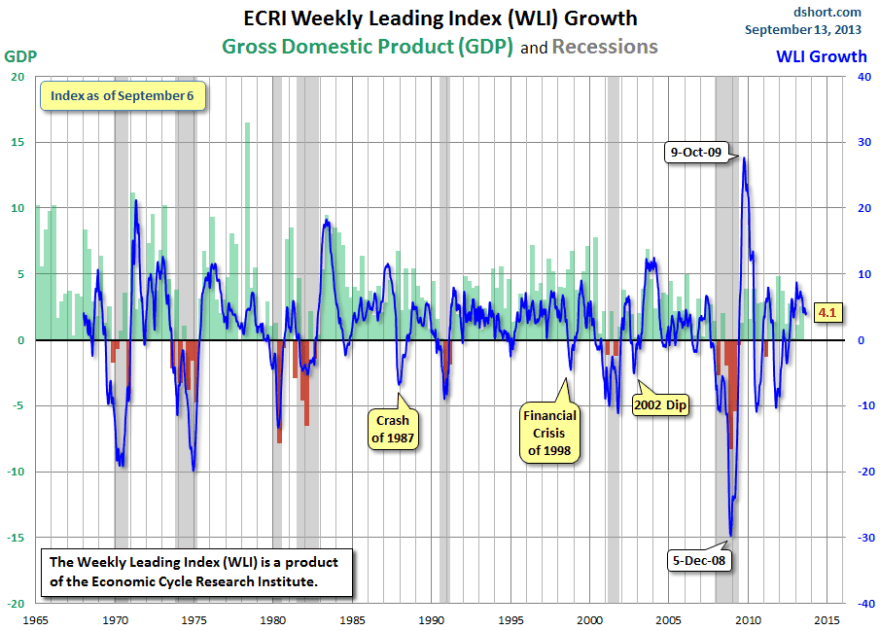 Source: Dshort / ECRI
ECRI leading indicator growth fell beneath zero prior to each recession shown in grey. The break into the negative often historically occurred close to the stock market topping, with stocks typically being a leading indicator of the economy. We can see there have been several breaks beneath zero that did not give way to a recession, not least the fairly deep fall in 2011 that helped ECRI (incorrectly) announce a recession. However, my take on the current reading of 4.1 is that we should see this fall towards zero if we are to see a cyclical bear erupt in equities and a recession to occur ahead. This growth measure has been in a declining trend since early 2013, so to add weight to an equities top being formed, we should continue to see this dropping. For now though, this leading indicator, and other leading indicators (such as Recession Alert or Conference Board) point to continued economic growth into year-end.
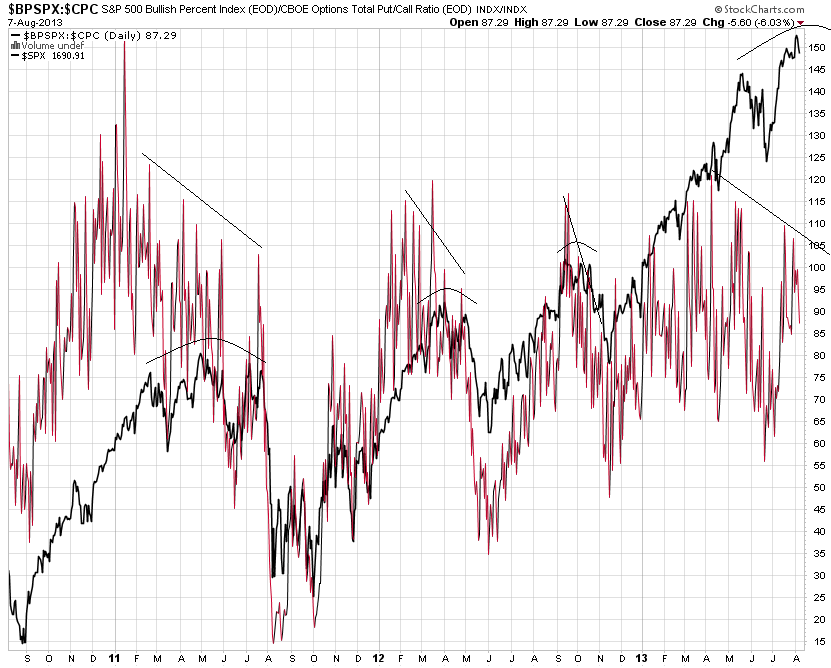
Weak but sustained growth and low rates are typically a good environment for equities, which would be a framework for equities to move higher and reveal the consolidation since May as digestion in an ongoing cyclical bull. In supportive of this, the Nasdaq is now convincingly at new highs for this cyclical bull, and the Dax is back testing its high-to-date (which is also the all-time nominal high). If other indices break up and away from the ‘topping range’ then we would be looking to 2014 for a cyclical top as a multi-month topping process would have to start over. As noted in a recent post we have some evidence for a topping process in play since May, but also some normal signs missing. This should be resolved one way or the other soon.
5. COMMODITIES AND BONDS
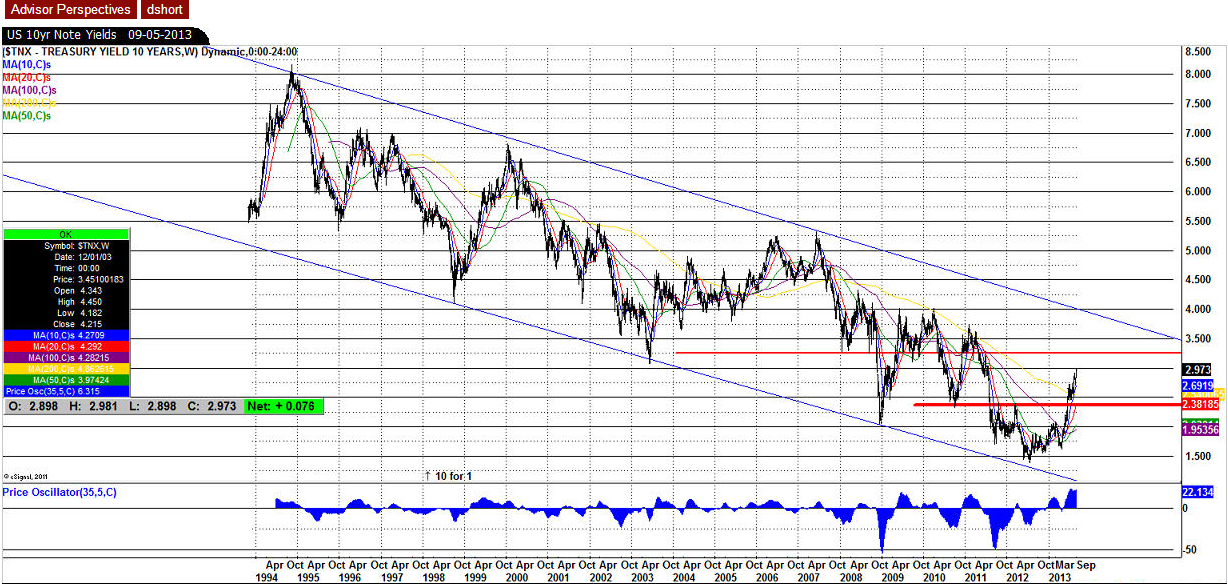
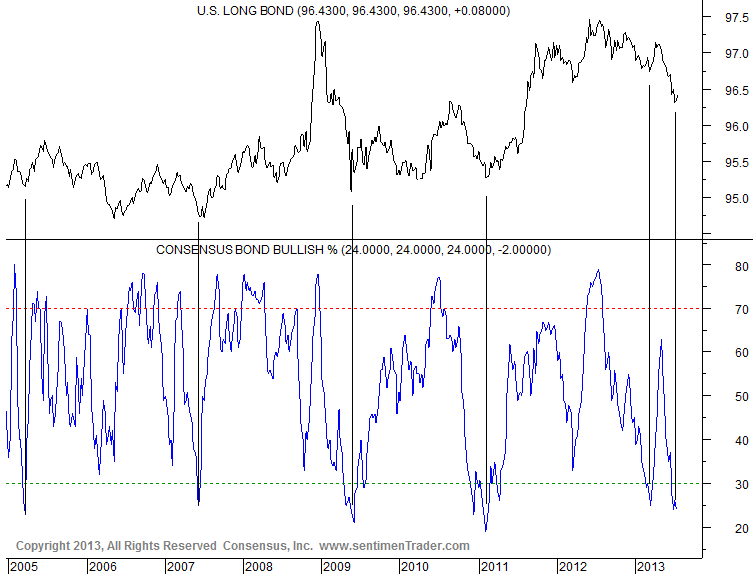
Which brings me to the two main threats to the economy and the equities cyclical bull: excessive inflation from sharp rises in commodity prices and/or excessive tightening from rising rates in escalating bond yields. Bond yields in the major economies continue to rise albeit from low levels. If economic growth persists further and the Fed begins to taper QE then we could expect yields to continue to rise. Historically, the tipping point has been when 10 year treasury yields hit 6%, however today’s demographic and debt interest pressures mean that trouble level is likely to be lower.
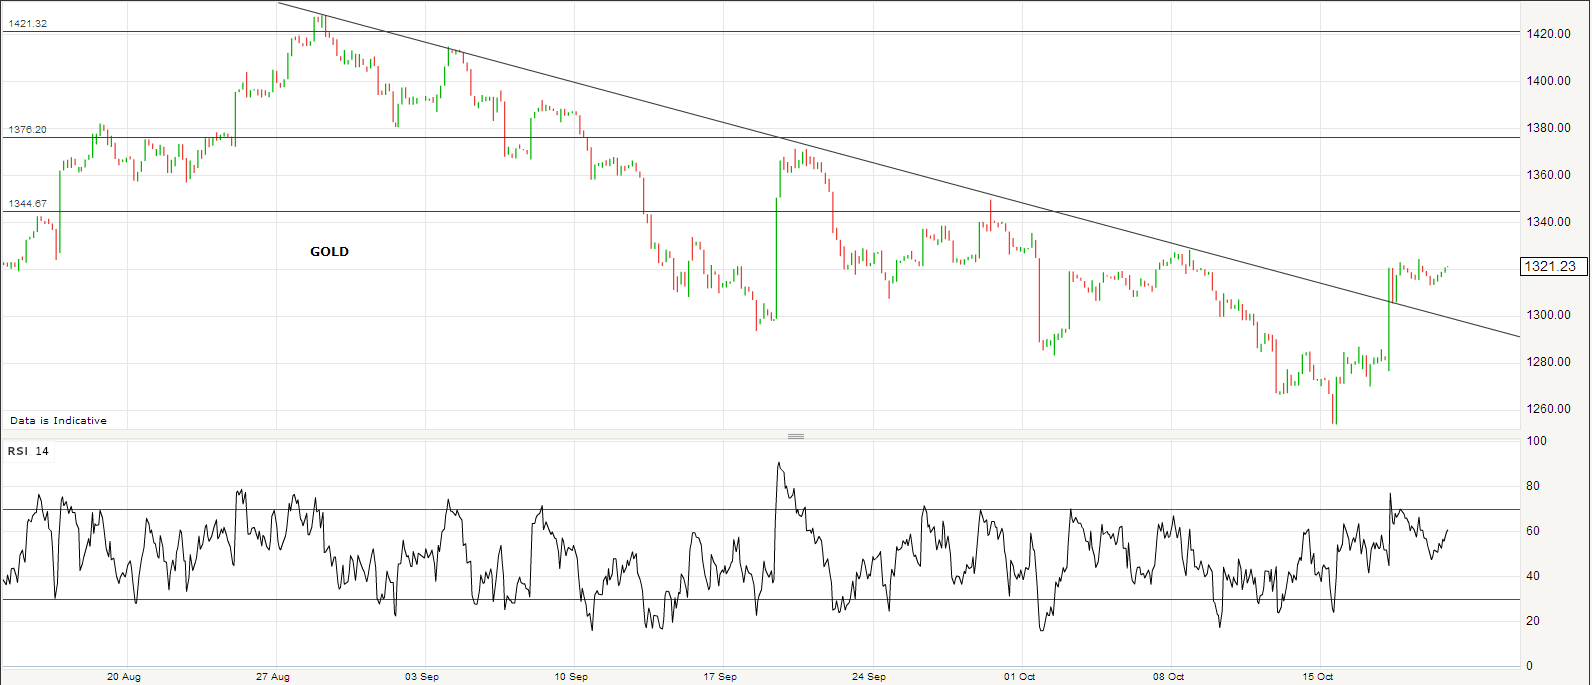
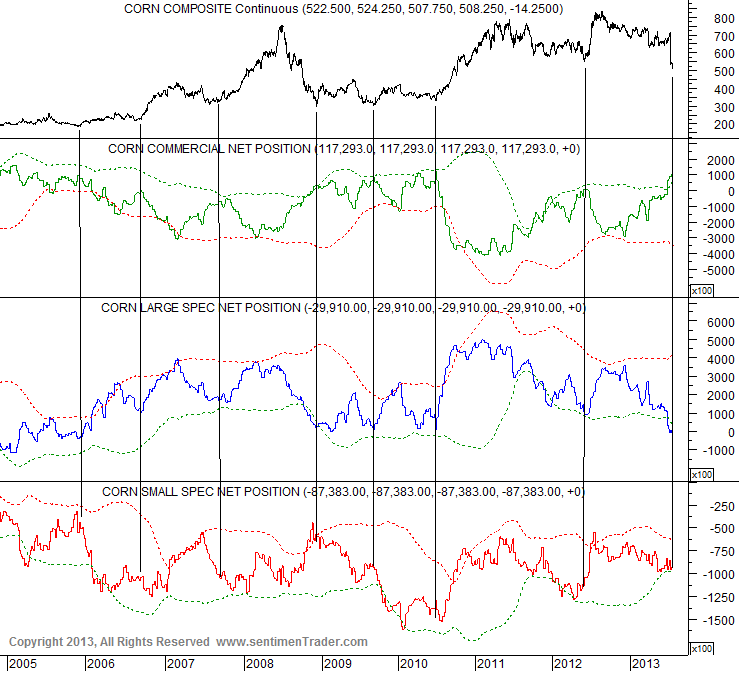
Regarding commodities, the most important is oil, as quick major escalations in oil prices have historically correlated with tipping the economy into recession, due to its importance as an input in so many processes. Despite the slack and weakness in the global economy, crude prices have hung around the $100 level the last 3 years. A speculative move into this asset, for any number of reasons, could under current easy money conditions swiftly lead to $125 oil, which I believe would really test a demographically-challenged weak global economy.
On the flip side, the same demographic trends could further erode commodity demand and also limit the exit from bonds. Further commodity price drops, together with yields stabilising relatively low, would again provide the backdrop for equities to march on and economic growth to persist – unless the potency of the collective demographic downtrends drag the economy down into recession on their own.
If Martin Pring’s normal historic topping order is playing out, then we have seen the top in bonds already, we should now see evidence of equities topping and of a transfer in momentum to commodities which should make a peak last as the economy rolls over. This would imply yields and commodities rise despite demographics, and for my work this would be a better fit if the solar peak were still ahead at the turn of 2013/14, with commodities making a final and bigger peak in the months around that.
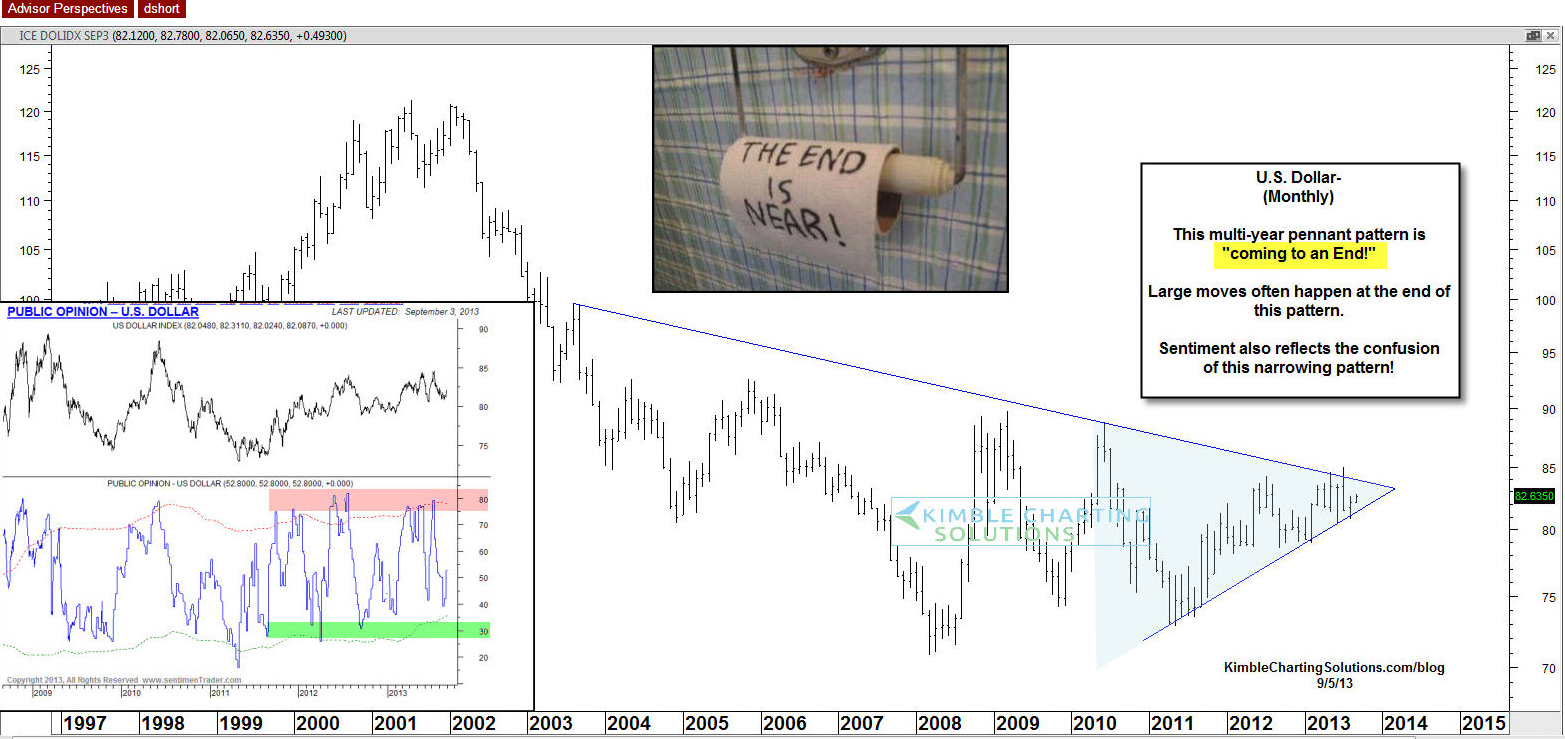
I believe evidence in support of or against this could become clearer as soon as next week, watching the markets’ reactions to the FOMC output. Some mild tapering is being widely touted as a done deal, but the size and the wording we don’t know. Regardless, I expect a big reaction in the markets and it will be telling how commodities, precious metals and the US dollar, fare afterwards. If commodities are going to make a final big rally then the tentative uptrend of the last couple of months should cement and a US dollar breakdown out of its long term triangle (see HERE) would be a great partner for such a development.
6. TRADING
We are over 3/4 of the way through the year and my PnL is currently showing my worst year of performance to date since going full time, due to the run against commodities longs this year, particularly precious metals. This would repair itself if commodities did begin an uptrend in the last couple of months and now continue into year end, but it could yet go worse if they are in a bear market since 2011 and have further falls ahead. So I have decided to use the Autumn to do what I can to make sure of a good result by year-end. This means I am going to add shorter term trading to my game in this period, whilst running the more medium-term-focused global macro positions. Short trades are something I’ve done before, but not for some time due to success (and personal preference) with the longer term methods. So, I just wanted to share with you that this is what I’m going to be doing different. I am looking for liquid markets that I can play more aggressively for quick gains. So I am looking for candidates amongst the major markets that I can play confidently repeatedly either long or short (i.e. fundamentals/technicals align in favour of one way or the other), and this will include increasing exposure if movement goes the other way. One such play-thing is going to be the Nikkei on the long side, as mentioned above. I am going to pour over some other markets (stock indices, commodities, fx) to find others that I consider suitable, so will share when I decide. You may disagree with my choices and indeed the method, but I’m just sharing what I’m doing, and will let you know the results.
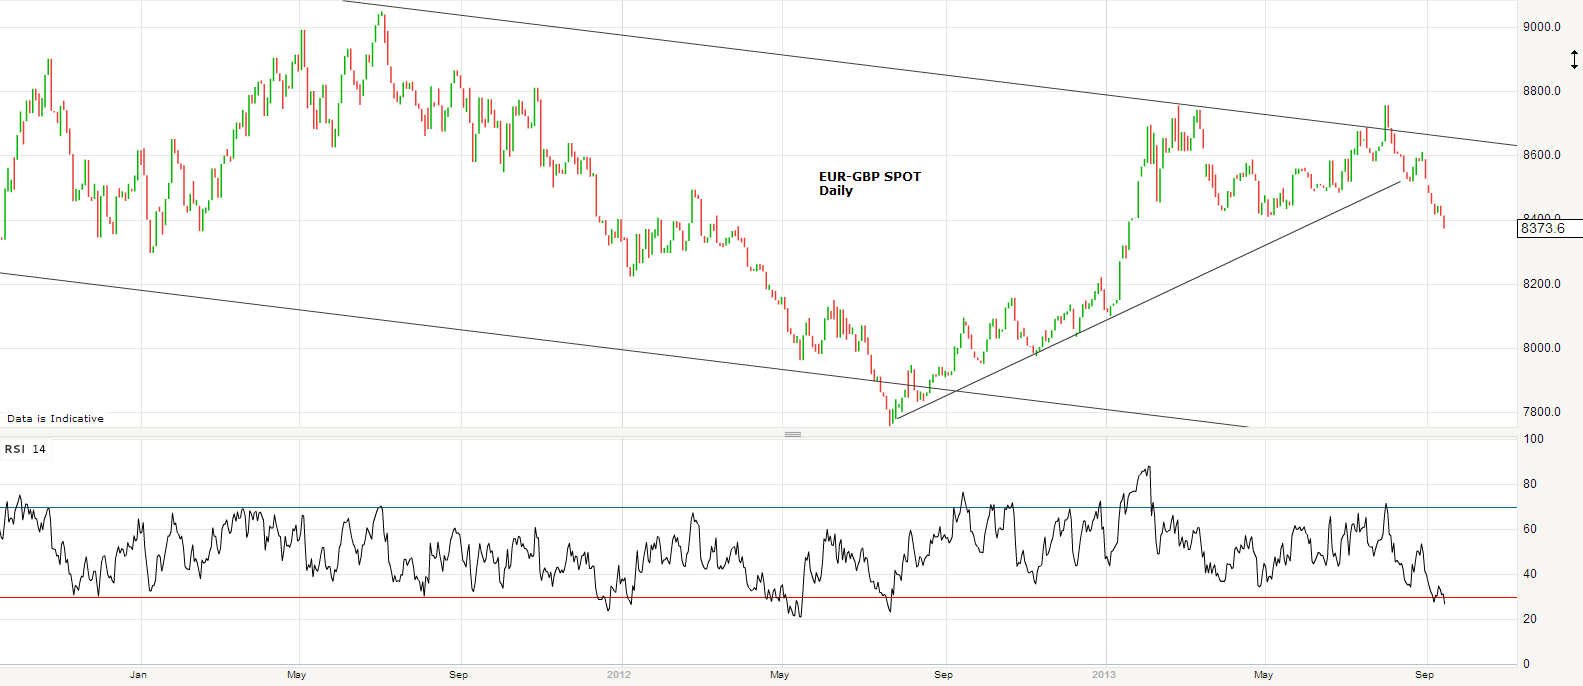
One last thing. Almost all my money is in sterling and I am looking to transfer this to Euros, now I am in Austria. The EUR-GBP exchange rate has therefore become part of my daily watch. A one cent movement in either direction makes a massive difference when considering the amount I am going to be transferring and getting this ‘right’ is as important as my other trading, in terms of the impact on my wealth. So I’ll share my current thoughts, but if any reader is more of a regular in the FX market, please step forward and share your knowledge.
EURGBP has been in a large declining channel since the start of 2009, with the last 3 year snippet shown below. In July of this year the Euro tried to break out, as the Eurozone recovery became more apparent, but it turned out to be a fake-out, and recently UK economic data has surprised to the upside, which has helped not only turn it back down into the channel but also break down beneath the rising Euro support shown. The Pound is fairly overbought now versus the Euro and EURGBP spent last week trying to base. However on Friday there was a further breakdown in favour of the Pound, taking the pair beneath 84. The latest UK inflation data is out this coming week which should influence the pair one way or another, however I believe that ultimately the Euro can drop further here against the Pound, given the technical developments and the change in the fundamental backdrop, and I’m going to hold out for 82- at this point and will review.


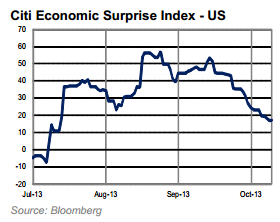
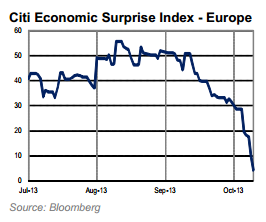
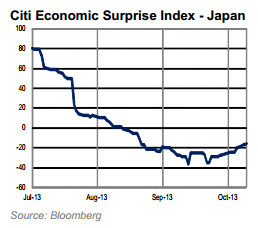
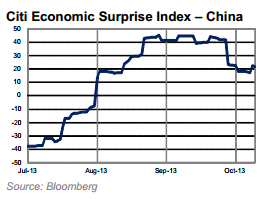 Leading indicators for the US falling:
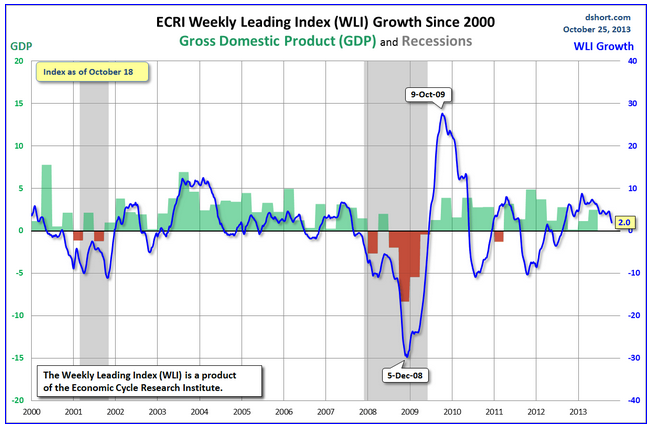


