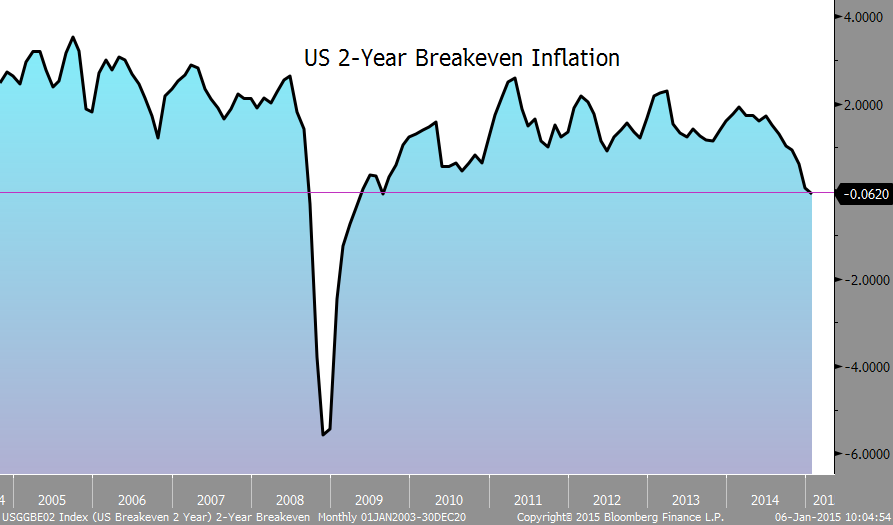
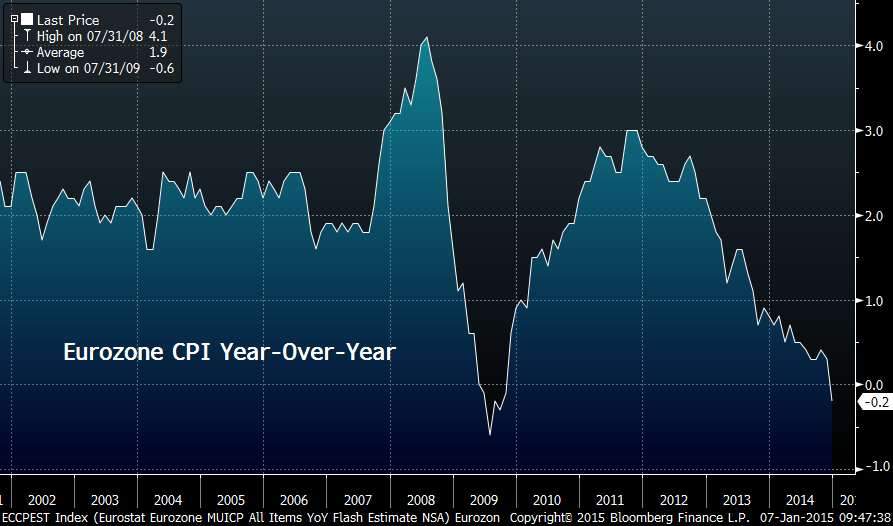
The irrationality continues, but not for much longer.
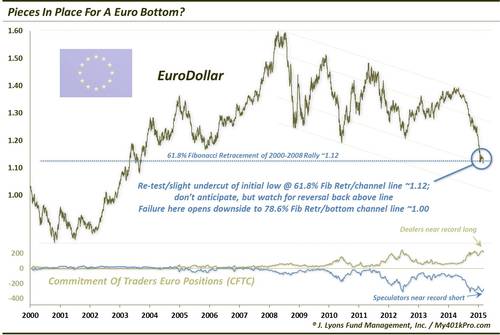
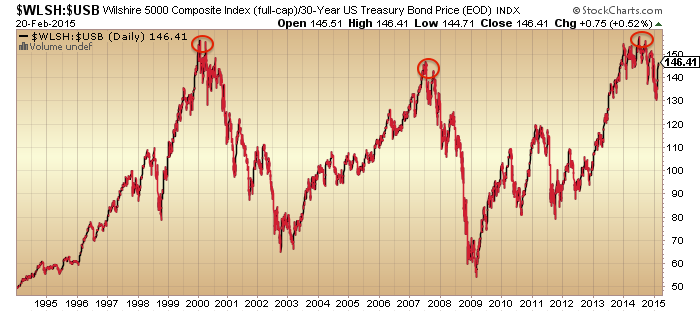
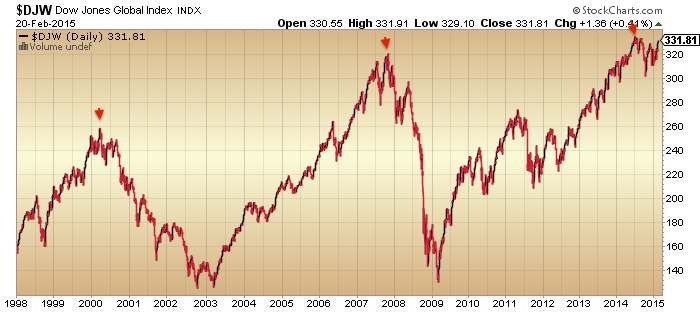
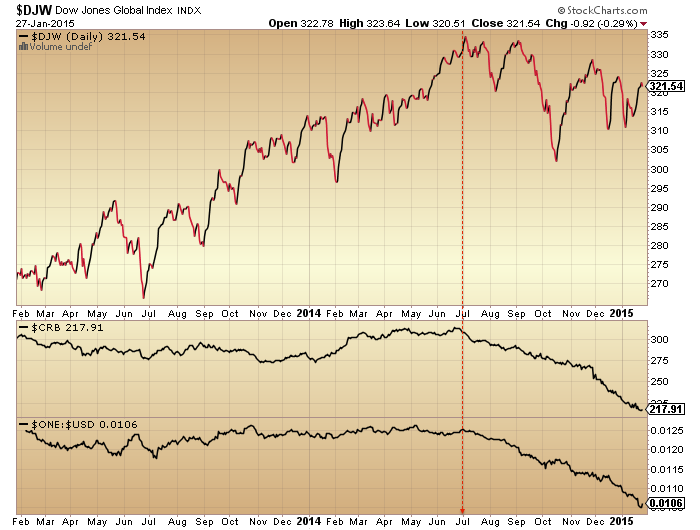
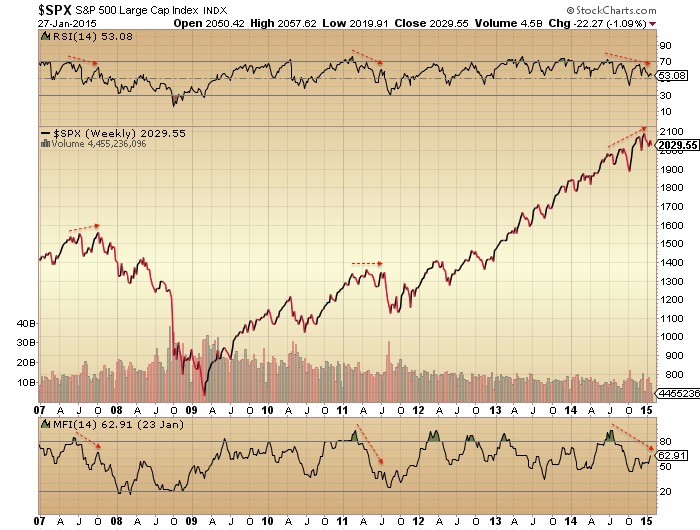
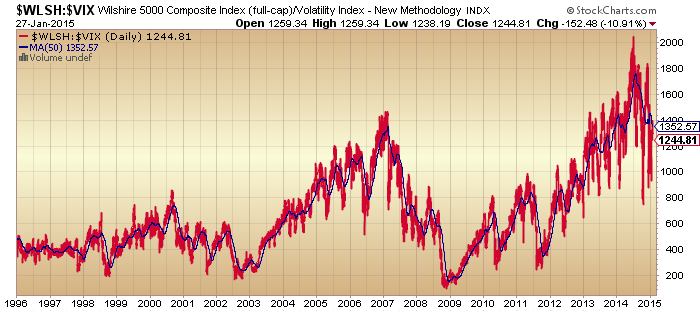
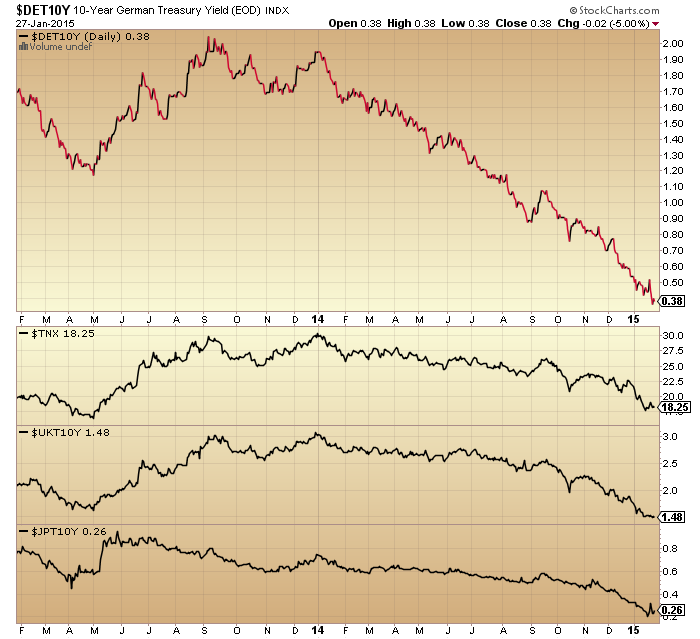
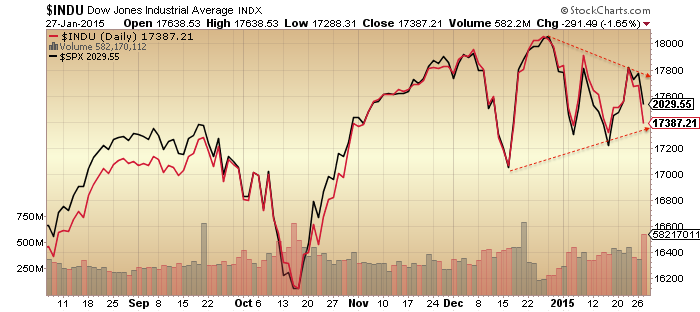
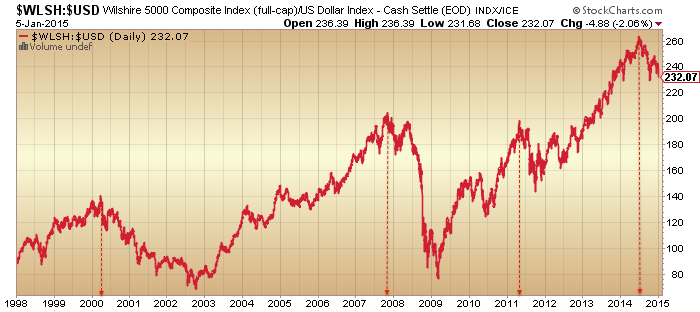
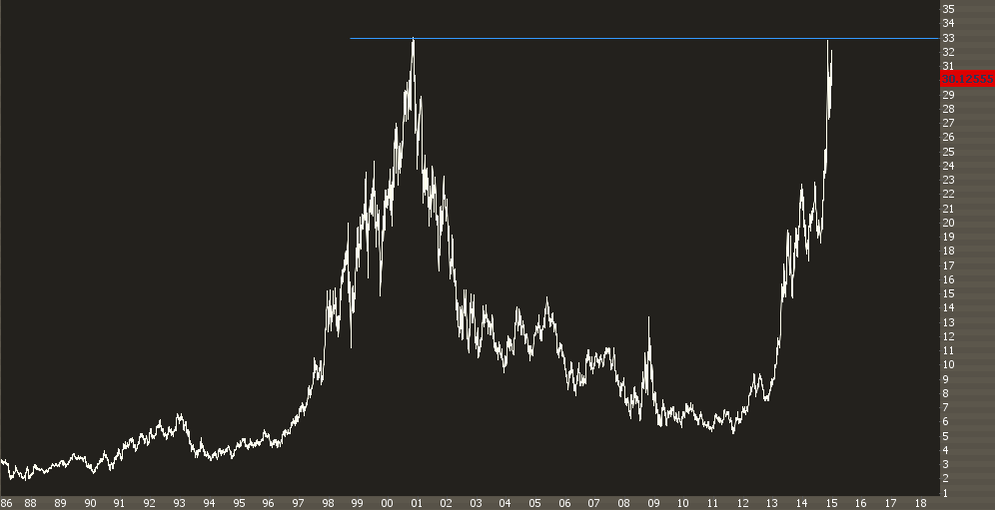
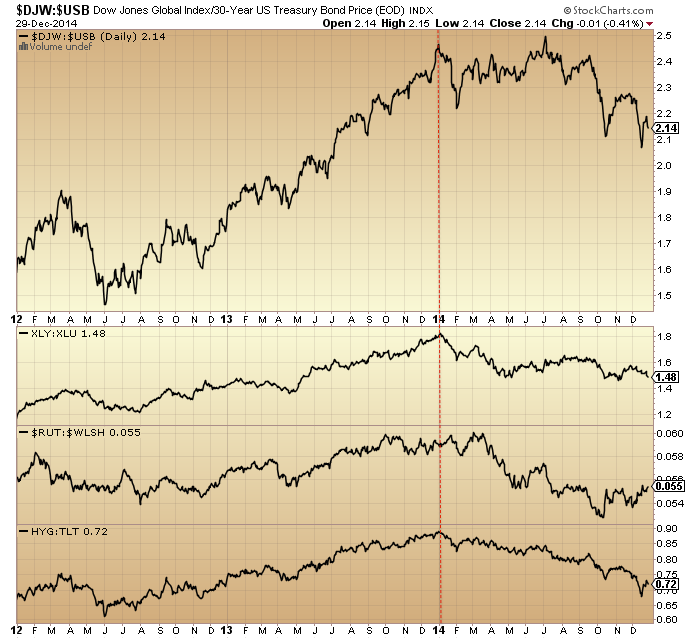
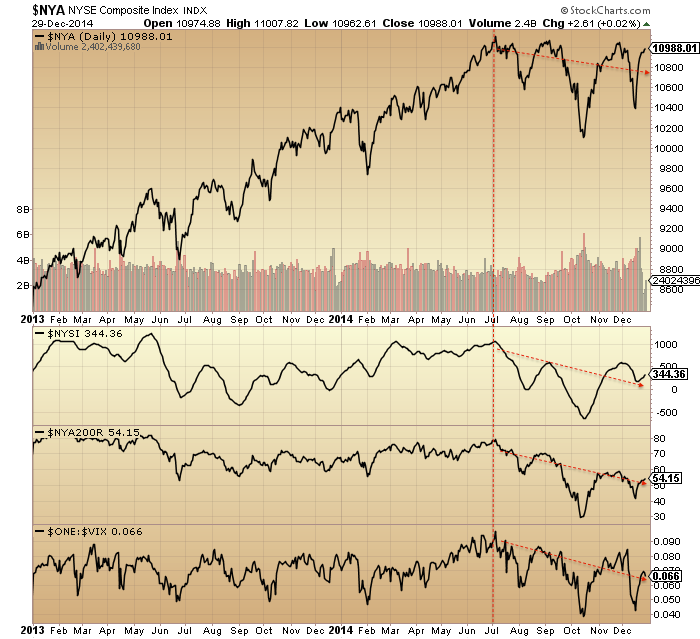
After last year’s solar maximum, the cross-asset picture changed. Global stocks entered into a topping range whilst money flowed into the US dollar and treasuries, plus commodities (shown inverted) collapsed, all in a deflationary recessionary wave.
 Source: Stockcharts
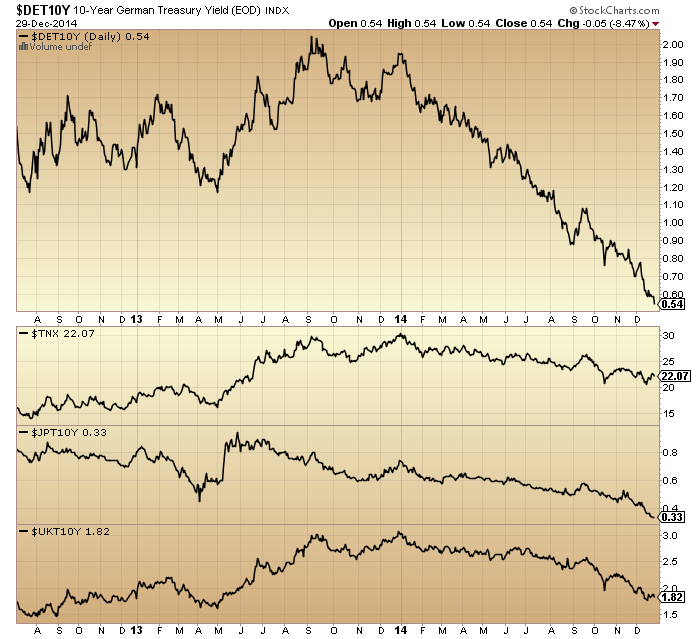
Global leading indicators turned down from that point and are now negative, like in 2000, 2008 and 2011.
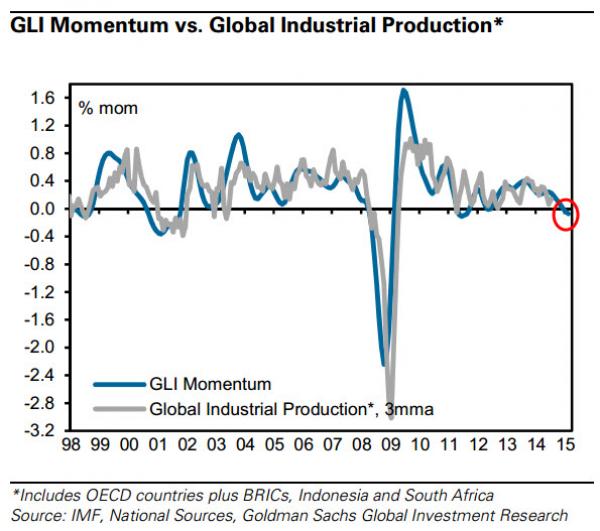 Source: Goldman Sachs
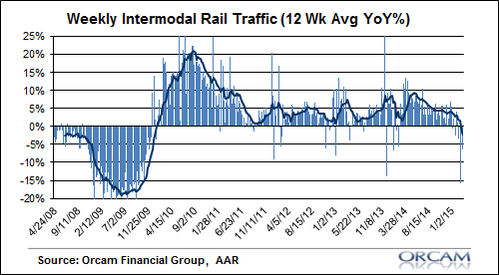
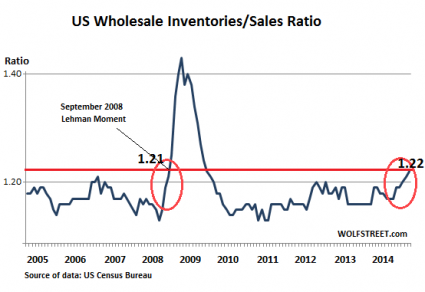
China data turned sour.
 Source: Sober Look
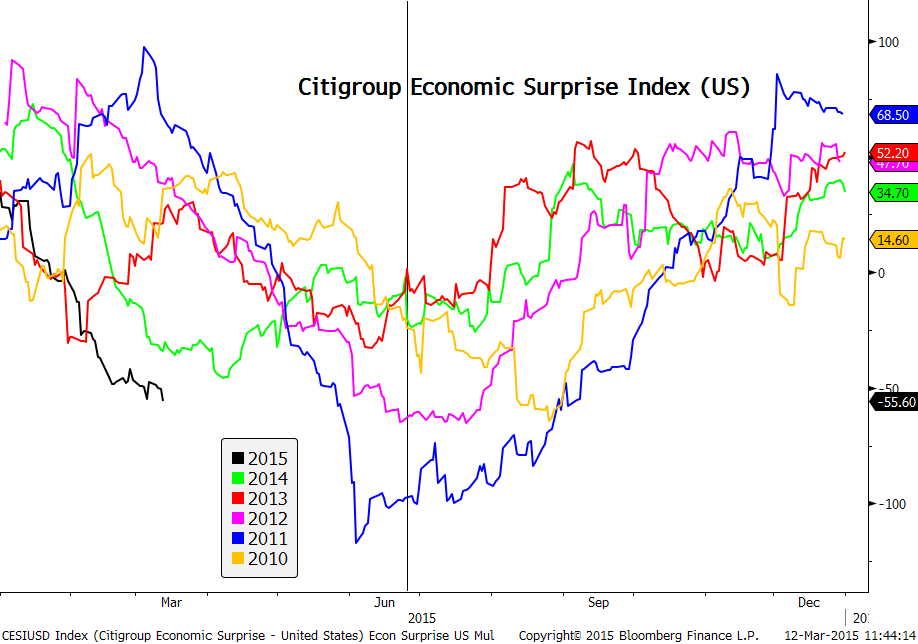
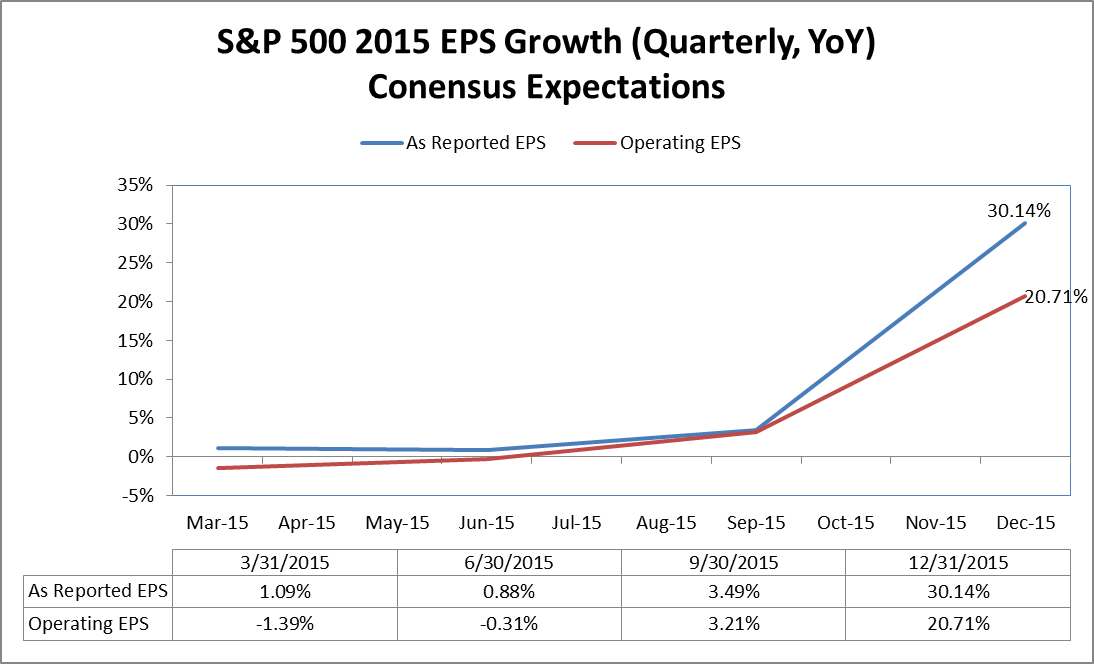
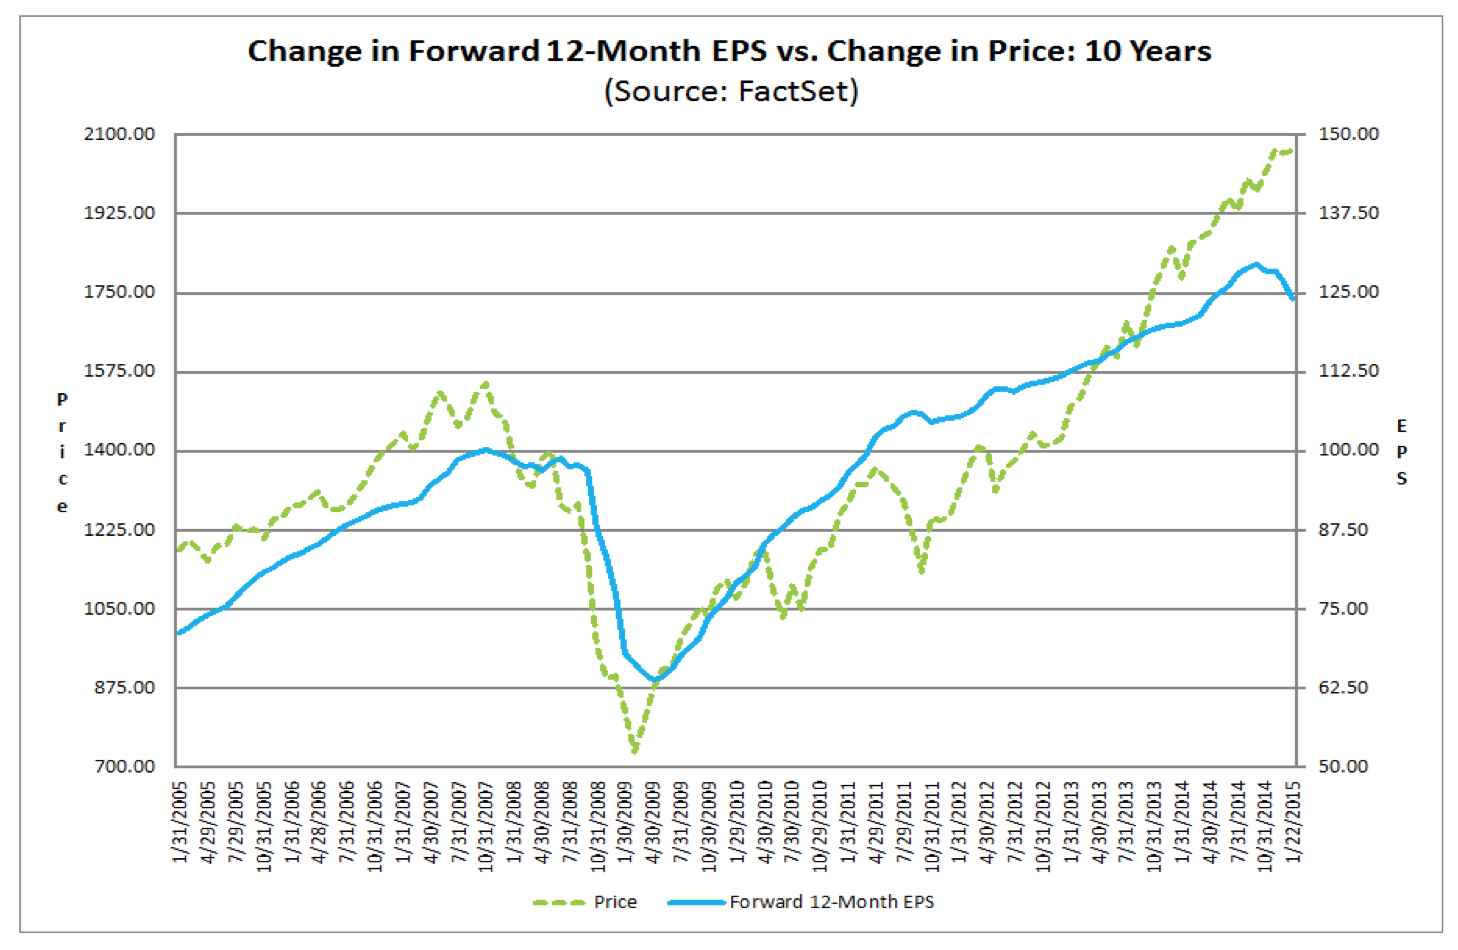
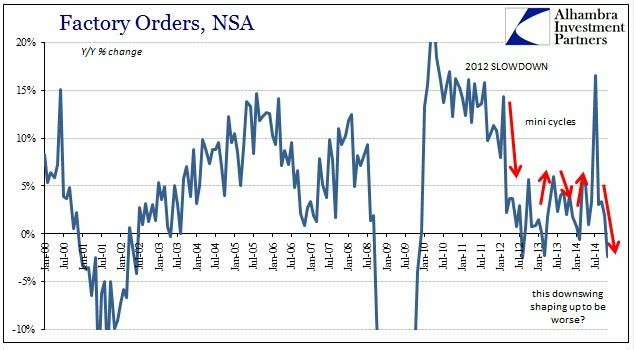
US earnings projections and economic data diverged sharply from the stock market.
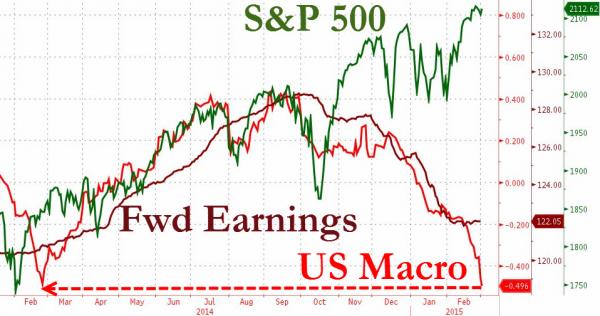 Source: Zero Hedge
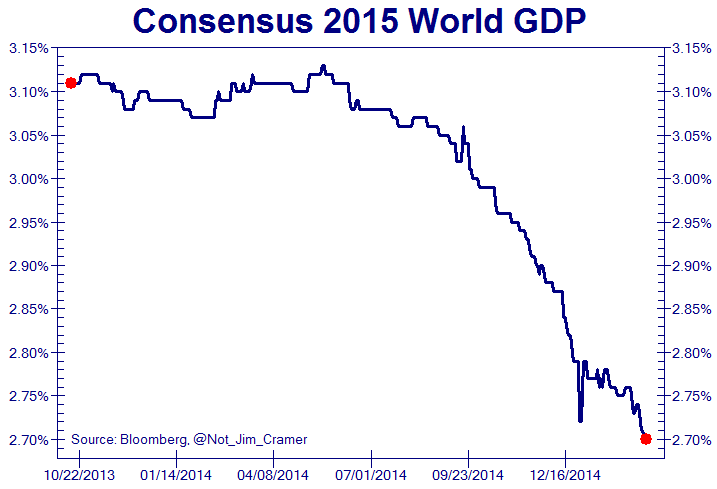
Also captured here in homebuilder stocks versus housing data.
 Source: Not_Jim_Cramer
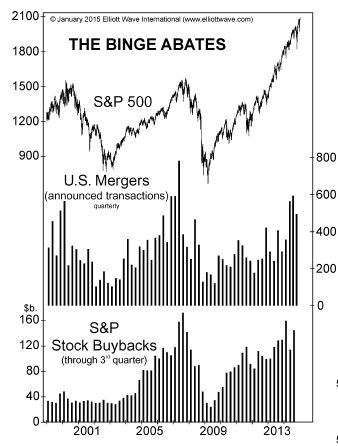
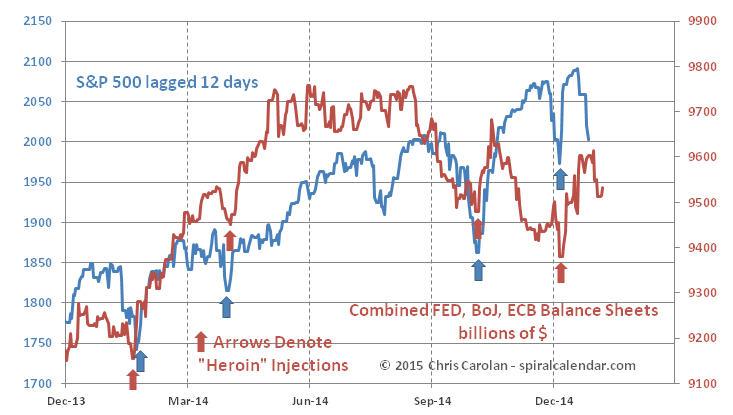
Buybacks fell away from their peak.
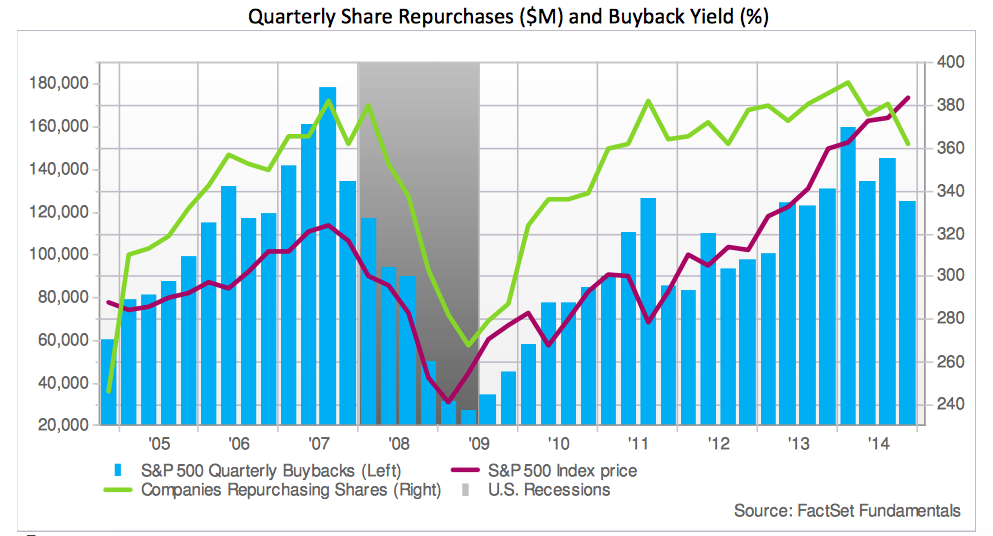 Source: Factset / Jessie Felder
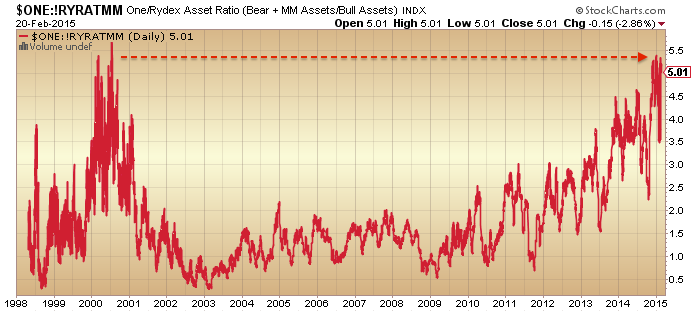
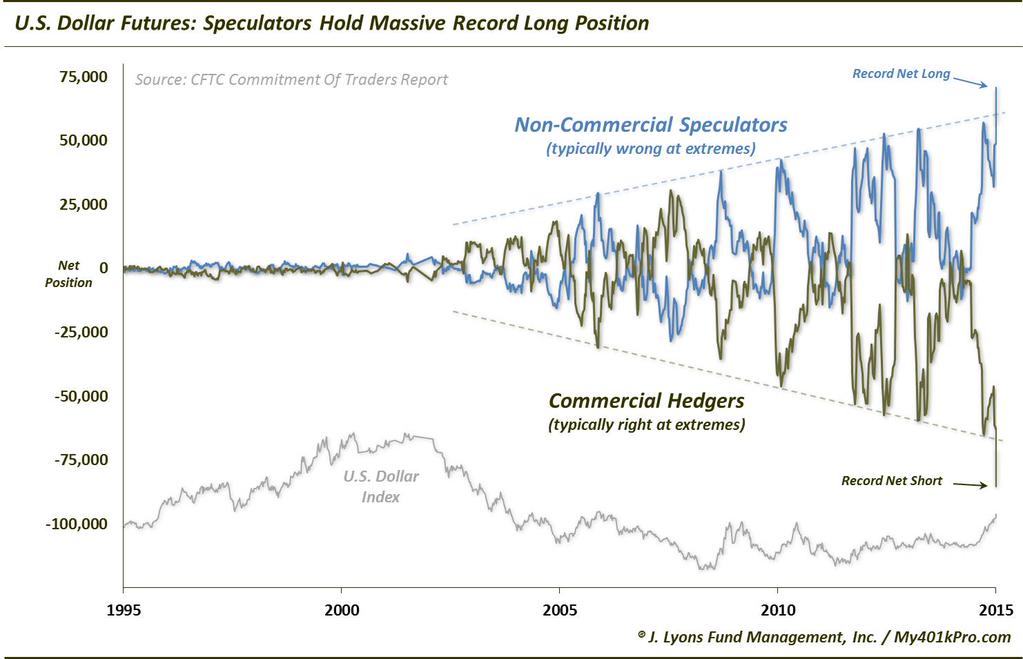
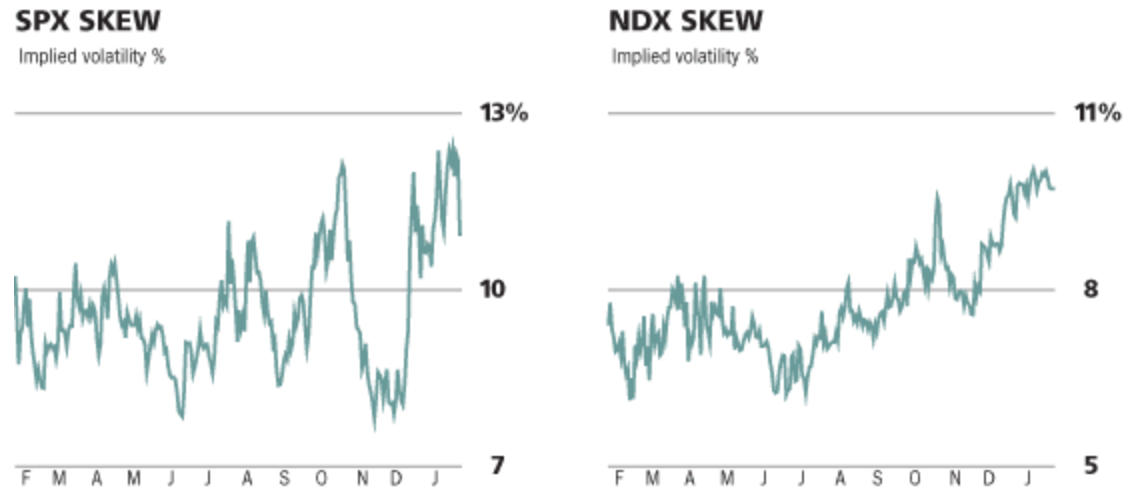
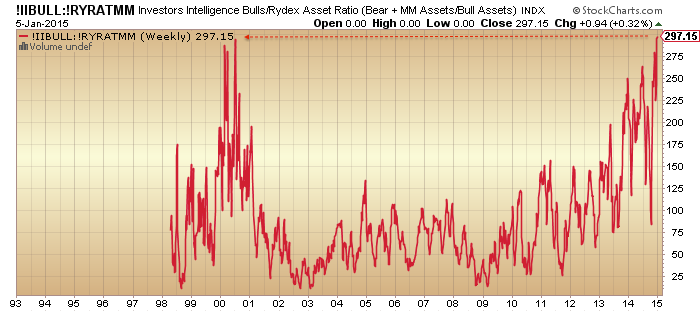
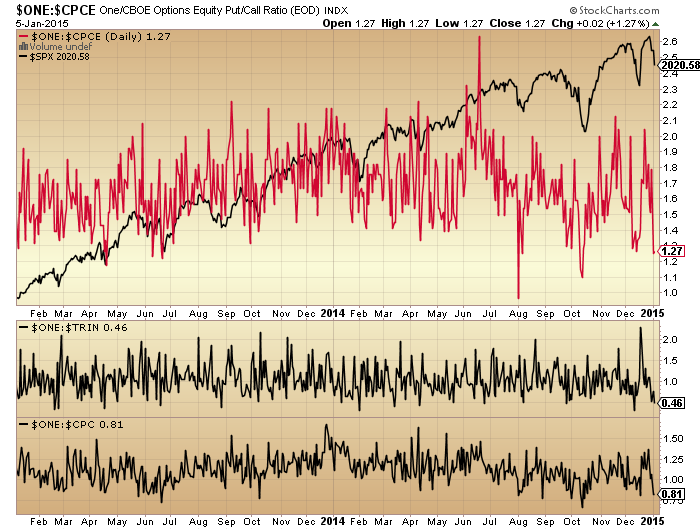
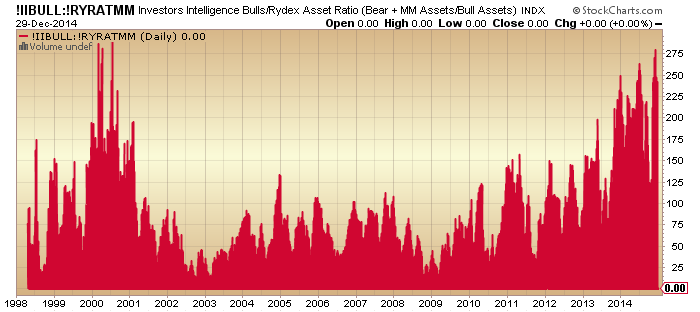
And hedging moved contrarian.
 Source: Sentimentrader / Sundial
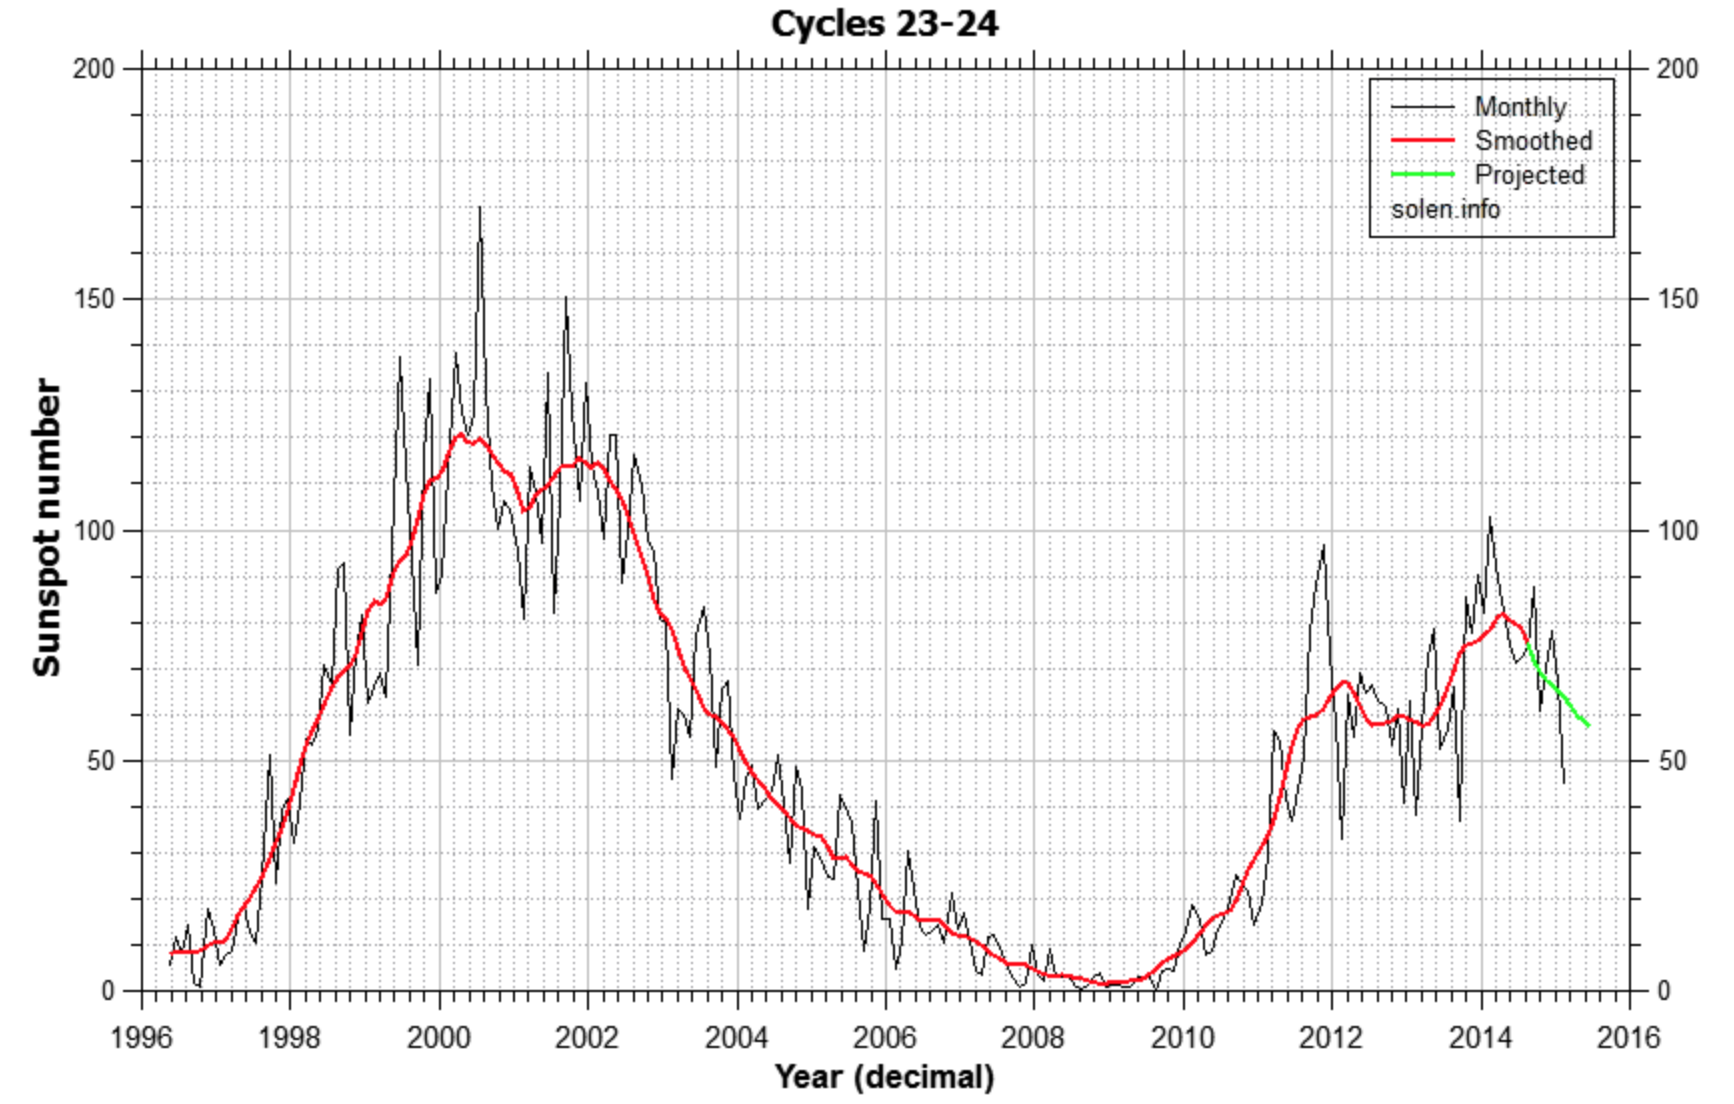
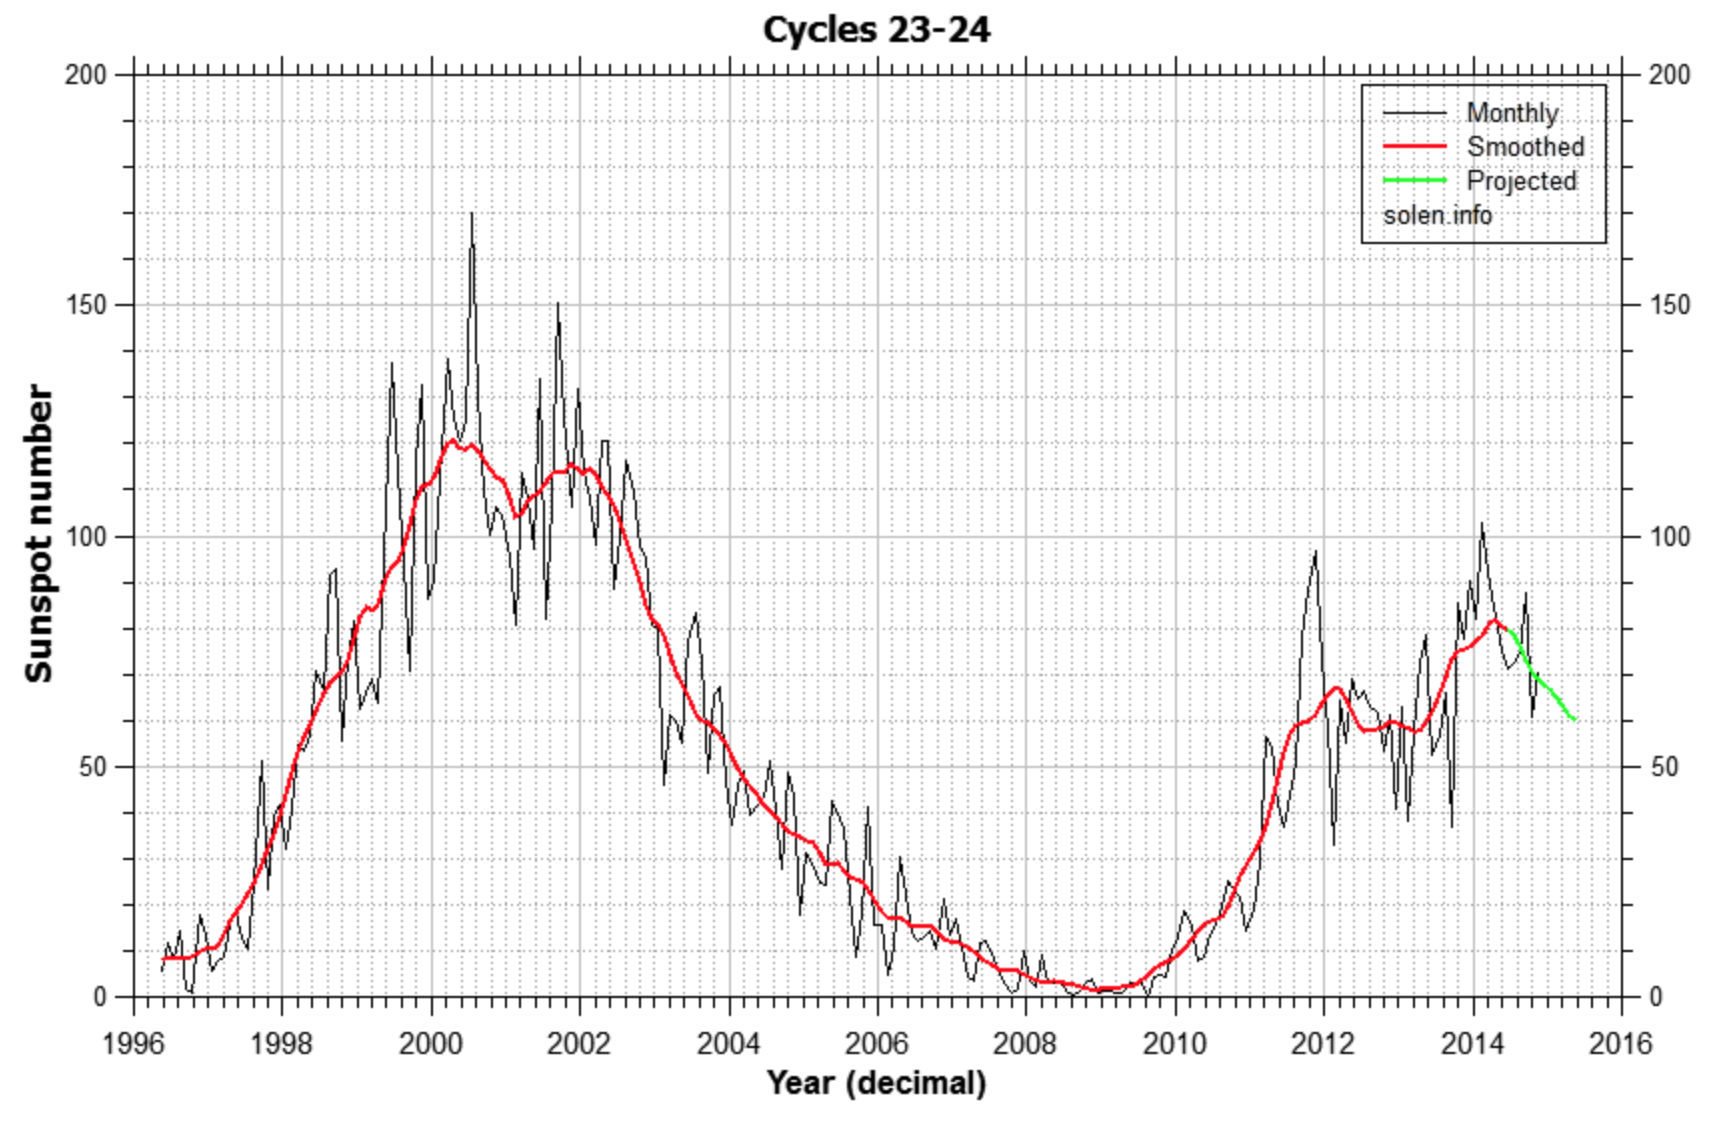
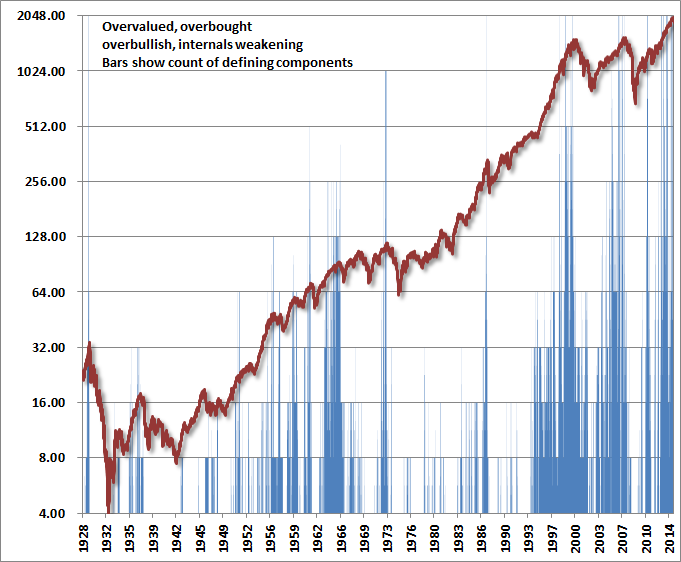
In short, everywhere you look the footprint of the solar maximum can be seen: the subtle peaking in human excitement in terms of both economic activity and financial market speculation around mid-year 2014.
 Source: Not_Jim_Cramer

Source: SpiralCalendar
Following the solar maximum comes the peak in geomagnetic disturbance which adds to the negativity. See here the major storms (red downward spikes) of July and August 2000 which coincided with the SP500 reversal, all following the solar maximum of March 2000.

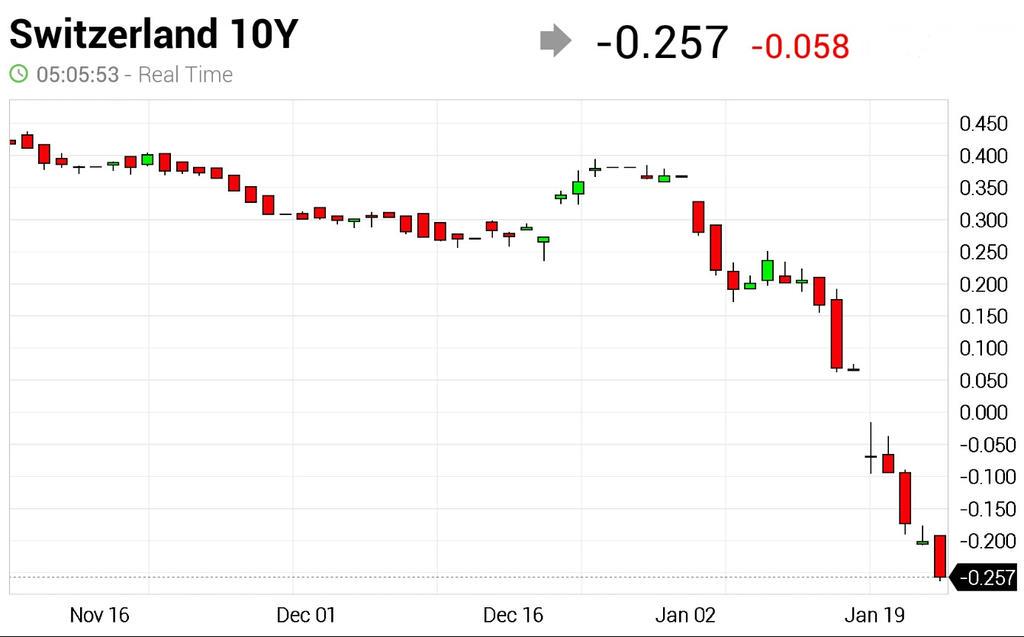
This last week saw a similar occurence of a major geomagnetic storm, the massive red spike down on the right:

Put into a trend, geomagnetism has been diverging from the stock market since mid-2014, like the rest, and that storming serves to steepen the trend.
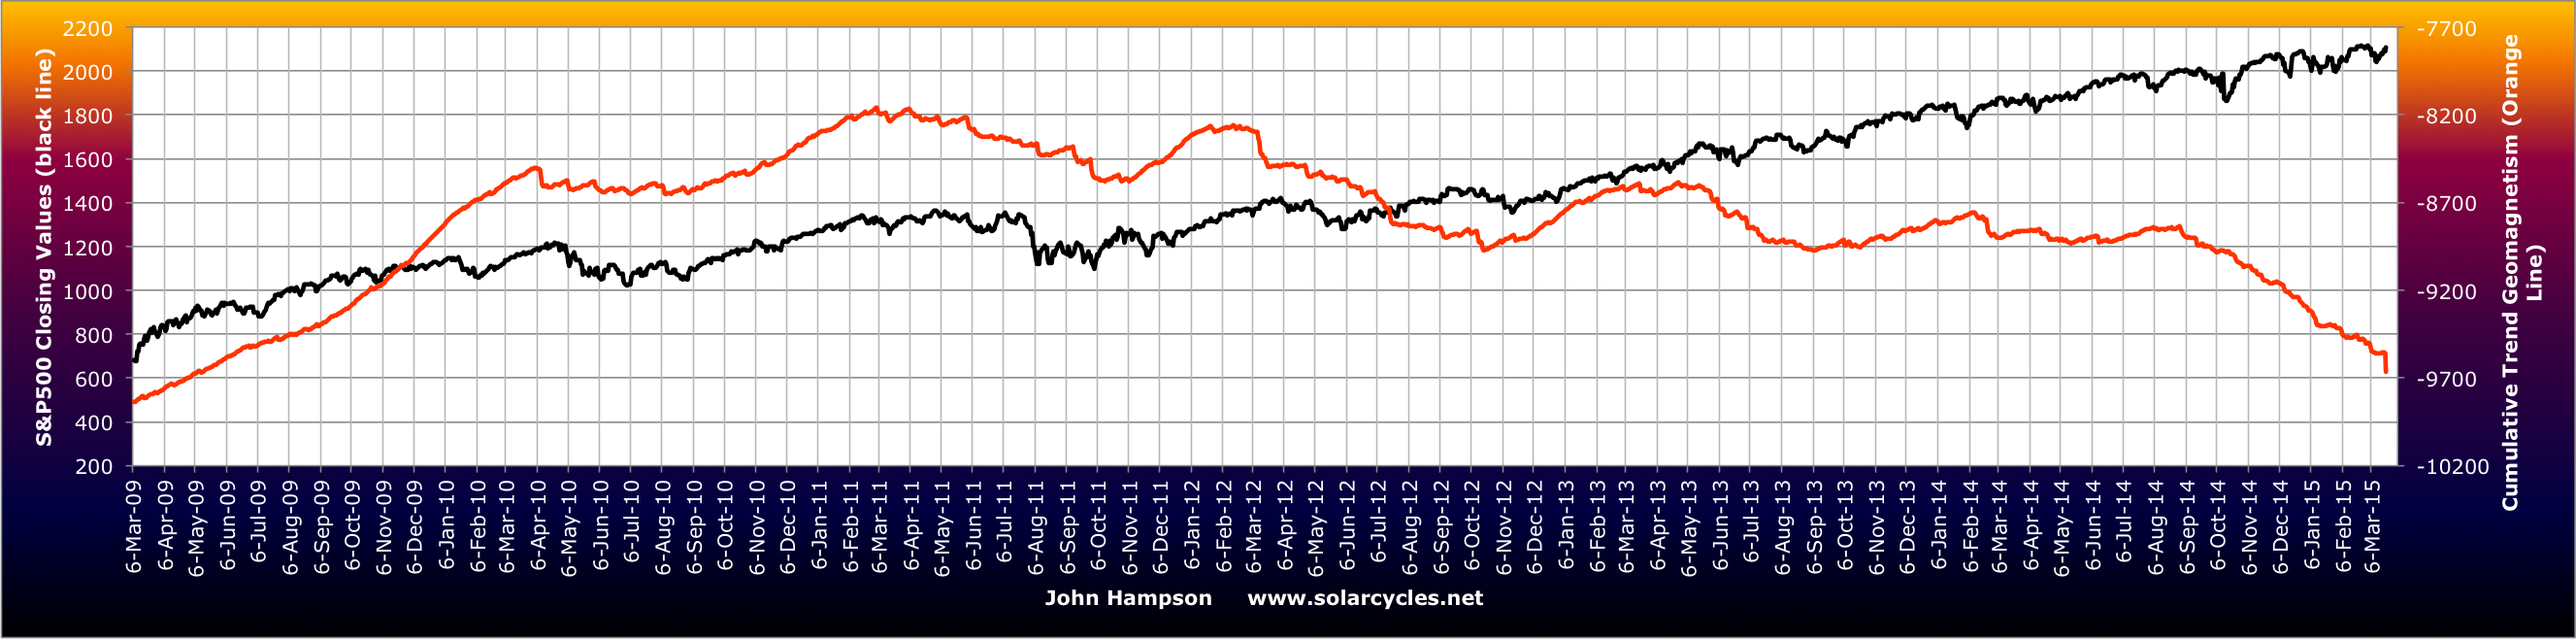
The TR-CRB commodities index has tracked the trend well. This is reality, whilst stocks are in a mania prone to a major reset.

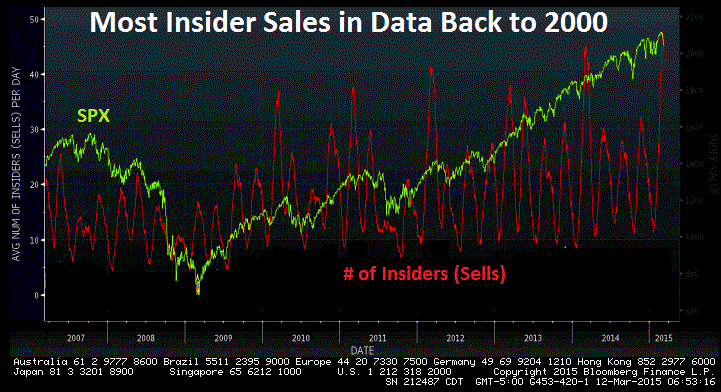
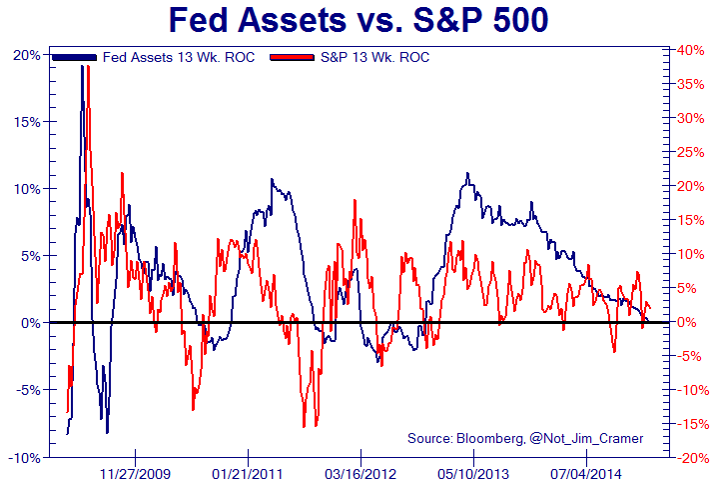
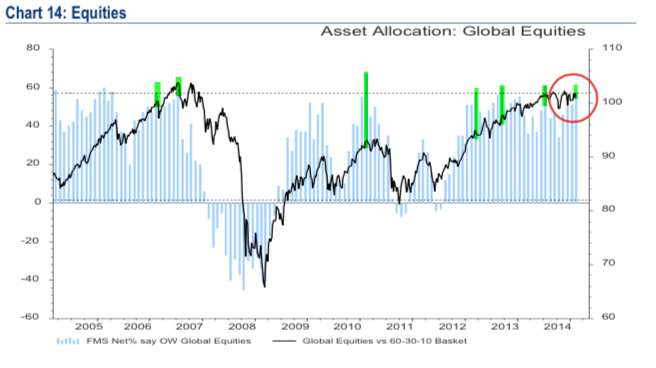
Back in 2000, the SP500 finally gave up its levitation on 1st September. We probably don’t want to focus too much on the timing of that lag, but instead note that we have the same comprehensive leading removal of supports: solar maximum peaked; geomagnetism intensified; divergent earnings and economic indicators; buybacks and combined central bank printing peaked; saturation in allocations, sentiment and valuations; commercials and hedgers short; money flows into bonds and dollar.
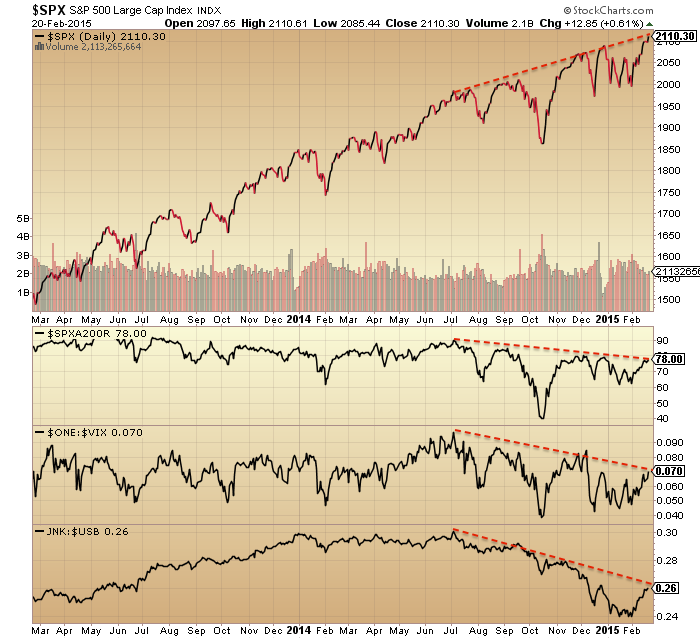
With hindsight we can look back on the first half of 2014 as too soon for a peak in the mania as the solar maximum wasn’t yet done, but with a host of warning flags present in allocations, sentiment, leverage, valuations and more. We can look back on the second half of 2014 and see a typical topping process in a whole range of indicators: negative divergences in breadth and volatility, declining forward earnings and leading indicators, a deflationary wave in other assets and economic data, all occurring whilst price continued to levitate. And, I believe, we can look back on Q1 2015 as the completion of the missing pieces of the puzzle: commercials go short, insiders press sell, geomagnetism ramps up, data surprises to the downside more than expected.

Q2 2015 then should look like this: economic data doesn’t improve, realisation that earnings and leading indicators are staying divergent, geomagnetism continues to pester and turn the tanker of sentiment, stocks start to decline and in turn recession models start to wake up.
A host of leading indicators for the stock market suggest equities are overdue the major reversal, and it’s hard to find ‘fuel’ for prices to continue to rise into mid-year given the all-round picture from indicators, namely saturation and divergences. I therefore have not given up on the March-April seasonal low: a sharp leg down from here to kick off the bear market. Let’s see how this week unfolds: we need to see the telling price reversal, and until then patience needs to be maintained.