

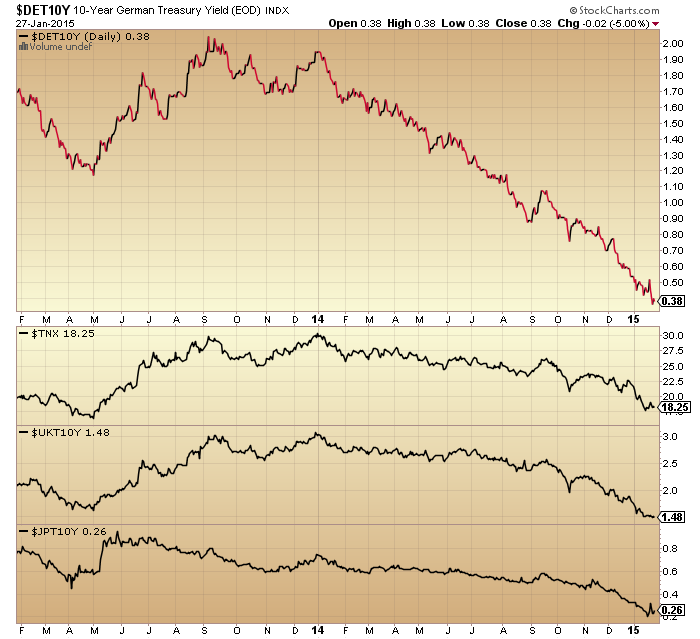
The big picture looks like this:
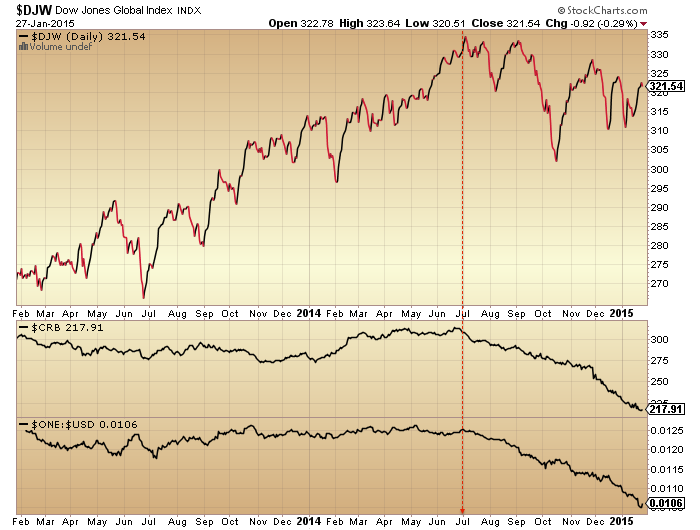
Source: Stockcharts
Global stocks, commodities and the world’s reserve currency turning in unison at the end of June 2014.
Extreme lop-sided positioning in the US dollar suggests a reversal should be close at hand. I expect gold to be a beneficiary.
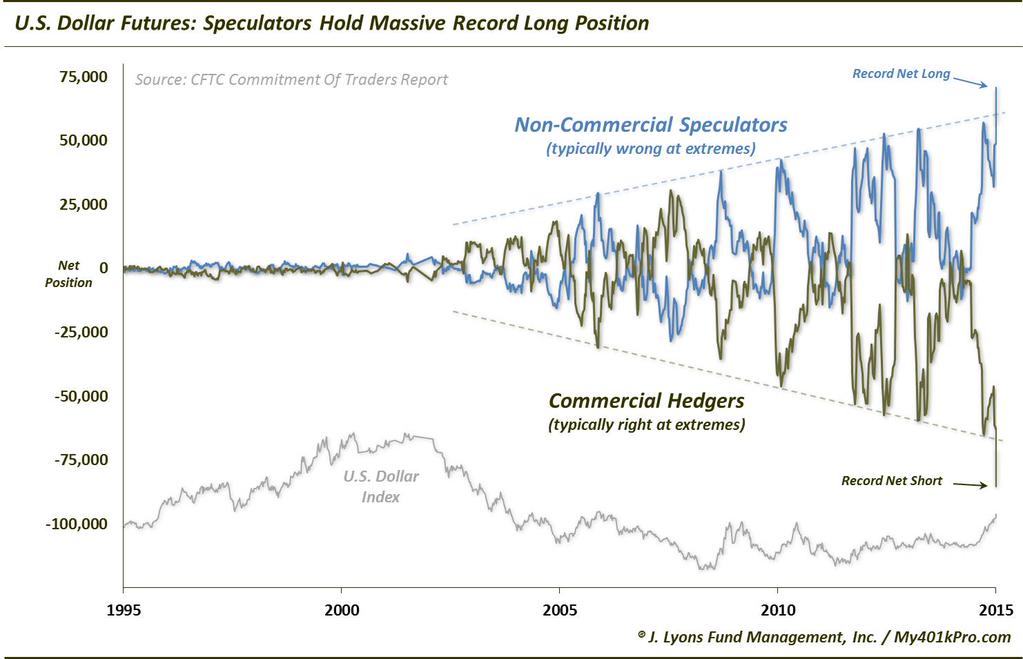
Source: J Lyons
Tying in with this, economic surprises have crossed fortunes in the US and Europe:
Source: Moneymovesmarkets
Therefore, the Euro should be due a bounce versus the Dollar.
US leading indicators remain mired negative.
Source: Dshort / ECRI
And so far, Q4 earnings have disappointed, as predicted by a rising dollar and falling oil. Here we can see the key turn down in earnings per share:
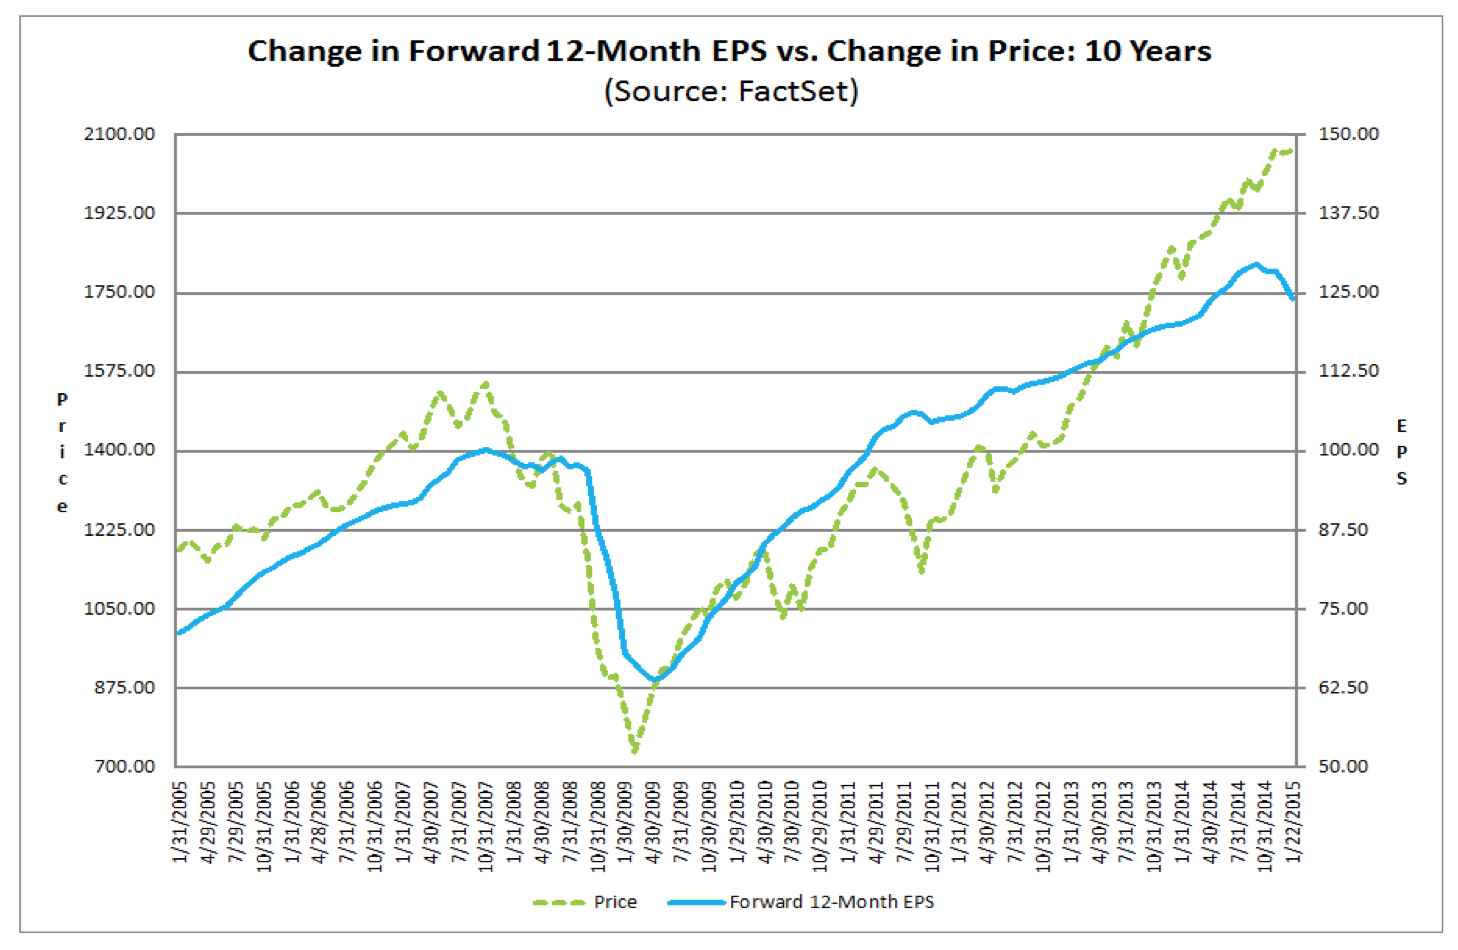 Source: Factset
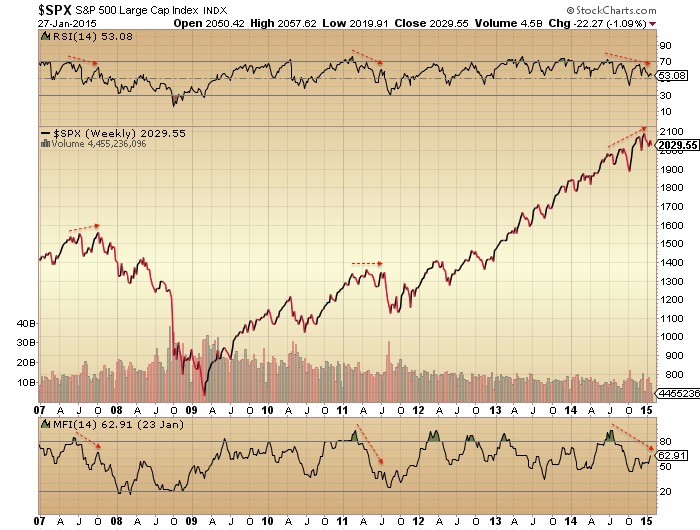
The SP500 looks on borrowed time since the end of June 2014, when we look behind price:
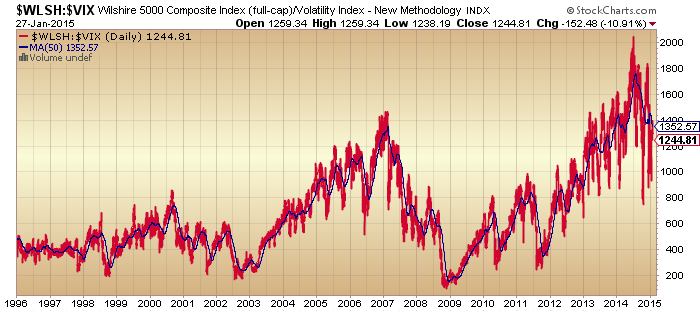
The stocks:volatility ratio also turned down at that time, and resembles key changes in 2000 and 2007:
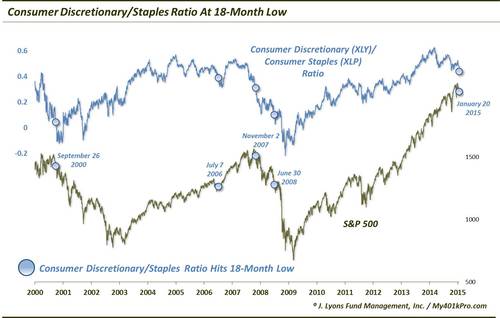
 The sector performance tale in 2015 is the same as 2014: defensives lead as they tend to post-peaks:
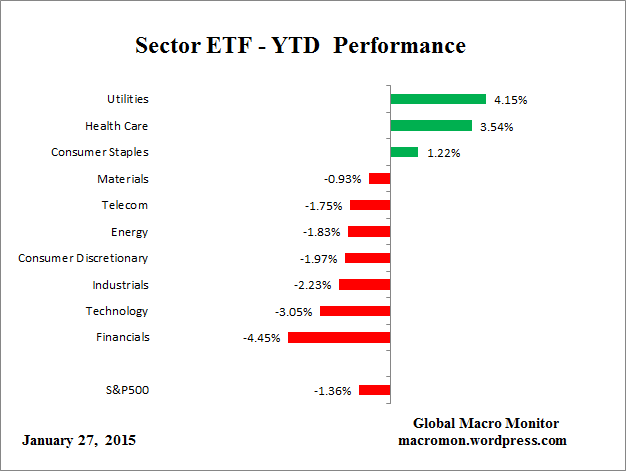
Source: Macromon
Source: J Lyons
Skew remains persistently high, warning of a potential big move in the markets:
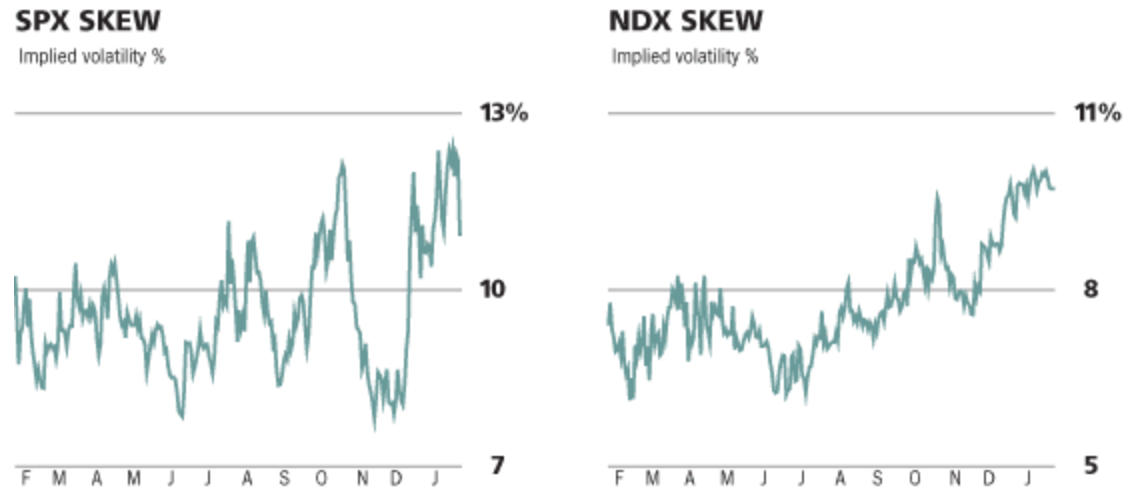
Source: Barrons
Money continues to pour into government bonds, with Swiss 10 year yields now amazingly paying holders a negative return:
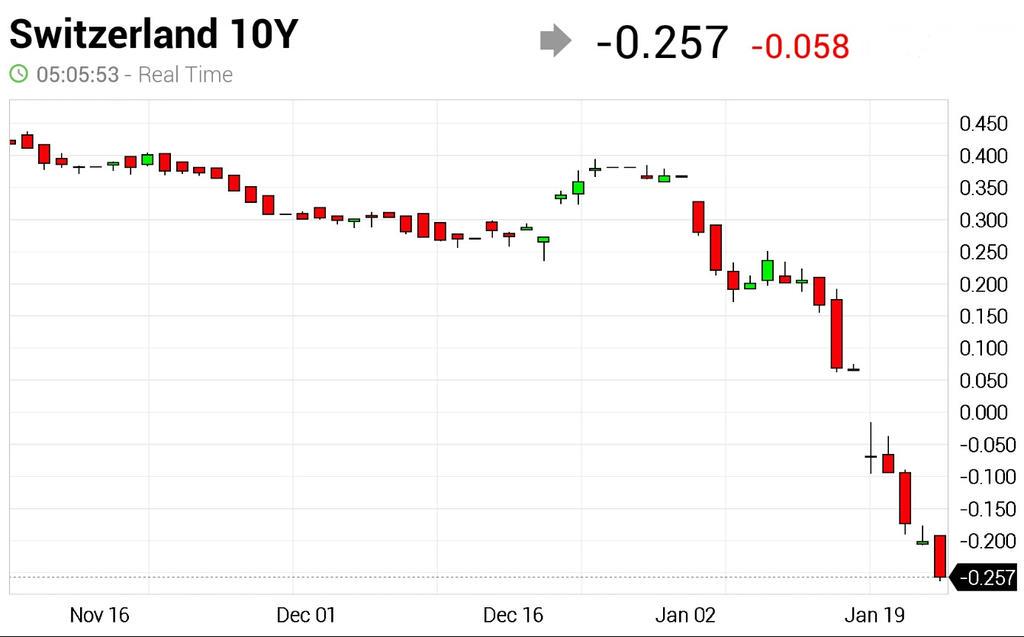
Source: SoberLook
The bullish development in equities is in Europe where various indices have broken upwards on the QE news, with Germany the leader. There is a 12 month divergence in breadth, which I would tie in to the bigger picture above which would suggest Europe may be experiencing a blow-off top.

Source: Indexindicators
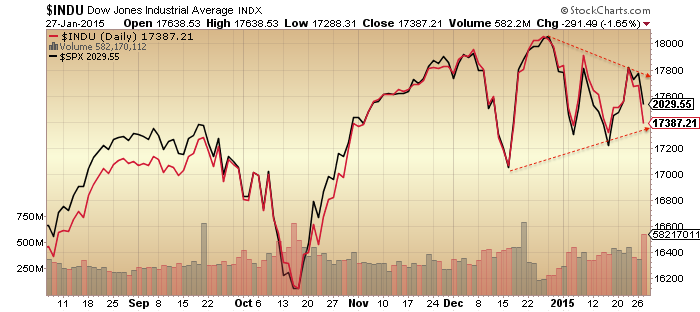
If that is not the case, then we should see risk-on firm up again globally, making repairs to the various asset and indicator downtrends that I present. As things stand though, the balance of evidence is still weighted to the global peak being in the past, and if my three key dates are correct, then US stocks should not exceed their December peaks, with European stocks shortly falling into line. Which way this triangle resolves will tell us the answer:

Thanks John. Good series of posts. Don’t rhese equilateral triangles tend to break in the direction of the prior move?
Thanks
Tim in Elliott Wave terms triangles appear just before the final wave in the direction of the prior move. Much as I hate to say it we are in the final stages of the triangle (may even have seen it’s final wave down Jan 27th) and therefore have one final UP wave to new ATHs.
The only consolation is that triangles are a VERY RARE occurrence and are known to morph into something else before the end. Let’s hope that happens because the markets are truly at unbelievably mad extremes. Unfortunately that’s also the point at which they get madder!!
Excellent John. You’re one of the few I know that can look at the bigger picture and then decipher what the ultimate consequences will likely be.
The USD is at absurd levels in terms of billish extreme and right throughout history this sort of extreme has resulted in violent reversals.
Investors have by and large ignored the fact that gold was rising with the USD which is likely a indicator of USD reversal being imminent.
AAPL has stunned the pre-market but let’s see what happens during real-time and I don’t just mean in todays session. It has to go on with whatever gains it takes today. Interestingly the gap will likely fill from yesterdays gap down.
And note that AAPL supplier Foxconn are scaling back on their workforce as they expect slower growth. The CEO says that revenue will decline due to slower global growth in smartphone sales numbers and also reduced price.
This qtr may have been the really standout qtr for AAPL. The may have gained market share but the overall market is expected to decline dramatically in 2015 along with prices.
Cheers
Just to add. I think there was far more technical and psychological damage done yesterday than many first realise.
The ECB decision from last week has not had the huge impact that many thought it may and the reality could be sinking in that there are far greater issues at hand such as the currency issue and negative rates which are actually stifling the global economy and not stimulating it.
When a new bull market starts, ie the $, it goes to all kind of extremes. All one hears is it’s way overbought, ahead of itself, crowded trade, etc.
Kent, no mate it is just not that.
The dollar move has been exceptional in both time and price. On top of that it is beginning to cause even greater distortions than were present just a few months ago in global markets. Distortions that are not sustainable.
Taking into acount the type and size of the move in percentage terms, the historic over bullish extremes and the likelihood that the distortions it is now creating are likely to contribute to a major event such as a substantial stock market decline and you have a recipe for a dramatic correction at in the dollar at the very least.
Central banks have just created far too many extremes in the global economy.
In 11 months from late 1980 to late 1981, the $ went from 85 to 115. This rally has only moved from 80 to 95 in the last 9 months. It continued much higher from there. So we are underperforming that bull mkt. However, you are correct, it will hurt earnings, cause bankruptcies, and many other problems.
We are not going to hang around at these levels imv.
Either we go lower or we head for new ATH on
the RUT, SPX and DOW – possibly in that order.
If the later happens the 2014 equity top premise
is dead and buried.
Repelled or new ATH, the heart of the battle is right now.
And before anyone calls me a permabull for the umpteenth
time (which is inaccurate) I cannot call the direction here.
Phil, I don’t think there are many here that actually see you as a perma-bull. In fact I know you are no more a PB than I am a perma-bear.
That said, I can’t be bullish when I look at the big picture. God knows I have tried to see the bullish side but haven’t for a long time.
It is funny though how I can look at yesterdays action and see bearishness in the daily index charts (and even AAPL’s chart, unless that reverses in the next few sessions right here and it had better or else), and others are seeing new all-time highs, whilst yet again I see nothing but bullish scenarios in the gold sector 🙂
That is what makes markets I guess.
Cheers
Oh and Phil….I thought this guy was smarter than his opening comments
http://finance.yahoo.com/news/everyone-scared-nobel-prize-winner-093614163.html
Barry,
Just as my time calculation only tell part of the whole story, so do the charts.
It could be an outside event causing the turmoil, not reflected -yet- in the charts.
It doesn’t hurt to be aware of a possible sell off looming into the not to distant future.
February is shaping up as the month this is the most likely time (say 4-17).
I will most certainly not trade this as it will happen for a fact.
So nothing wrong with being long, like you stated. But when things start looking shaky, you might take this info into account.
John, thanks for your posts. Hope you are doing alright these days.
http://www.marketwatch.com/story/too-late-were-already-in-a-bear-market-2015-01-28?dist=beforebell
Feels like the time to risk being too early than to late as a bear. AAPL is widely held and will not be able to repeat mania for another quarter. I see no other potential bull catalysts.
WT, AAPL already stated in their CC that the surging USD was creating headwind at the end of Q1 moving into the current qtr.
Their guidance was of course considerably lower for Q2
I spose they could jack it up higher by using all that cash for buybacks. But alot of insider selling tells me that this is not what they have planned for the money. I bet they buy some companies post crash.
Mate the irony IMO is that AAPL is one of the few stocks that actually represents value in this market even if earnings deline 20% from here. It’s a cash cow, but unfortunately for them they will get sucked down with any market sell off.
I think social media drives smart phone sales. This is a fad that will vanish as fast as it grew. I know I’m already sick of selfies.
Allan, thanks.
Athens market off 17% atm, unless I am misreading this.
Hi John and all.
John, thanks again – you’re a star!
For me the critical chart to keep an eye on is the US Citi Econ Surprise Index that John has once again kindly posted.
This succinctly demonstrates where the US investor is at a given moment in the extreme wall of fear to extreme headwind of optimism range.
As we all know this is a mean reverting chart.
Last year is a case in point: By the second week in April analysts were so bearish that they had built a large wall of fear for the markets to climb. The CESI remained in negative territory until the end of August- beginning Sept and by then the SP500 had added 14% climbing that wall of worry. It was only by Sept that a headwind of over optimism was there and the market was able to fall.
So we need to keep a close eye on this index in the coming weeks. It appears that analysts are quickly cutting their forecasts,demonstrated by the recent reversion to mean. If the market can hold as they do this, and it appears to be, then we will have a new wall to climb.
Will, are you referring to econ surprises or earnings forecasts? It seems your note fits with the latter.
Hi Peter;
I appreciate the cautious tone of your note, and believe me, any longs I have at this point come with me having one foot on the exit door threshold…
I’m not ~happy~ being long here, it’s just what charts are telling me at the moment… And gotta go with what I see….
Thanks again….
The PPT is fighting for their lives via the XLE.
Who said the media are bullish? Article that will make bulls smile and bears tremble with horror…or sheer excitement.
http://www.moneynews.com/MKTNewsIntl/stock-market-crash-warren-buffett-indicator/2014/10/03/id/598461/?dkt_nbr=ufos34vz&utm_source=taboola&utm_medium=referral
Barry, if you want to find out if your long in equities is any good, keep close eye on UVXY. Jan26 was a low (23.10) at a 2-month uptrending channel. Since then it has held and appears to be rounding up. If so then in next 7TD from Jan 26 could see it spike up +$10/$11 making Feb 4 as a possible high for VIX/UVXY and that obviously implies stocks sell off.
I mention this because the past two times recently on Dec 5 and Dec 24 this was the pattern it followed.
For your long to go up you need to have UVXY lose that $23 support and that goes against how I read that chart presently right now.. GL!
Thanks Steve…
I actually do check the VIX and TVIX every night (just two more of about 250+ charts, so not unaware of those products… I trade TVIX once in a while too, so very aware, actually…
And certainly can see a time when all those explode higher, just not thinking today – or tomorrow – is the day….
No worries… Have a plan if we go higher, and have a plan if we go lower…
Ultimately, it’s just another trade…. Just happens to be long at the moment…
We’ll see…. Thanks again…
Looking for weak Thursday (I am short SP500 SPXL) as price is slump and tomorrow is low tide and lunars are all weak. Friday our lunar icon is in Gemini which may mean a 2% day one way or the other. If I stay short Friday will look to cover if price starts ramping up. Summary:
Moon Phase: past New moon sweet spot
Declination: will be at north top on weekend, 2 weeks weakness to follow
Distance: apogee weakness on Feb 3.
Seasonals: really good until after first trade week February. Hence my reluctance to do any short without watching it.
Today was key decision day and bulls are losing it. Next days may become interesting as SPX 1970-1990 zone should finally break at fourth attempt, barring some kind of triangle that is another possibility at that stage.
If we get that final breakdown then SPX 1700 comes into play.
Gold also in correction but should not break to new lows.
Also, $/¥ pattern looks precipitously, someone really needs to push it up over 119, otherwise it will drop like a stone.
Gold/miners still acting mysterious. Still considered a commodity in deflation?
like ringo said
“It don’t come easy”
i suspect the coming rally in the miners is going to be so great that before it can really get started all weak, medium, and even dedicated believers will need to be shaken out.
the only ones left for the ride will be the truly die hard believers and the insane.
Like you and I, eh Specie? 🙂
VIX didn’t spike much relative to past days.
I mentioned earlier that this was the heart of the
battle and we were not going to hang around at
these levels, it was like watching two prize fighters
today.
I could not call the direction, well done to those short.
I think the best option was to wait until announcement and then just go with the flow. And flow goes down, seemingly.
If VIX climbs above 22 breaking that downsloping trend line we may face mini crash.
Oil is so weak, I thought last lows should be defended but they weren’t. Real panic in all assets may begin soon.
The last time the Dow was at this low level the SPX was around 1850.
Yes two totally different indexes but both US, but 7% difference is a big gap.
If SPX break below 1950′ then sub 1800 will arrive.
Bulls really got to get their act together.
Ps, another great trading day for those who plays both ways.
Well put, Aaron. Those who go both ways will profit on most the days.
The direction was not apparent on the FOMC release,
initial spike, then a tussle around
flatline before the plunge.
There still may be attempt to rescue markets and shake off bears tomorrow.
My concern is that European indexes like DAX and CAC still look like unfinished business to the upside.
Todays Naz daily bar is extremely interesting. Not only put in an outside reversal but filled the gap perfectly:
http://stockcharts.com/h-sc/ui?s=$COMPQ&p=D&b=5&g=0&id=p49444361558
ANDRE, Andre, great call, so far…I know this is early, premature, put so far so GOOD !!!!! Lets watch……Nicola
🙂
I’m very peeved with myself that I didn’t add to my TVIX position @ 2.75……..it was almost screaming out to “buy me”!
Added at near the close. I really do think the best play will be long volitility. I think it is going to be the huge play.
http://stockcharts.com/h-sc/ui?s=TVIX&p=D&b=5&g=0&id=p15871706927
In my view, Allan, long volatility will be the second best play. Carefully-chosen gold and silver junior mining stocks are going to go places few can imagine.
I can imagine them becoming totally worthless, of course after they rally 300 percent during 2015’s Venus Retrograde starting in June. The miners have had zero net returns over the last 30 years and the DJIA is up many many times. The gold is real money meme is fine however it ignors the cleverness of man who at this moment is probably inventing a way of extracting gold from sea floor mud. Fracking was unexpected and given the value of gold a fracking like game changing tech will inevitably arrive to deliver the gold as needed.
A provocative comment to be sure.
Full of nonsense though. http://www.bgmi.us/
Let’s wait a few years, until the BIG cycle in play since 1982 completes. We’ll compare notes then eh?
Well, it’s not always a good day for those of us that play it both ways – hahaha – but after looking through charts tonight, I’d have to say that 3 major themes seemed to be repeating….
1 – Wouldn’t say EVERY stock looks like a buy, but Energy sure looks due for a run to the upside here….
2 – Bonds – T-bonds, specifically, look ready to pull back….
and 3 – Gold and gold stocks look like they will continue to soften….
Not saying this is anything longer than a day or two, but just pointing out what I see…
Still long, and slightly ~less~ strong… hahaha
John,
Cross your fingers. The next few days are very key here. For the bulls you need to bounce this market starting tomorrow or you are in danger of a left translated trading cycle top that occurred on 12/29. If it is left translated then the trading cycle low lies ahead in time at much lower levels. 12/29 may also be a very left translated intermediate cycle top as well. Which implies after the trading cycle low ahead we get a bounce that fails and we go to much lower lows into the February-April time frame for an intermediate term low at much lower levels than today. I am short and have been since December 30th.
Full discloser I was short going into October. I was up 20% YTD. I covered at the bottom. Then I waited for last chance rally. Rolled my profits into a hero crash trade via options. Then the BOJ and ECB destroyed me. I am currently up 4 percent. Ended last year flat.
Bluestar, thanks for disclosing. What is a left translated trading cycle top?
Gary,
This does a good job of explaining it.
http://smartmoneytracker.blogspot.com/2011/06/left-translated-cycles-are-bad-news.html
March 16 , 2011, bottom + 1414 CD= 28 january 2015.
November 26, 2007 bottom + 2618 CD= january 29, 2015
August 25, 2010 bottom + 1618 CD= january 29, 2015.
May 22, 2013 top + 618 CD= january 30, 2015.
August 9, 2011 + 1272 CD= february 1, 2015.
On this morning’s drop, my trading system signaled to add the second 50% to the initial 50% long position… So at 2001 SPX, system is 100% long….
(it wasn’t actually a system signal, but a trading rule – add the second 50% layer on any move +/- 2.5% from the initial 50% entry price)
Anyway, I’m at 128% net long….
Not feeling happy about it, but following my system.. And admittedly it’s not done well the last 7-8 weeks….
LOTS of whip-sawing, to be sure…
And, Barry, where’s your stop loss?
Hi Gary;
When my system reverses to a “Short” signal….
Man, “crickets” here this morning….
Interesting….
Not sure how to read that, either way….but interesting…
I think you’re reading things incorrectly in terms of your last response. Curious – does your short signal turn if price drops a certain percentage?
Not a percentage, and there is no set “price” exit point
It would be a stop-and-reverse signal, based on a number of oscillators, trend signals, and HY bond trend signals, that I update every night…
It’s an EOD system, with any signal changes known the night before….
I often trade “around it” when I see something that doesn’t look right sometimes (for lack of a better phrase), but it’s normally a good beacon for me for where I should be regarding my actual positions….
Got it – thanks
Barry, you’re not the only one long here. The fibocluster I published suggest at least a short term low is due. I only dare to play this market with small positions though. Still bearish overall, but I can’t trade views.
Thanks, Peter… It’s hard to keep track of what other people are doing, sometimes…
Other than a few peeps that chirp up about their longs ~AFTER~ the market has had a big up day or run of days…. hahaha
And lots of people say the market should do this or that, on this day or that day, but you have nooooo idea how they’re trading it, or even if they have enough conviction of their thoughts TO actually put money on their thoughts….
Just thinking out loud here, but I wonder how a site/thread would go over if ALL you could post were actual trading positions….
Just tell me long or short, and what you’re trading, with entries and exits…
NO commentary allowed without that first….
Don’t tell me about the labor pains, just show me the baby… LOL
Difficult to say if the market is going anywhere today, very choppy PA, typical for post trend day ranges.
Today is low tide for January. Monthly low tide has marked exact bottom in December and October lows. Tomorrow is Gemini Moon which is often a large candle day. I see setup for large up move tomorrow and Monday, and then resumption of sell off.
So we throw away the possible bullish scenario of the second half of the Mercury Retrograde cycle Jan 21 – Feb 11? Jan 30 marks exactly the half way point. A significant astro combination supposedly occurs over weekend on Feb 1 but do not recall off top of my head.
In the meantime, quietly, USD/CHF is over 10% off the lows. The market doesn’t like negative interest rates, it doesn’t like gold either. I had a dream at night that the stock exchanges were closed for a week and when they opened, S&P was at 666. Definitely unreasonable dream.
You do know what the S&P bottomed at in March of 2009, don’t you? I’ll give you one guess.
Beta, you’re long? Or waiting for an entry point to get long?
Despite gold getting mugged today down over $30, I have to make a speculative bet on the gold miners. In my charting of GDX, after hitting an interim high from a surge from the Dec tax loss selling, it was supposed to chop in a $2 range for a couple of weeks before resuming another upleg (if it happens). Since the high last week was low $23’s that implies this $21 level or so should hold and it should bounce again in a chop before a possible breakout to a higher level such as $24.
See what happens …
Wow, someone decided that it is unacceptable for $/¥ to descend below 117.
gold down 32 when measured in us dollars
there were a couple of positive posts on the action in gold yesterday
the PTB must prevent as many as possible from considering anything but fiat
never underestimate their ability to frighten gold “investors”
eventually the only ones holding it will be the die hards and insane
I’ve been in cash since last Wednesday afternoon
as previously mentioned.
Short term market direction appears exceptionally
difficult to call currently(for me) – Gold is a good example today
with a sudden sharp decline without warning.
Volatility is back, that’s the easiest call
and it may pay to be cautious with position sizes
on the long, or short side.
Just an observation, but wanted to point out that HY bonds are actually higher now, than they were a month ago when SPX was in the 2080-2090 area…
I watch HYG, JNK, and HYLD during the day, and sometimes they offer some guidance during the day to show me what I expect to see when I go through charts that night..
However, the HY Index my systems actually track is the BofA/ML “H0A0” index…
Interestingly, that was actually UP a couple of points last night, in spite of yesterday’s stock market sell-off…
It’s actually up 1.26% from a few weeks ago, the last time SPX was at this same 2000 level….
Not saying the stock market HAS to go higher just based upon that, but I consider it a plus….
GL
I have found HYG,JNK and HYLD to be a noisy indicator since the crash in energy prices as a good percentage of the companies in these indexes are energy companies.
They absolutely are noisy, but not sure you can just discount them because of their Energy component, either…
Energy is a reasonably important part of the stock market too, right??
But not sure what else to watch as representative of HY – during the day – until I can get the final reading on the BofA index each day…
And I watch HYG and JNK primarily, as intra-day, HYLD has an even wilder mind of it’s own…
That should have read since Wednesday the 21th.
SPX March futures have perfect setup for inverse H/S with push to ATH in Feb at lows today at 1982. Markets still following my Bradley date inversion since late Oct with call for ATH 2070+ by Thanksgiving, then down late Dec to Mar-Apr. Jan 31 next turn date so appears to be a couple of days early.
If inverse pattern holds, next run up to SPX 2075+ should be followed by test of Dec lows at 1972 or lower. Then a rally to lower high, finally a test of Oct lows in Mar-Apr.
I like it!! Thanks!
arthurk – you may be right
but i have never seen a successful inverse H&S that occurs so quickly after establishing a lower bottom. In other words, looking for a IHS higher than but yet so close in time to the october low would be highly unusual
in my experience the best IHS patterns occur after long drawn out declines
Half-way to my goal…..
Allan (and I) get another chance at TVIX below $2.75…. 🙂
Maybe Barry? It held up extremely well and was all but even with the SPX down 13 pts and then in the final hour as the SPX shot to 20 it fell apart.
It looks like there could be another push higher in dollar short term but that will only hurt already hurting US companies.
AAPL are making $ but they sure as hell are losing on the currency front as are many others.
Barry,
I am long the Dow, and short gold as of today. I will exit both trades tomorrow. The reason you already know. I have a great collection of panic cycles, but learnt the hard way that it is foolish to assume I am able to pinpoint the exact date in advance. The Dow has it’s first hit on january 30, the Nasdaq 100 february 9-10.
It is highly uncommon though to have 3 different panic cycles hitting almost at the same time. That is what happens during february. Believe me, I have read some good analyses why we should go higher from here. Arthurk also thinks it’s up from here. Not disputing that. But the risk for me is way to high to be long after the weekend.
Thanks, Peter, and after looking through charts tonight, I’m half in full agreement with you… 🙂
I kept scrolling through chart after chart, and all could ask myself was, “why the hell are you long again??”
Seriously, I really need to lighten up on longs in the stock market…
Just didn’t like what I was seeing…
Gold, and bonds too, for that matter, still look to be good shorts….
Cash is a position too, right… 🙂
I am just reviewing charts again and not to ring any alarm bells but despite the positive action in USA equities and bearish drop in gold on Thursday, the potential exists for a massive two day panic reversal either a Fri/Mon or Mon/Tue combo.
FWIW potential target of $35 UVXY early next week and a potential +$35/$40 upside surge in gold is “possible”. If that happens then I assume SPX should hit around 1960 or in other words support holds but it dips just below the Dec 2014 low and might foreshadow a more sinister correction later in March. UVXY appears to mirror action of Dec 8/9 and Dec31/Jan2 (i.e. initial surge then a next day pullback) and then subsequent two days minimum continued surge in price.
Now this scenario might NOT play out but where I am getting the info from is my TA charting. I observe gold is retracing a symmetrical price action measured from the pivot middle point of Dec 4, 2014. The action from Oct 21 going backwards to Oct 6 ($1255 to $1185) mirrors what is happening from Jan 21 to Jan 29 (or 30th if lower low tomorrow) $1310 to about $1250. Gold needs to hold $1240 support for any near term bull scenario. Gold moved from $1185 to $1235 from Oct 6 to Sep 23 (moving back in time) or within two weeks with an initial $40 surge in the first two days.
The uptrend line connecting the tops from Sep 23, Oct 21, and Jan 21 project forward to a $1320-1325 price in about one weeks time. This should be a fairly strong and difficult resistance level to overcome. If this uptrend line happens to get broken upside by say mid-Feb then probability leans heavily towards gold moving another $75-$80 to about $1400 in one extra month by mid-Mar. Again $1240 support level needs to hold for this setup to even have a shot.
I might look like a complete fool if nothing even remotely close like this happens but the potential setup is there so just keep an open mind and also an open eye out for it!
I know where you are coming from Steve. The late buying was not convincing and the daily charts failed to reverse much of Wednesdays negatives.
Cheers
Steve T, no one is judging. We are all trying our own methods to predict market behaviour and yours is always very welcome analysis. Firstly it’s thorough and also it has shown to have worked more often than not in the past.
Thanks for sharing.
Very little doubt what the pattern is developing on the R2k. Just which way the diamond breaks?
http://stockcharts.com/h-sc/ui?s=$RUT&p=D&b=5&g=0&id=p59688166336
Europe in full blown deflation and negative rates will NOT fix it.
And remember what many of us discussed here last year when the BoJ made their now what I consider “obscene” decision……..the global deflationary spiral picked up speed. And then what does the idiotic ECB do?………….Compound it even further.
Euro area QE in itself will do nothing,
the hope is it will succeed in weakening
the Euro.
Yellen’s comments appeared to save the
day yesterday, that may not be a long lasting effect.
These are dangerous markets atm.
1 trillion euros to buy govvies at already record low yields will not make such a big difference…..imho
J
QE is actually now contributing to the deflationary spiral. Notice how the POO and base metals downside accelerated after Japans decision?
All the dips still getting bought…need a sustained fall to kick off the declines. I reckon dow needs to break 17,000 for some bigger selling to begin.
And it’s done it again. 100 point opening loss recovered within 15 mins!!!
jegersmart, that was my point re Eurozone QE,
it’s about currency weakening, yields are already
at record low levels.
Why does it seem like John is the one person here doing the least amount of sweating, lol?
Because we’re the only nuts trying to trade this range back and forth, like idiots… :-O
That said, not crazy about being long after looking through charts last night….
Have dialed it back a bit here with my longs as we got a “little” rally going this morning…
Grateful we didn’t open down 20 points this morning, but still, covered a few longs, now at 101% net long….
Biotech failed new high – Dax and Shanghai lower – clock is ticking
There is only so much bad much news stock Bulls can take – grexit, fx nightmares, eps down-grades, commodity slump etc – teetering on the cliff here
Some bad trend breaks in some financials the last couple of days – BAC, MS, MCO
The thing is……as you point out, all that the market has had thrown at it, and it’s down all of 3.3% from it’s highest close (basis SPX).
Believe me, I want to be the biggest bear out there, but I’ve just grown to “respect the bull” over the last few years….
And just not sold that this is the cliff quite yet…
Last 10 days in $/¥ reminds me of battle of Verdun – heavy losses with no benefits for both adversaries.
But SPX is much correlated to $/¥ and I believe SPX will finally break December lows on Monday or Tuesday. $/¥ will follow.
Bears need to see VIX above 22.
Gold may have already completed correction, but to early to tell.
117.35 line in the sand
Anyone who can call this short term must either be
gifted or lucky.
As I mentioned this morning current market
action looks dangerous, on either the bull or bear side
with these sudden whipsaw moves.
Be carful out there – classic line from Hill St Blues –
showing my age with that TV reference.
Sgt. Phil Esterhaus…. I can picture him right now… 🙂
Great series, to be sure….
And apparently, I am both gifted and NOT gifted….. LOL
I was just looking at my daily acct returns this week….
Day…….Net % P/L
Mon……. -0.84%
Tues…… +1.21%
Wed……. -1.00%
Thur……. +1.00%
Fri……….. -0.88% so far
…Net……. -0.51%
And yes, for Wed/Thurs combined, I netted a whopping minus $2…..
What a waste of time this is some times…. *big sigh*
But seriously, maybe if the trading week was just six days this week, I think I’d be okay…. hahaha
Your trend following system is not optimal in a volatile sideways to negative trading market because the entries/exits are not tight enough. In this market you need to enter/exit on counter trend moves and this is the antithesis of a trend following system.
I can save you some grief and inform you that this type of crazy volatile up and down market movement is likely to persist at least until mid-Mar and probably right up to late March. Reason is due to an astrological signature that ends around then.
Hi Steve;
I’m pretty sure everyone would agree that sideways chop is not the best place to use a trend-following system…
Other than that, I’m not sure what else to say….
Not saying it “couldn’t” play out like you describe, just not as confident in astrological signatures and what they predict as you are, I guess….
Thanks for your thoughts..
Hi Steve,
What is the astro signature that you believe is causing the volatility?
Most likely the Mercury retrograde period which ends february 11
I always find it interesting how many perspectives there are on the market.
some people talk about the volatility with day to day swings of 1% or more.
the way i perceive it is that hardly anything has happened in months
a NYSE close over 11,100 or under 10,100 would mean something
otherwise? Noise……
Specie it all comes down to individual’s time frames. For a day trader 5minutes to a couple of hours is plenty. For an investor looking for long term returns 5 years may be too short.
For example take today, the DJIA opened around 17400 and dropped to 17250 then rose back to 17400 and then has now fallen back towards 17250. That for a day trader is manna from heaven.
For the longer term investor the DJIA has hardly budged all day.
I think it’s just sideways market, but we all look at it through the prism of higher than usual volatility. It’s volatile and doesn’t move! 50 pips up, 70 pips down, 50 pips up…this is Friday’s ranging, but there used to be 10 pips impulses in May 2014 for example. It’s very good environment for day traders, hope this persists till at least mid March. On the other hand, this volatility is probably distorting stock charts and signals stop to pan out.
I have no idea if this volatiliy will make the markets move. Probably not. Only more chops, maybe bigger…
despe, agree some context is needed.
So now everybody has there smart phone, there health care, and there facebook account. Now what? Everything else is collapsing (except renewable energy, 3d manufacturing, and robots which are very early in disruption but not yet profitable). This global economy is running on vapors. I don’t think it can be Ponzied any higher.
Trillions of $ were dumped into a fossil fuel infrastructure, which the common man can now not afford to use.
trillions into the infrastructure, yes. But what do you mean that the common man cannot afford to use it? Certainly the common man in US does use it, other developed countries as well. So what do you mean by this?
Fossil fuel production, median working man income, and perhaps not coincidentally solar cycle activity seem to be peaking in unison when looked at from a long, long time scale.
Let’s not overlook the actual, real inflation rate for US consumers in 2014 a genuine 10%.
Yes alot of the true costs are hidden in debt escalation.
Gasoline in Texas is a very affordable $1.79/gal at the moment.
Cheap gas/no job or good job/spendy gas. Lose/lose.
First close above its 200dma since December 2012. It’s good to be long volitility.
http://stockcharts.com/h-sc/ui?s=TVIX&p=D&b=5&g=0&id=p78738795130
Somebody please tell me how in hell AMZN is worth $355 p/s?
They can’t and haven’t made a decent profit in 20 years and probably never will!
Pyramid scheme. Never meant to be profitable.
WT, your last few posts – I have no idea what they mean.
Allan, perhaps because they’re investing their cash flow back into the business and now, they’ve reached a point where those capital expenditures stop and all that cash falls to the bottom line. I’m not saying that’s what is happening here, because I haven’t examined the financial statements, but to summarily declare “they haven’t made a decent profit in 20 years” misses the entire point of what a true growth company is.
Gary, I understand what you are saying but mate c’mon, 20 years and up until the qtr before Q1 14 were making loses and only just managed to eek out a profit the last qtr.
The only thing that pushed them over the line was their premium subscription service and whilst there was a surge in new subscriptions I don’t see them as being able to build upon that enough to have a huge impact on future earnings in relation to their current share price.
I know they just recently invested in further infrastructure such as new warehouses and have expanded into other countries however their cash burn is phenomenal.
Not to mention that competition in online is increasing at a dramatic rate and their market share is no guarantee and in fact may be a certainty to shrink.
Their guidance was for sales to decline for next qtr so that will likely push them into a loss again.
Then we have the prospect of future global growth to consider further out, which if we go into a global recession could see them not make another quarterly profit for perhaps several years.
Mate there is no way that AMZN in my opinion is worth anywhere near $200 let alone being nearly double that.
At some point even a growth company has to prove it can turn a decent profit and return for outlaying your money and they have had 20 years to do that.
Cheers
Also Allan, consumer discretionary spending in Amazon’s big markets is only going one way over the next 10 years. Nail salons also not a good buy!
If a company can take its operating profits and reinvest them at a higher rate of return than its cost of capital (and what I can do myself if those profits were paid out), then I can’t argue with management. I think that’s what the market is telling you, i.e., it’s agreeing with Bezos’ strategy…so far.
Last week I said Tuesday would make the high with an inversion on Wednesday and Friday.
Wednesday gave a low- caused by the inversion and it went up into Thursday night for the Friday inversion. Friday was down.
So, not much to add.
For next week I have tidal low on Sunday and my gravity indicator gives Tuesday. So I expect a CIT Monday night CET,
After that it will go up into Tuesday night feb 10.
Remarkably, I see no inversions all week. Not entirely sure what that means but It could fit a smooth pattern that a retrace produces.
First next inversion Monday 9. So I expect a top on Friday, then down into Monday and the inversion pushing the high into Tuesday.
After that a deeper low around feb 18. As a reminder, my roadmap indicates early may- probably the 4th- as a first major low.
Cheers,
André
Andre’,
FWIW, coinciding with your “So I expect a top on Friday” Feb 6, there is a Sun-Jupiter opposition, which often correlates with CIT’s
SC
Steve;
I have seen that one. This time it will give a w3/C top.
Thanks.
Does Delta or Hurst or Arch Crawford have any CIT’s in February??
Don’t know; use other techniques.
Some clarification.
Next week will be an absorption week. We have seen the first leg down on our way to the 2017 low. So some people start to get doubts; is the rally over?
But many people just can’t believe this market can go down, with the fed at the wheel. All 2014 they learned that their BTFD strategy was flawless. They all have to get burned before reality sets in. As there are so many- even on this blog-, this will take more than a week. But when the last bull throws his money into the abyss, things get ugly very fast.
I think we all need to prepare for a mini flash crash that will take the second half of February. I see a deep low march 4/5. This will be a third leg down. Then a w4 retrace in march/April and finally an extended 5 into early may.
This is not investment advice ;-). But maybe this weekend is nice for a sanity check.
Cheers,
André
A number of traders have stated how excellent a trading environment
recent action has been for those who trade both ways..Unfortunately they have shown no examples… leaving other traders wondering what they saw…. I have been showing the 886 algo publicly since 2006 and have shown it here at this blog a number of times,,,,here are the trades from Thursday and Friday where experienced again used it as a low risk entry,,,
http://stockcharts.com/h-sc/ui?s=TNA&p=5&yr=0&mn=0&dy=7&id=p76589700178&a=326441308&r=1422704192650&cmd=print
http://stockcharts.com/h-sc/ui?s=DIA&p=5&yr=0&mn=0&dy=4&id=p28954423601&a=326440397&r=1422705384726&cmd=print
Slater9, please can you tell me where I can read up on the 886 algo? Thx.
the” lightning trade” is another trader’s and has been in the public domain for 20 years….. here is how it set up before the newss in BABA
http://stockcharts.com/h-sc/ui?s=BABA&p=60&yr=0&mn=6&dy=12&id=p57475384506&a=387208293&r=1422705563947&cmd=print
and here is the exact trigger as shown years ago
http://stockcharts.com/h-sc/ui?s=BABA&p=60&yr=0&mn=1&dy=12&id=p20110196383&a=387296262&r=1422705824652&cmd=print
and for those day trading, blue arrow shows where, blue arrow shows where
lightning trade triggered yesterday in FAS
http://stockcharts.com/h-sc/ui?s=FAS&p=5&yr=0&mn=0&dy=2&id=p97404287085&a=326440957&r=1422706660446&cmd=print
Good to have you back, slater9
Monday will be interesting, see Merkel’s
reported comments today.
However Greece is a sideshow within the bigger picture.
US earnings and guidance now appears to be weighing on
markets.
MFST has seen nearly 14% hacked from it’s market cap in
just 5 days.
This is with an ongoing $40 buy back programme.
My longer term is that theUS earnings cycle
is the key to unlocking the next bear market.
So it is no surprise that this increasing volatility is in
the context of weakening guidance.
There may be just enough life left in US earnings to propel
markets to fresh ATH, however it’s increasingly looking as
if we are on borrowed time.
I would only alter that view if mean revisions to US
earnings began to trend upwards, which looks unlikely.
I agree with your comments about earnings, Phil. And John has pointed this out several times.
Back in the day ( late 90’s) I was a member of a (Yahoo?) discussion group called Astrofinance. Doing a search was unsuccessful so I was wondering if I have overlooked it via some user error? Tks for any feedback.
Hi Eclectic,
Perhaps this?
Astronomy – Astrology – AstroFinance
Restricted Group, 1241 members
https://groups.yahoo.com/neo/groups/Time-Price-Research-III/info
Otherwise, this might help finding what you are looking for:
http://www.searchengineshowdown.com/others/archive.shtml
Hi Peter, I really appreciate your response. The site you reference is connected to Time-Price-Research; so it would appear that the old group of which I was a member is now defunct. Shame that. Again, many thanks.
I believe it was Allan who talked about an outside reversal coming in Jan. Nov was a relatively short line. Dec was longer with a higher high and a lower low. Then, Jan was very similar to Nov. That is a top formation. It is also a possible setup for a gap opening down which would be very bearish.
12/29/2014 is still the all time high so far for the S&P in this cycle. Additionally we have had two down months in a row. We have not had that since Apr/May of 2012. Even some bulls I know are respecting that fact.
This is for Slater9, who teaches me valuable lessons (“Unfortunately they have shown no examples, leaving other traders wondering what they saw”). And also for Specie, who obvious doesn’t recognize the set up for crash-patterns and is unaware of time-relations, calling what is happening now just ‘noise’. Stunning.
This excercice only takes a few minutes of your time and its easy.
S&P 500: Start with the May 28, 1996 top en count 633 trading days forward to the high december 8, 1998.
Then multiplay 633 with 1.44. The outcome x 1.44. The outcome x 1.44. After you’ve done this, split the time-zones also in halves and see on your chart how all the points in time relate to significant turning points, sometimes accurate to the day, other times a bit off.
Peter, thanks for your thoughts on this. I agree with you that we have the set up for and will probably get the biggest decline the markets have ever experienced in history. I’m just saying that it hasn’t happened yet. The PTB may be able to delay it even longer. I’m just waiting patiently 20% short individual stocks, 20% short indexes, 20% small gold & silver stocks, 20% physical gold & silver and 20% cash equivalents and actual cash.
a little more….traders may have wondered what would have trader 9 looking for a short term day trade reversal in TNA on Thursday….note how price had traded to the lower target line of the downsloping set.. once there price will do one of 3 things.. reverse, coil , or accelerate… THE ONLY THING that would have me expect a revesal is if a predefined trade setup alternately called algo’s triggered as it did in this case…
http://stockcharts.com/h-sc/ui?s=TNA&p=5&yr=0&mn=0&dy=7&id=p76589700178&a=326441308&r=1422796338336&cmd=print
Once had a lengthy discussion with a trader who’s friend created the vix products and is one of the biggest traders in them.He said” Always remember that much of the computer driven trading is linked to moving the vxx where the big traders want it to go… ” Thus when I am index trading I also check where the vxx is using the same tools… note how at the turn in the indexes the vxx had traded exactly to its target line….
http://stockcharts.com/h-sc/ui?s=VXX&p=5&yr=0&mn=0&dy=15&id=p20387586311&a=347142822&r=1422797930807&cmd=print
What keeps most of us fascinated by markets is
the lack of certainty on direction (short term).
However sure we are there are no guarantees on
exact market timing.
Risks appear to be building on the downside,
however I do not discount one more big push higher
before this bull market finally rolls over and dies.
Looking forward to John’s next update.
Phil your previous point on earnings being the key to a bear market is spot on imo.
Problem for bears is the price of oil. Both companies and consumer is benefiting from a crash in the price of oil. This imo will boost earnings for corporates as they will not only save on manufacturing and transportation cost but also increased dales due to more money in the consuners pocket.
We have a monthly bearish cross on the MACD so its something that is in favour of the bears. But given the above the armegeddon scenarios that bears are waiting for wont materise.
Duncan
So many investors fail to see that a lower oil price is devastating for the global economy, as it leads to a dollar shortage.
As for households, they don’t have any more money in their pockets, they have exactly the same, or less if they’re working in the oil industry. Some households will save what they would have spent on fuel, or pay down some debt. Net its all bad for the global economy.
Not to mention reduced revenue for oil producers, reduced spending by oil majors, and financial contagion caused by the dollar squeeze. The Saudis knew exactly what they were doing bringing the price down.
Liquidity :)…..drying up faster than a North sea oil well.
KO
http://stockcharts.com/h-sc/ui?s=KO&p=60&yr=0&mn=1&dy=0&id=p54146165151&a=339821738&r=1422798544722&cmd=print
Am primarily a short term trader interested in capturing specific chunks of price. Occasionally will take a long term put or call position… here is longer term trade in CAT that used the tools to take a trade totally in synch with John’s work.. Medianline traders are always looking for a”test and retest ” trade signal on longer term charts… then they dial down in time frame to get an entry thatoffers as little risk as possible…big picture…
http://stockcharts.com/h-sc/ui?s=CAT&p=W&yr=7&mn=1&dy=0&id=p66964782652&a=382323955&r=1422804956880&cmd=print
traders then waited for the ”test and retest on the 60 min to get entry
note too the recent abcd382/447 in place before price tanked once again
http://stockcharts.com/h-sc/ui?s=CAT&p=60&yr=0&mn=7&dy=0&id=p02443819836&a=338094160&r=1422805763168&cmd=print
Duncan in terms of the US that needs to
be offset against the stronger $ for US multinationals.
Backend of Q2/Q3 2015 was my best guess/estimate
for the peak in the cycle as mentioned last year.
Very interesting few weeks in prospect.
It’s all about deflation. LIQUIDITY is the problem. That’s all that matters and I said it to Nicolas last year.
Central Banks won’t be able to provide enough liquidity to stop the system crashing.
The SNB decision two weeks ao was the first trigger, now we have Greece. It may take a little bit longer before we see the first really big cracks appear, but they are beginning to open up.
Brilliant opportunity for bears right now. Breaking December lows is at hand. So they must not screw it. Otherwise mother of short covering rallies will occur.
VIX must see 22 level and higher.
Biotech break-down line around 3310 rising 15 points a day. Sector needs to continue to rally fast.
Blackstone (BX) failed at IPO day high of $38 back from 2007.
looks like Biotech broke the line
Things should accelerate now
$/Y has active pattern target of 115.6. No reason to take off shorts till 108.5 or the upper side of the wedge break out.
$/Y and ES different by 1.5% – lot of catch up for FX here
The PTB are obviously watching that one too. 70 pts off the low
it will be THE indicator – when it happens
$CPC 100 SMA pointing to the sky and in an elevated ratio in similar territory as the financial crisis time. This is indicative of a lot of fear not complacency as stated by the bears.
To anyone interested, Longs in my actual trading positions has just been scaled back just now to a net 11% long….
Trading system is still 100% long, I’m just scaling back a considerable amount of open risk for now…..
ES declining triangle pattern targets 1850 which tallies with 108 in $/Y
Up we go! By my calculations the volatility is highest since 2011’s correction, but the market doesn’t move much. Tomorrow may be an up Tuesday, I mean up and down and up Tuesday, we don’t get one direction days these days 🙂
That’s a great day for bulls as we were nearing
some key levels which if broken could have opened
significant downside.
Tomorrow Full Moon(weak day before and days after). Friday apogee(weak day before and three days after). Saturday equatorial crossing of moon to south(weak once Saturday is over).
Got stopped out of a speculative long this morning for minimal loss. First week of Feb. is good seasonally, esp. after a down January. Will go long again with tight stop tomorrow if price supportive. According to Lunar Chord, next Monday to Thursday should be prime shorting opportunity, the only positive is full moon will be over and Mercury yet to have it’s thrice annual rally.
Betafish is this your new ‘handle’? Your post sounds very similar.
Yes, I have changed my nom de plume to better reflect my interest in lunar effects on the market.
Nice I like it.
It would seem like bears screwed it up but I am expecting yet another attack of SPX 1970-1990 support zone, possibly tomorrow. And when it breaks we should expect some panic. There is tremendous number of protective sell stops below that level.
knowing the exact level before trading begins for the day where two important groups of traders( the medianline traders and the pivot point traders) will look to SIMULTANEOUSLY exit and look to reverse is often a powerful heads up…. as it was today….
http://stockcharts.com/h-sc/ui?s=TNA&p=60&yr=0&mn=0&dy=15&id=p24945189586&a=340670030&listNum=12
this is classic textbook stuff and is a good teaching example
Medianline traders call the coming together of lines from upsloping and downsloping sets X- marks the spot and is a favorite price target to exit trade .
When price turns and a new set is drawn a return then another return to lower line is called ”TEST AND RETEST”…a favorite trade is to buy the retest, place stop at test, and shoot for the next line or better yet an X- marks the spot… and so it goes
http://stockcharts.com/h-sc/ui?s=GS&p=5&yr=0&mn=0&dy=4&id=p40057771325&a=337904528&r=1422924753299&cmd=print
slater9, I’m not sure whether you saw my earlier request for info on where I could read up on the 886 algo. Please would you be able to provide me with that info. Thx.
google slate pile
there I discussed many tools
the setup I trade most often is the INTC example on page3
honor joed’s words at the start of file
remember how above I spoke of the importance of watching the vix products
that is where the algo triggered yesterday
http://stockcharts.com/h-sc/ui?s=XIV&p=5&yr=0&mn=0&dy=5&id=p41886184851&a=338178959&r=1422965758212&cmd=print
slater9, thanks very much. There is definitely a lot to take in here so I’ll go through it slowly. I’ll heed joed’s words.
slater9, are you Ok to answer some basic questions regarding .886 algo? I’ve been going through your charts but have a couple of basic ones.
Now thats a COOL use of that indicator.
Thanks.
Aus$/Yen trying to break the uptrend from 2009 – could be the final catalyst
http://www.barchart.com/chart.php?sym=AUDJPY&t=BAR&size=M&v=0&g=1&p=MO&d=X&qb=1&style=technical&template=
“For next week I have tidal low on Sunday and my gravity indicator gives Tuesday. So I expect a CIT Monday night CET,
After that it will go up into Tuesday night feb 10.”
Don’t know anybody read this, but I wrote it Saturday. Thought it might be a good idea to show it again.
Just entertainment of course.
I read it and was listening to what your call was. Thanks Andre. Have a big fibbo pivot 2.10 as well.
Nadeem Walayat : volatile trading range may last till July
http://www.marketoracle.co.uk/Article49270.html
Decisive new highs on the DAX.
US futures building on yesterday’s gains atm.
DJI closed over 300 points higher than the
intra-day low, that’s a powerful move.
Dax clearly hasn’t topped and it could drag other indices higher with it. I would be very surprised to see a new high in the Dow though. Have a short on the FTSE which is doing pretty awefully now…
We are at around the level where the UKX
hits a wall and falls back from.
However looking at the DAX price action the UKX
may FINALLY push through the 7k level.
Would tend to agree re US equities making new highs,
looks a big challenge, however how many saw the DAX
at just under 11k, just a couple of weeks ago that looked
highly improbable.
its just an overreaction to ECB QE, Dax is almost as overvalued as the US indices.
Australia throws another log into the global deflation fire today, South Korea have no option now but to follow. All the while it gets harder and harder for US companies on the international stage.
And if anyone thought the US were not oing o at the vety least bounce of this level take a long hard look at the daily chart of the last 3 years…….nuff said.
Back up to the 50 dma ‘s for US indices before reality sinks in that nothing changed in the last two days and things, if anything, are a little worse.
Simple point and figure charts provide useful support and resistance levels for various markets. For instance, for the FTSE, the 6850 level has been a brick wall dating back to 2013. The DAX has obviously broken out. The Russell 2000 has struggled at the 1210 price going back to Jan 2014.
For support, 1990 is the key level for the SP500, 8600 for the DJ Transports, etc.
Dax working on wedge overthrow as point E in rising wedge from the 2011 lows – October 14 was an under throw. I would not call this a break-out.
$ turning over here – taking equities down with it
$ index breaking through 94 targets 92 for starters – Aus$/Yen will be the big one to watch for the carry trade unwind. Held for now last night but would expect it to break in the next attempt. Yen and Swissie the beneficiaries as risk off fx.
DAX broke out from an IH&S patter. Will Russell 2000 do the same?
Allan, valid observations.
I think bears would have been in a much stronger
position with another weak US close yesterday.
Buyers supported prices around key levels and it’s
going to take a lot to force this back down again
in the short term.
Crude manages a bounce after its most horrendous decline in history and everyone is talking bottom??………that’s not how bottoms are made…at least how I remember them.
I remember oil bottoms tend to be V shape.
The point to remember is one’s time frame. Patience if one wants to be a long term speculator. It will come. Ignore crystal balls.
I was buying STOXX5 0 like crazy when it was at 2,500 in Sept 2012 when George Friedman said that the German had no option (but to bail out) .
I was buying “OIL” (ETN–S&P GSCI Crude Oil) like crazy last week. Who want to join me? based on my lucky track record.. Lol.
Looks like it. Bears seem utterly powerless in these market conditions. Hoping for a big sell off today but might be asking too much!
$NYADV is doing its higher high for the past few days indicating internal improvement for the bull case. A close above 2,600 would implicate a a short term bottom. Can it do it? or a crash now or is around the corner?
On the contrary Krish. There are some very worrying signs developing for the bulls early on. Not least of which this:
http://stockcharts.com/h-sc/ui?s=$COMPQ&p=D&b=5&g=0&id=p31864482464
And this:
http://stockcharts.com/h-sc/ui?s=TVIX&p=D&b=5&g=0&id=p60648438955
HUI dips being bought today, now just turned green. 250 within weeks.Maybe.
Covered the last of my UPRO just now….
Sitting on a 9% net Short position ATM, will probably be about 20% net short at the close….
Trading system is still 100% long, so I’m probably going to Trader Hell at some point for not following my own system….. :-O
You were short UPRO? Ouch.
Ummmmm………no….
Not sure how you assumed I was short UPRO, but yet, you did…. *big sigh*
I didn’t assume. You said “covered”.
Liquidated…..Covered…..Got out of…..
Whatever….
misdirection and obfuscation
all indexes green = bulls in charge
oops…….. biotech -3%
that is where the end of the bull move will be realized
watch it closely – the last 6 daily candles are amazing
May be sector rotation? Bulls in charge but not firmly..not yet.
My Lunar Chord is bearish with three negatives: Full Moon, Falling Declination, Rising Distance.
Planets: Mercury retro last half is mega bullish (last few years)
Seasonals: Bullish (down month first week snap back rally)
Price: Setup second up day after big green candle.
Going long with 2 % stop at mid day Tuesday.
Wow!! VotM. That’s a big call after a 400 point rally on the DJIA from the bottom. Surely it must be nearing the end rather than the beginning?
As a matter of interest why weren’t you long for the ‘Snap Back’ rally?
I have been correlating your work with the market action and that was one of the things I was expecting to happen and IT DID!!
I am long based upon mercury retrograde, seasonals, and price action. Will keep a tight stop though as Lunar Chord is pointing down.
Well so far it’s working out great. Hope you scale your stops up to make a profit. G’Luck and very good call.
Biotech broke uptrend. FX turning over to down-trend in $. Coincidence?
trend line from 2011/2012 is just fine…
that trend line is at 2200
next important trend line I see at 2880
Nicolas is the ghost of the “turkey”…Mr. Partridge.
Couldn’t wait….
38% net short now on this pop to new highs….
We’ll consider the 1st layer done….
Still haven’t given up on TVIX at $2.75…. 😉
That is about 600 points on the DJI
off yesterday’s intra-day low.
What a great rally…. Love this!!
On tap next: Nicolas coming out of his foxhole to give you his analysis of CB buying and clear skies dead ahead…. 😉
Hi Barry and all ! Yes, I am very happy with the market action. I expected a big rally with the announcement of the huge ECB buying. The ECB will buy over a trillion dollars within the next 18 months. So, the DAX is at the highs, I am not surprised. I hate to say I told you so, but you must recognise that i’ve been spot on again.
I see blue skies ahead for the stock market. There’s enough printing between the ECB, the Bank of Japan and the bank of China to sustain this market. And don’t forget that rates are being cut in many countries.
thank you
Oh no…. Thank ~you~…. 😉
Don’t feed the troll please.
All that matters now is resistance at SPX 2065. If we break above then there is free ride to 2200. If not, then December lows will be violated soon. And bears return with vengeance. It becomes battle of Verdun for both sides…
Post Gilead results Biotech has broken trend and can drop 500 points from here. Should be important for general risk taking behavior such as margin debt.
the other important marker is 117.8 in $/y which has held back bullish advances of late. Energy and precious metals flapping around like jojos in the background.
1982 redux. What if this year is the beginning of a 15 year bull market in stocks that will result in prices going several fold higher from here. 1982 high unemployment and Charlie Daniel’s Band was singing “America is Going to Do It Again”. Most everyone was gloomy about the prospects for the future.
Today: energy is getting cheaper, electronics are faster and cheaper each year, communications are getting better and more efficient, global commerce is increasing. Of course, the companies that are in the Dow Jones may change rapidly with old economy stocks being replaced with newer, just like Xerox and Polaroid were replaced.
Many reasons to doubt this: companies earnings flat (new companies, new earnings), workers pay flat (new minimum wages), mountain of debt (debt jubilee).
For every reason there is a counter so I guess price and time will have to play out.
My reason for saying this is there seems to be a 29.5 year cycle in market 15 years up, 15 years flat. So 82 to 97 up, 98 to 2012 flat, 2012 to 2027 up?
Valley – I have this move from 667 as wave 1 up which should complete near 2400 followed by a wave 2 down which should take us back near 1600 or so. Then we see a real bull market.
It’s more like an 18 year cycle, 82 to 2000, and we’ll go down for at least 2 years to 2017-18 to complete this current cycle. We don’t escape this debt overhang that easily I’m afraid.
up into 2032
Thanks all, new post