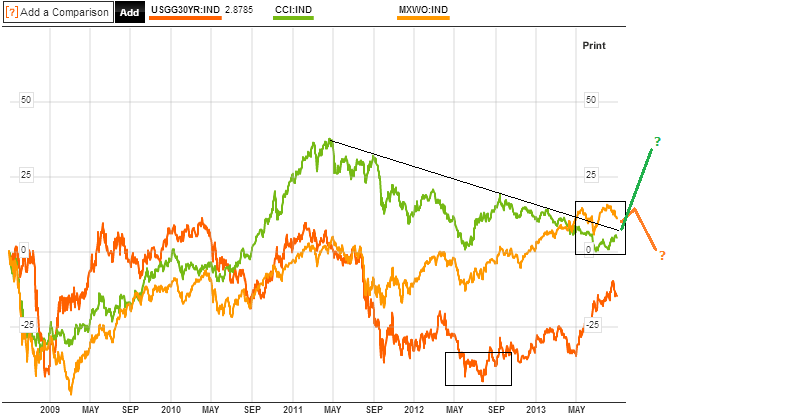
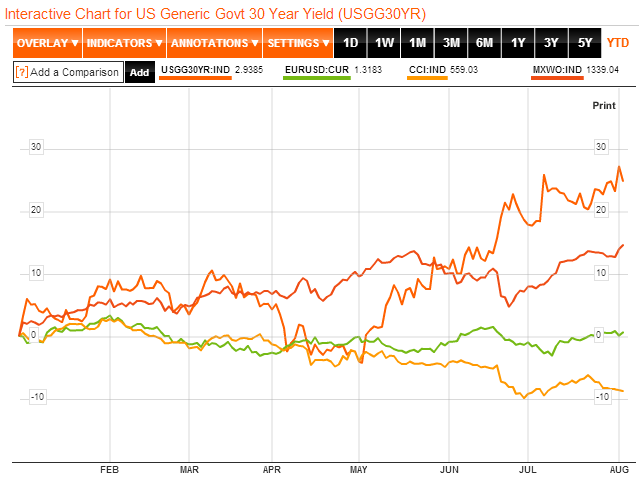
Is this a cyclical top in equities, the end of the bull market since 2009? If it is, then by the normal topping process, bonds should have topped, stocks should be making a topping range over several months, and commodities should take over and top last, if we are to comply with historic norms. On the below chart the CCI commodities index is in green, the MSCI world stock index in orange and 30 year treasury yields in red.
 Source: Bloomberg
Treasuries look like they topped in mid-2012 (yields inverted), and if equities are topping out then I have extrapolated how I see things should unfold. A completion of the topping range for equities, with at least one more rally up, and that rally being weighted towards late cyclicals, such as energy producers and basic materials companies, as commodities themselves outperform, to ultimately make their top as the economy tips over.
The next chart shows a longer term picture of the CRB commodities index versus the SP500. I have highlighted the last two cyclical tops, showing the multi-month topping price ranges in boxes and the lagged commodities peak in both cases shown by the lines. We potentially have the first half of a topping process on equities now, evidence for which I will detail next, and we see the commodities index tentatively turning up.

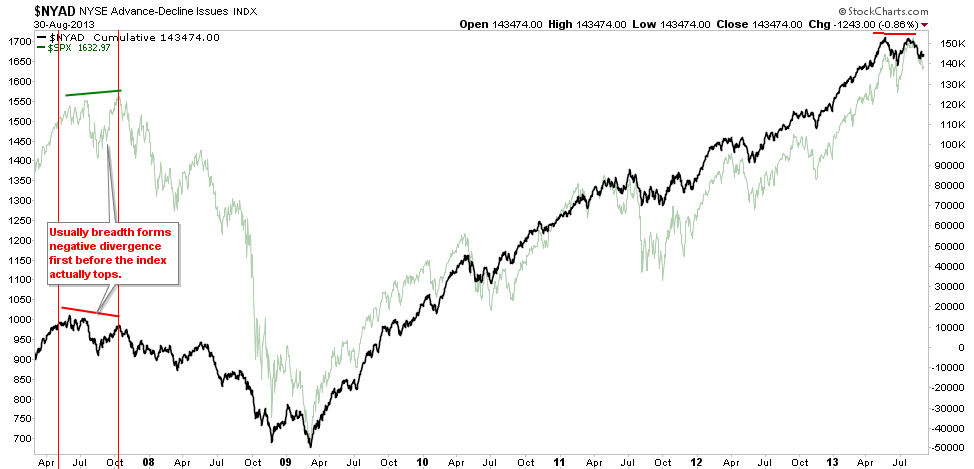
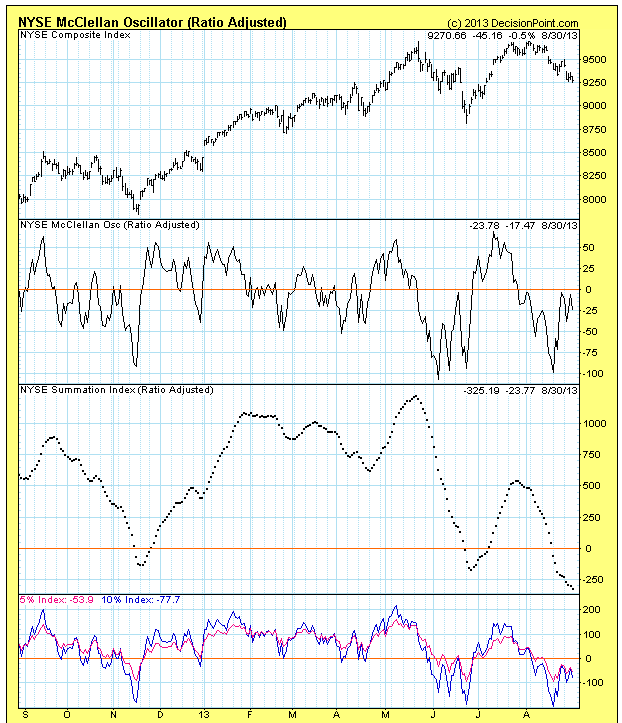
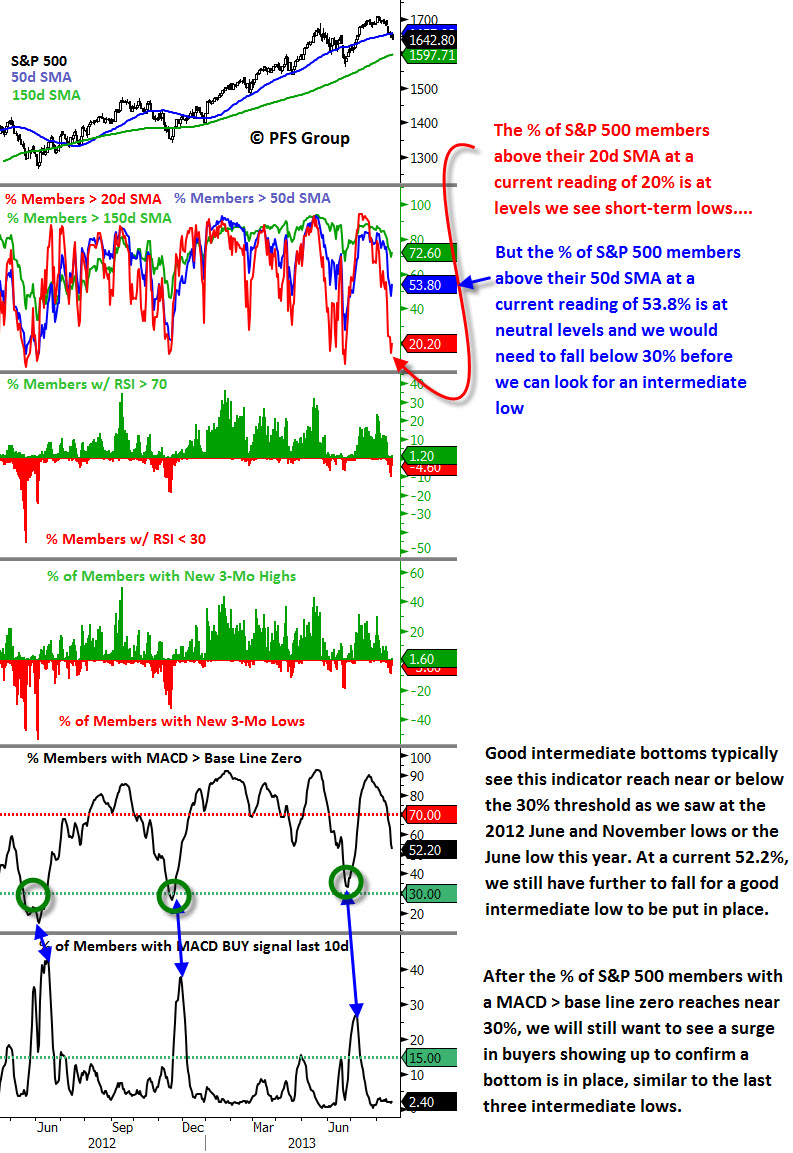
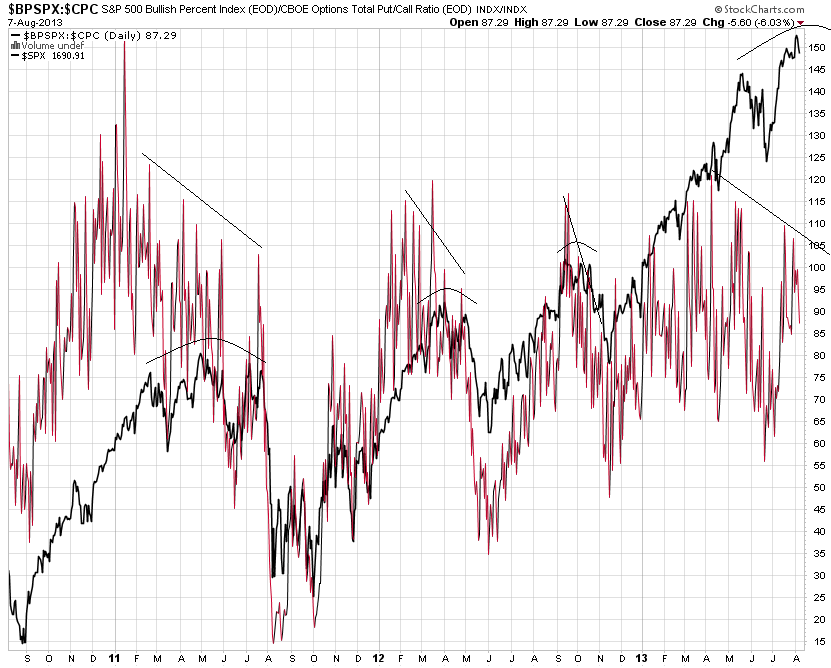
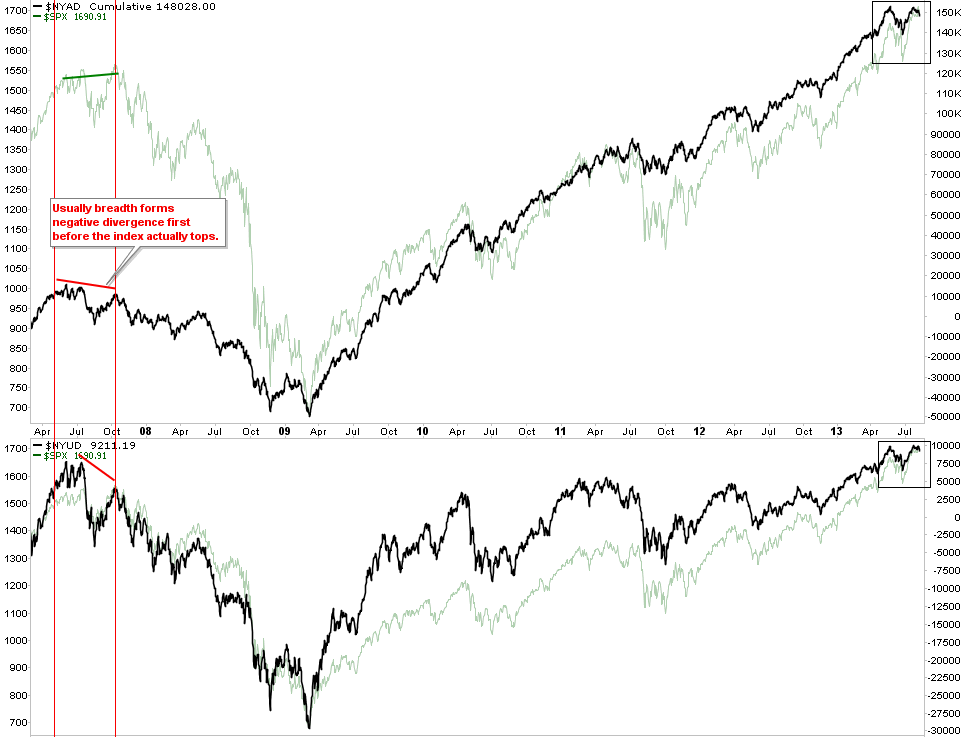
So let’s look at typical cyclical topping features. On US equities we saw a peak in May and then a marginally higher high in July, but on breadth divergence, which is one such sign. Below are two breadth measures showing the divergence (the Summation Index on the 2nd chart):
 Source: Cobra
 Source: Stockcharts / DecisionPoint
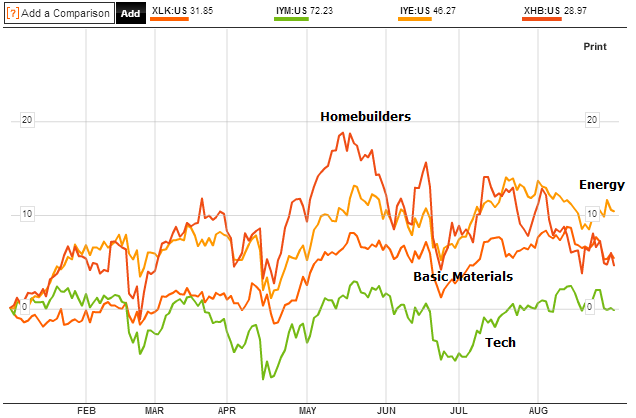
We should also see the batton being passed from early to late cyclicals in the process. As yields rise, interest sensitive groups start to underperform. Below I have compiled two early cyclicals: Homebuilders and Technology sectors, versus two late cyclicals: Energy and Basic Materials sectors:

Source: Bloomberg
We can see that since the start of the year Tech has performed flat whilst Homebuilders have been on the decline since the May peak. Energy has taken over, but Basic Materials have not yet joined. Drawing in other early and late cyclical sectors, the overall picture is one of a shift from early to late sectors to some degree, but tentative. I would like to see a more compelling shift develop to add futher weight.
Also in a topping process we typically see 90% distribution days and a shift from stocks making new highs to stocks making new lows. We saw such a 90% down day last week, but do not see strong evidence of a shift to percentage new lows.
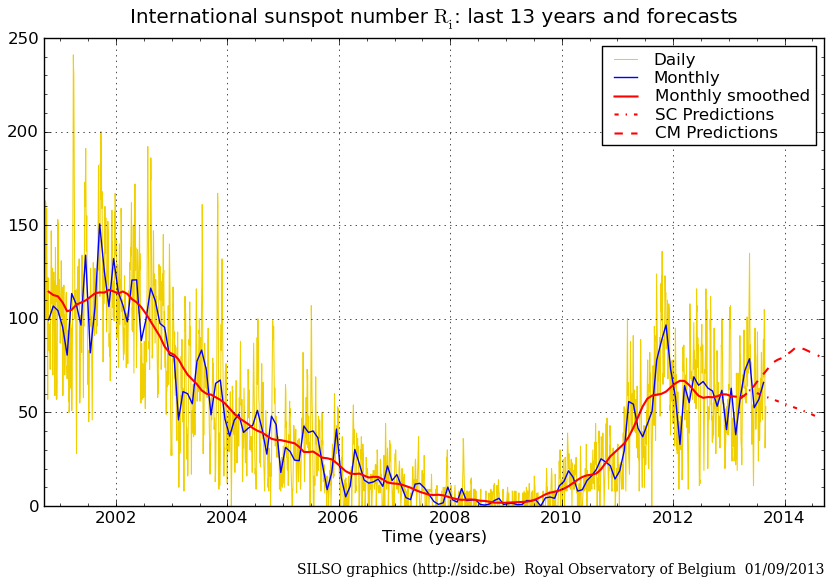
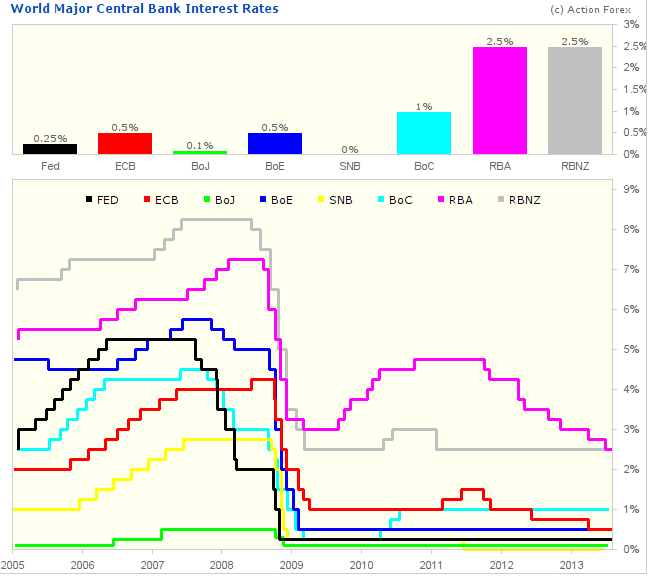
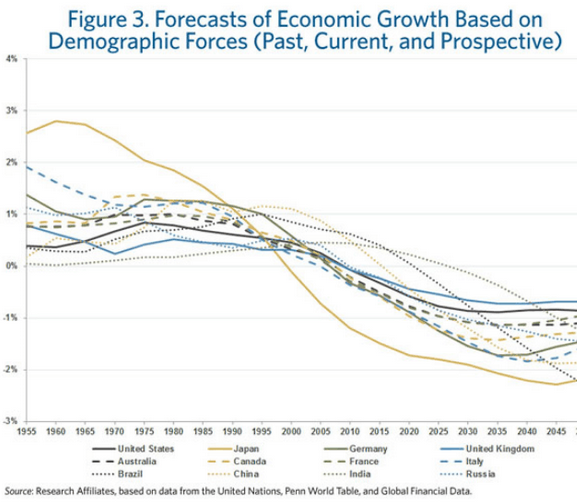
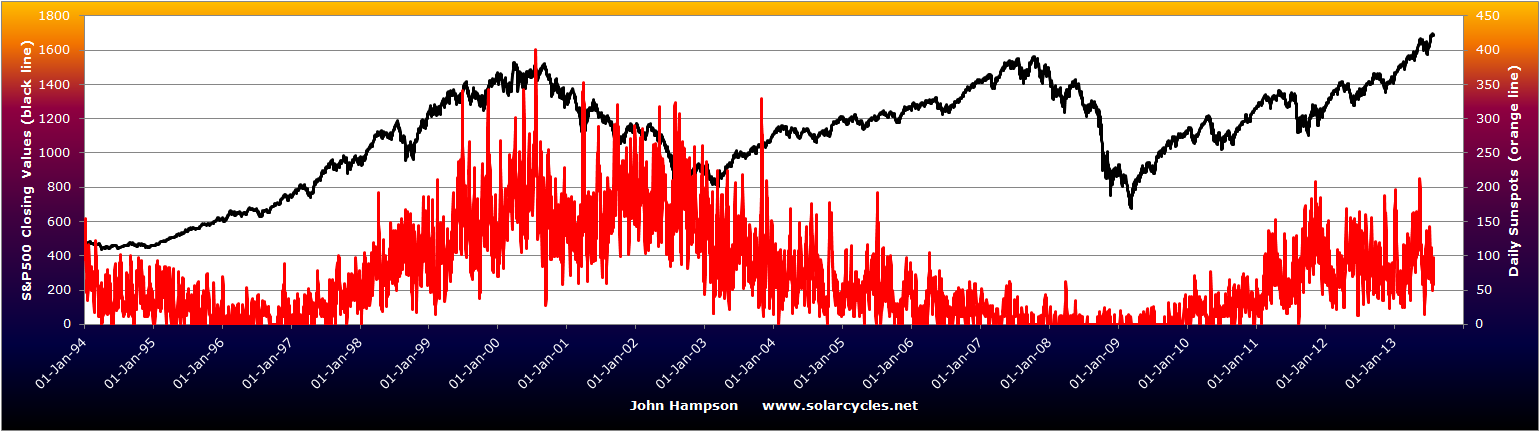
Other historic norms in a topping process are a tightening of rates through bond yields (check) and excessive inflation developing. We do not see excessive inflation, but that could occur if crude oil becomes a speculative target. If equities have stalled then under these easy money conditions it is possible that speculative money flows into oil and other commodities, linked to geopolitical developments or solar maximum. The solar maximum is historically correlated with both conflict and speculation, so they could materialise inter-related. However, whether the smoothed solar max is ahead or behind us continues to outwit the experts, frustratingly. Here is SIDC’s latest update, still running with the two possiblities:
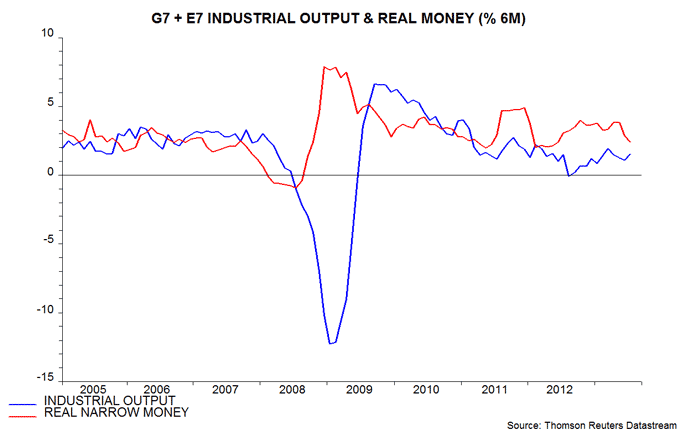
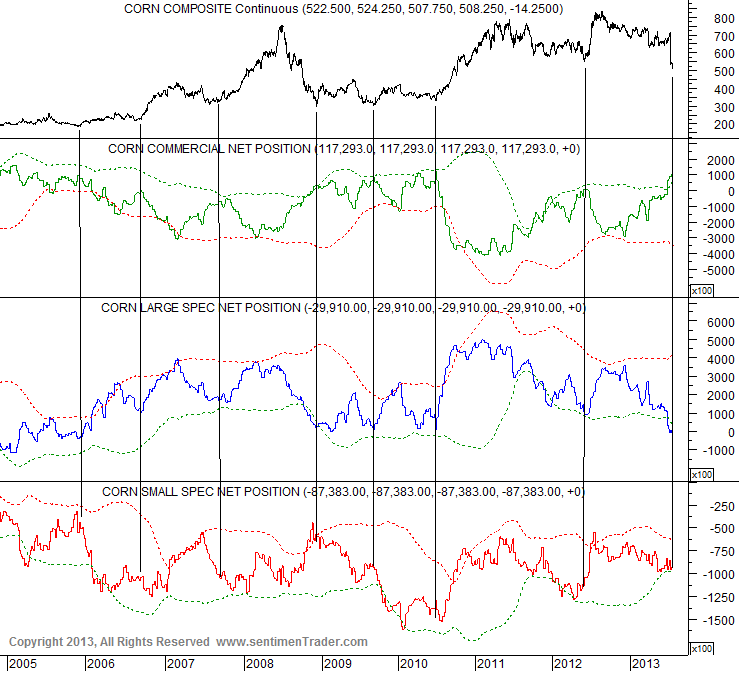
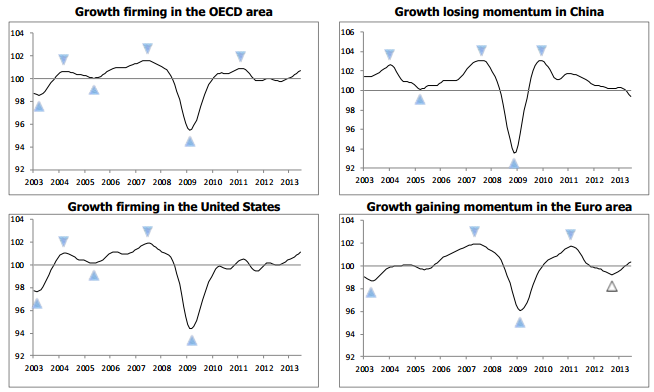
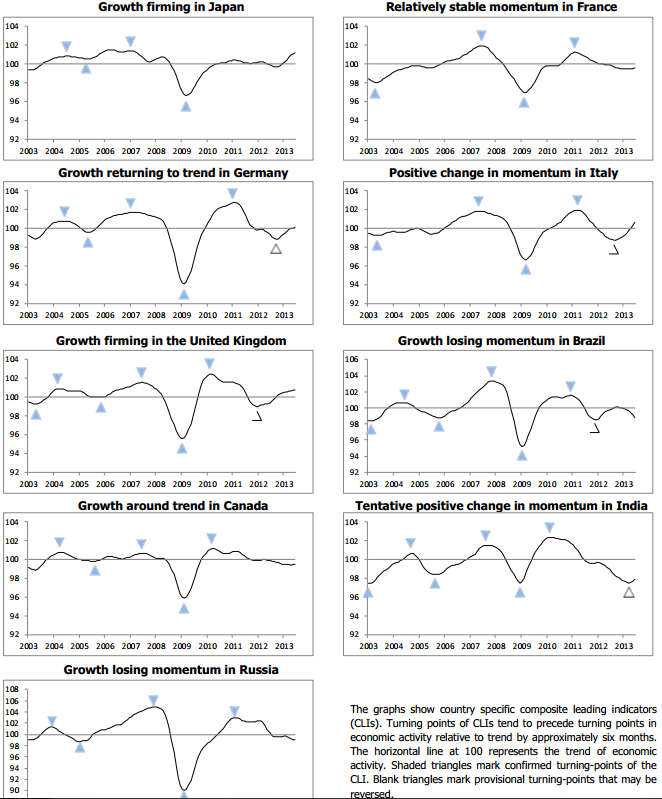
 One more signal of a cyclical top would be the rolling over of leading indicators. Typically commodities top out once indicators are already in decline, sucking the remaining life out of the economy, whereas stocks are forward-looking. Currently, we see a mixed bag of indicators. Conference Board leading indicators have largely weakened of late, but manufacturing and service PMIs have shown general improvement. ECRI leading indicators for the US show a clear change of trend but this needs to continue to weaken and drop beneath zero, as per the action prior to the last two recessions:
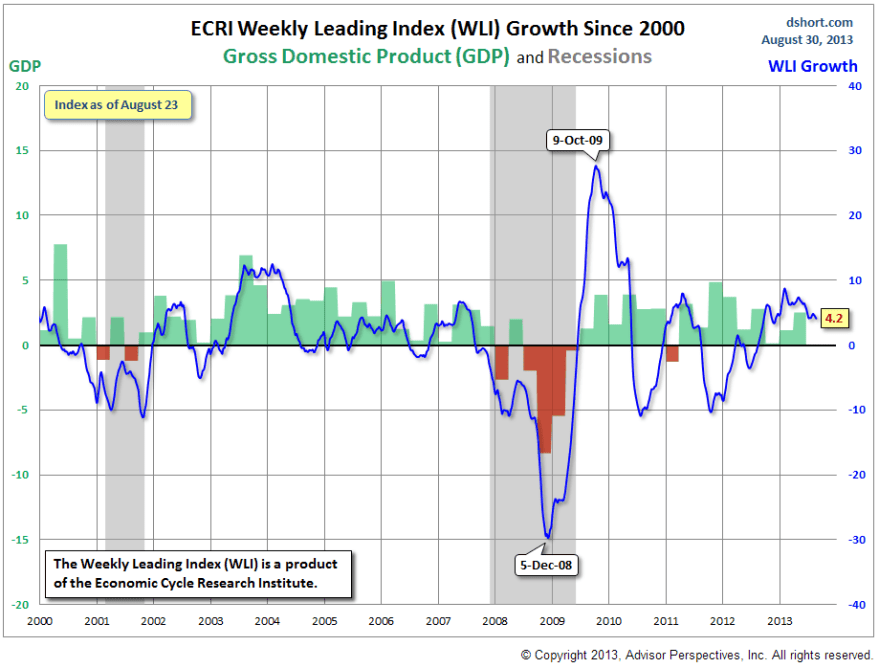 Source: Dshort
What I believe should occur is that commodities start to make strong gains here, taking the reigns as late cyclicals. Stocks should rally again, with the commodity related companies providing the thrust. Then inflation starts to be evident, and a demographically-challenged global economy starts to roll over in leading indicators, at which point stocks end their topping process and begin to decline, whilst commodities go rally to a peak in early 2014. In short, it would be historically normal for commodities to outperform here and in doing so puncture the global economy (which is weak due to collective demographics), which would tip over collective leading indicators into the negative. If this is a cyclical top in equities, then all this should happen promptly, i.e. this thesis should be quickly validated or invalidated.
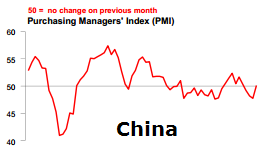
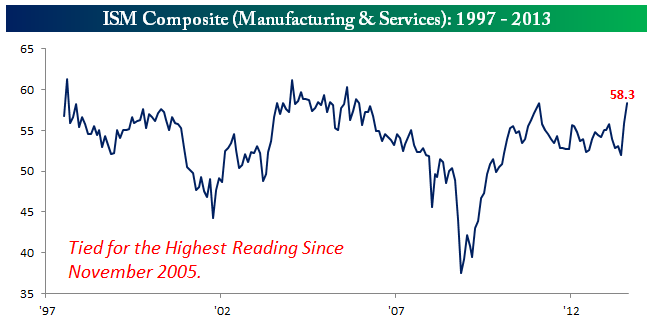
Two investment banks have recently come out with crude oil targets of $125 and $150. Clearly geopolitical (Syria currently) is a wildcard, but the evidence shows that the previous peaks in crude oil have been speculation-driven. As mentioned above, in these conditions of easy money, if stocks have lost their momentum, then an unloved commodities sector (and ditto emerging markets which are also fairly bombed out) could become the new target and quickly bid up. Disclaimer of course: I want this to happen, as I am long a basket of commodities. However, I believe the evidence now looks much more compelling for this to happen. Martin Pring echoes this and believes commodities have begun a new bull. China is displaying improvement, which is as the largest consumer of commodities, is important to the backdrop. Latest PMI today is back up:

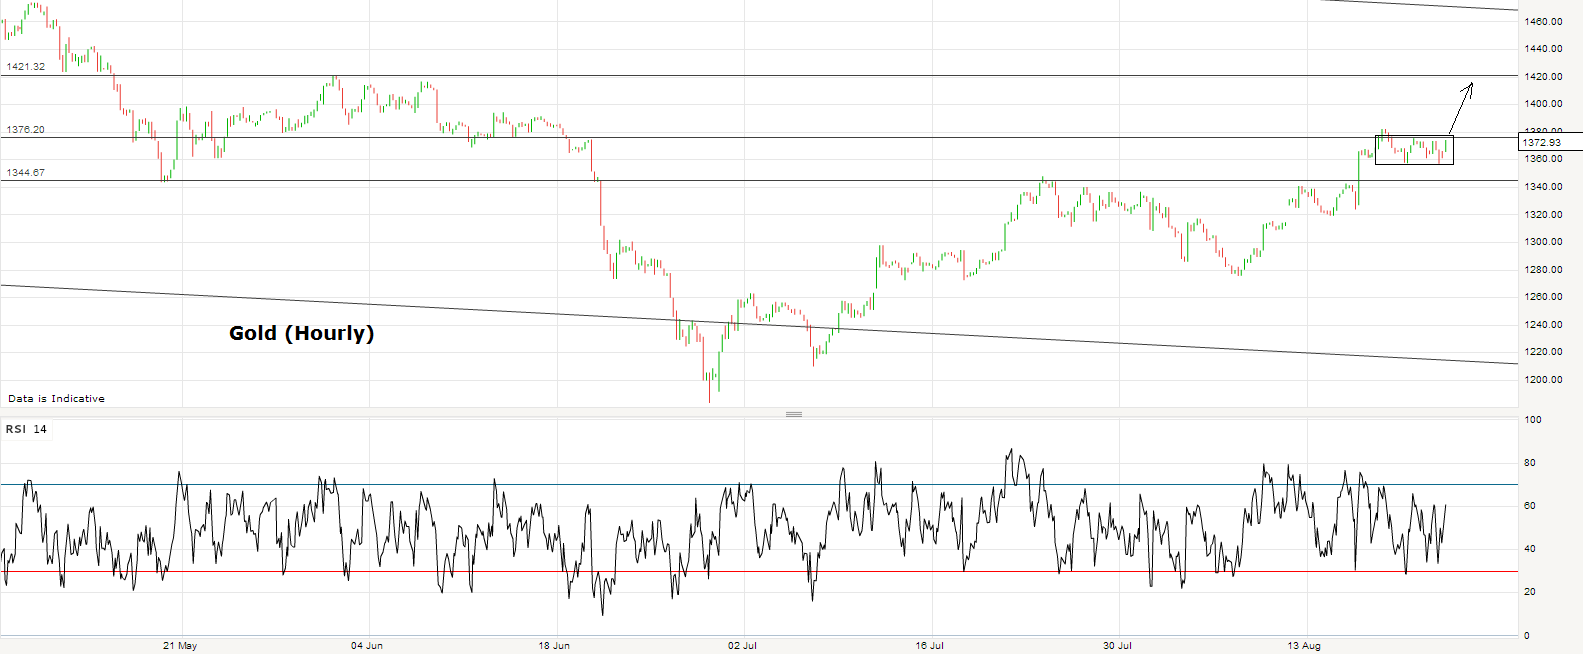
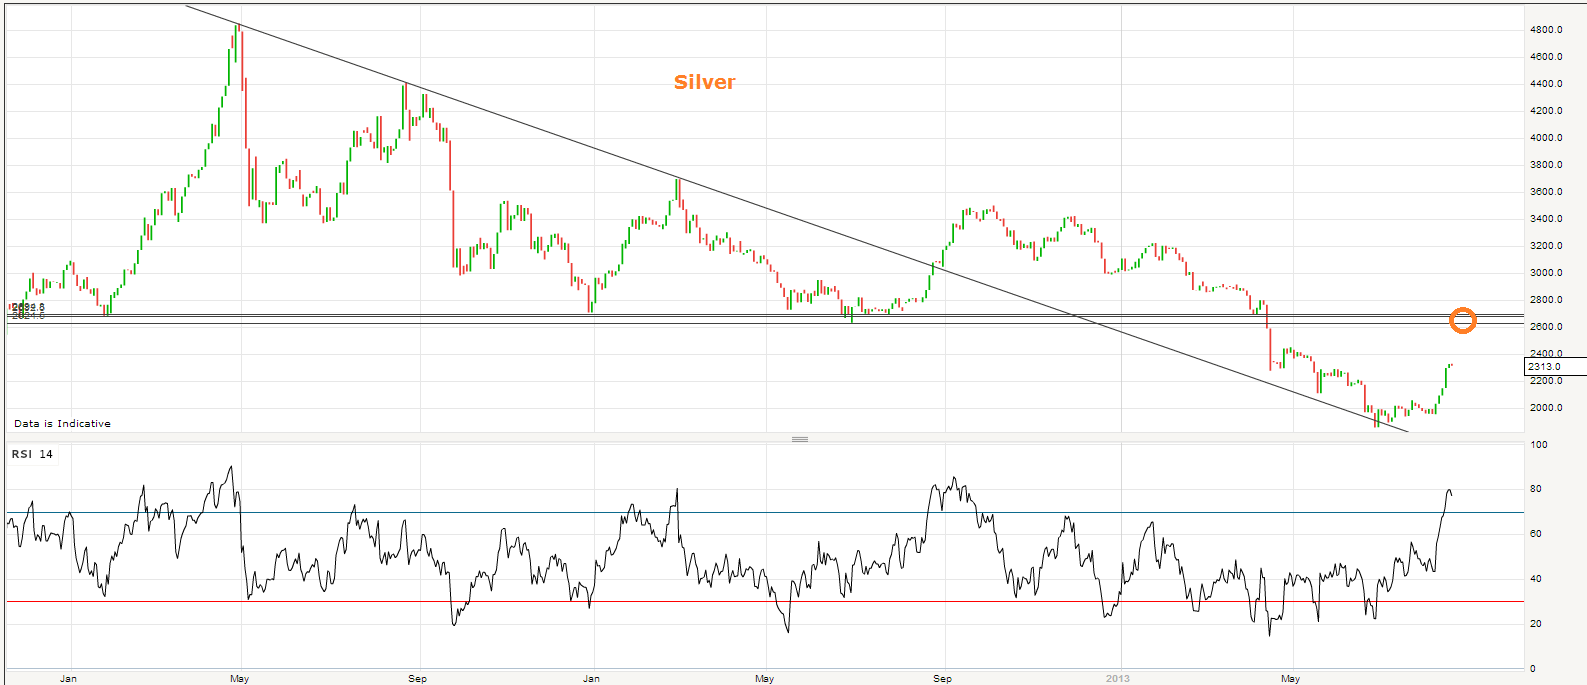
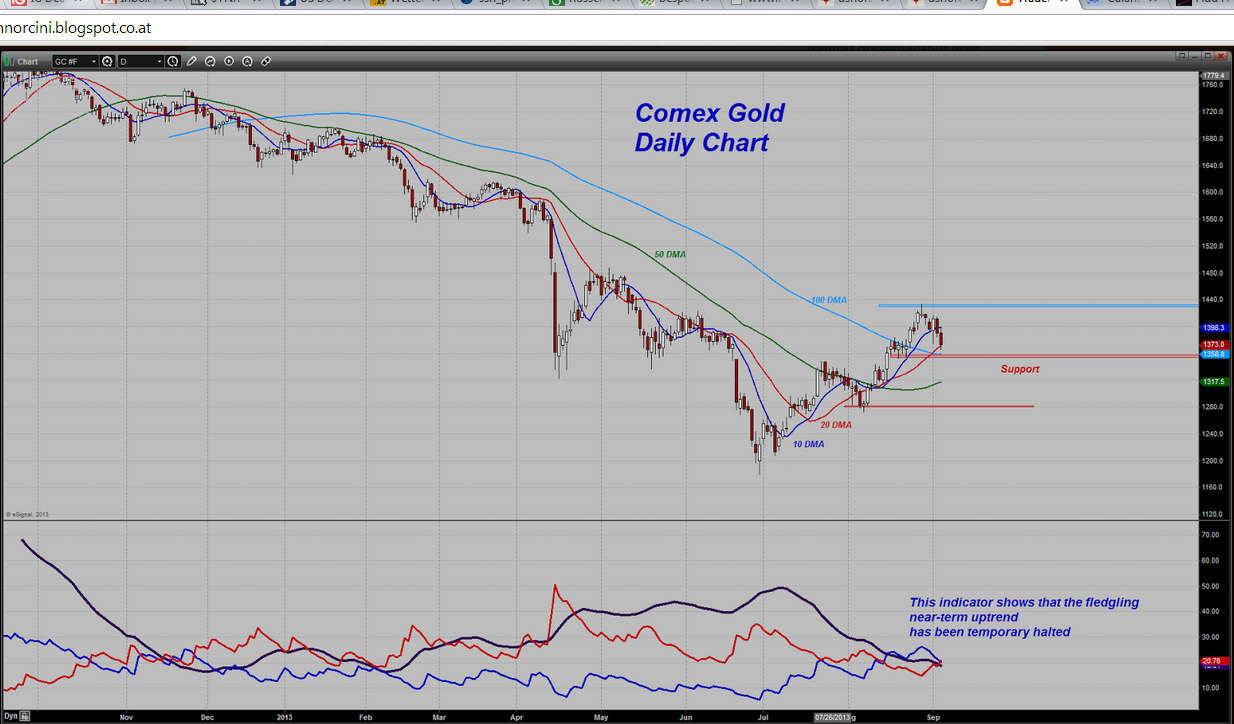
Gold has the potential to run up some way higher, as sentiment is still languishing despite the recent rally:
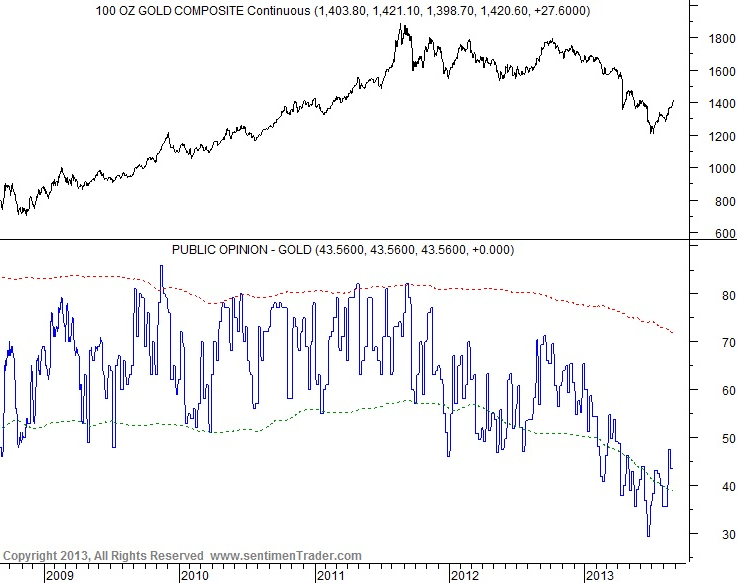 Source: Acting-Man / Sentimentrader
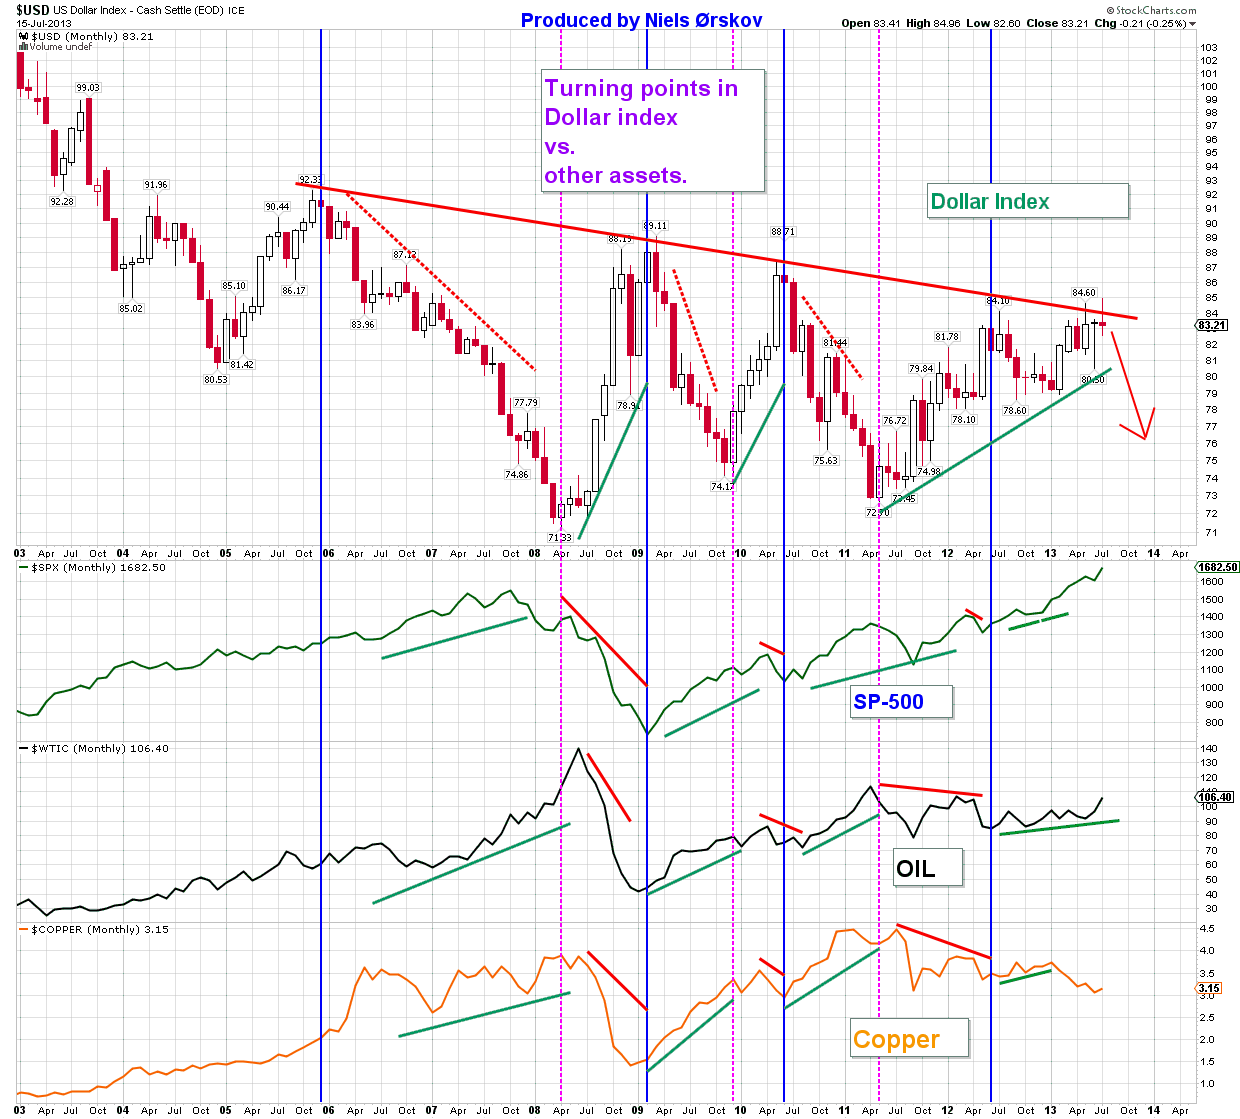
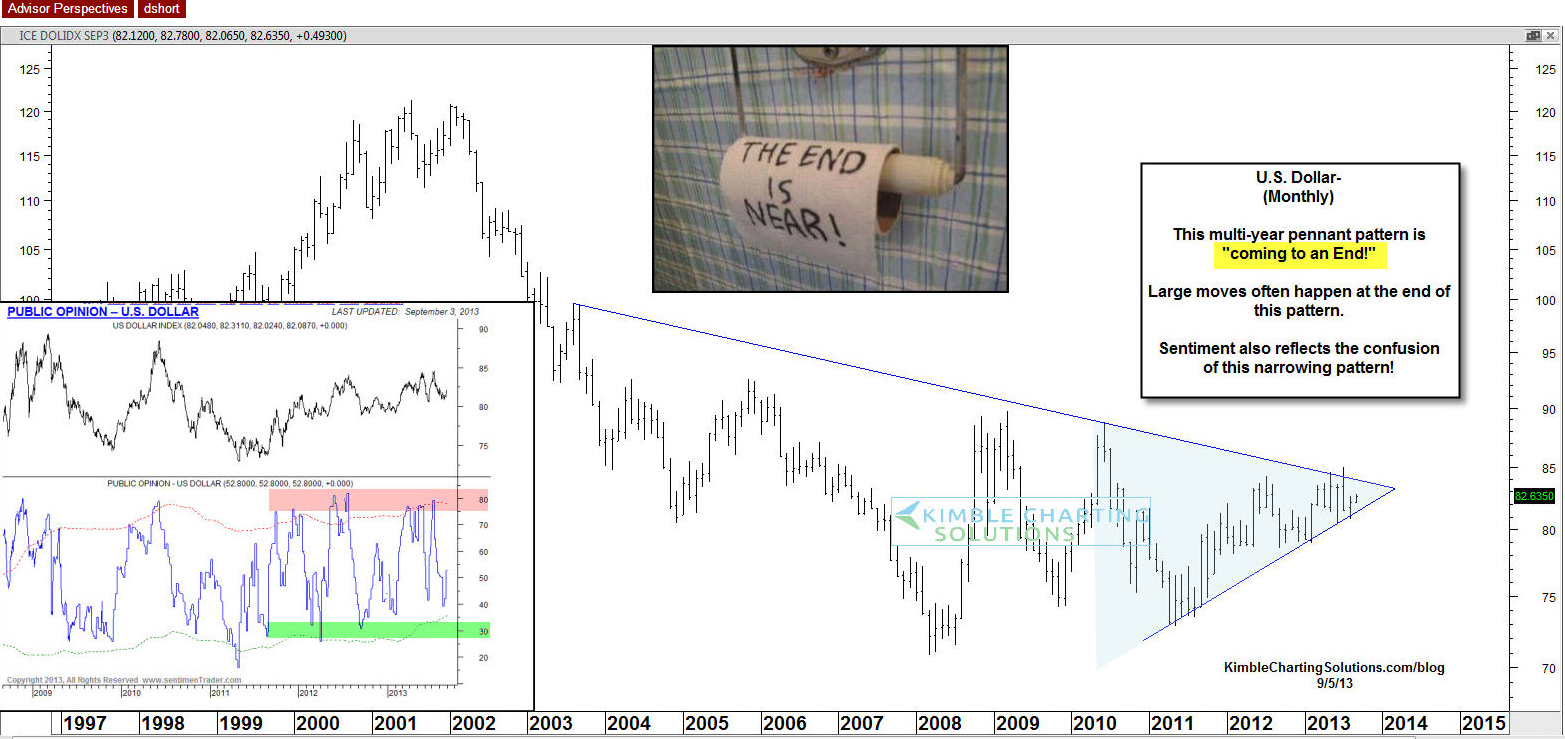
Chris Puplava speculated that the US Dollar could break down from its range. Such a development would also likely be a catalyst for commodities. But, the FOMC output in the middle of this month, with potential QE tapering on the cards, is likely to influence the markets, as will developments regarding Syria. Nonetheless, I would take the stance that either a normal commodities late outperformance and broad rally is on the cards, or it isn’t. I.e. QE and geopolitical will provide short term movement, but I’d suggest won’t ultimately decide the course. I see increasing evidence that we are seeing the pieces fall into place for a commodities sustained rally, but again note the disclaimer and also note the timescale I believe is applicable, i.e. it should happen without delay, and the recent upmoves in precious metals and oil should continue shortly and spread over to other commodities.
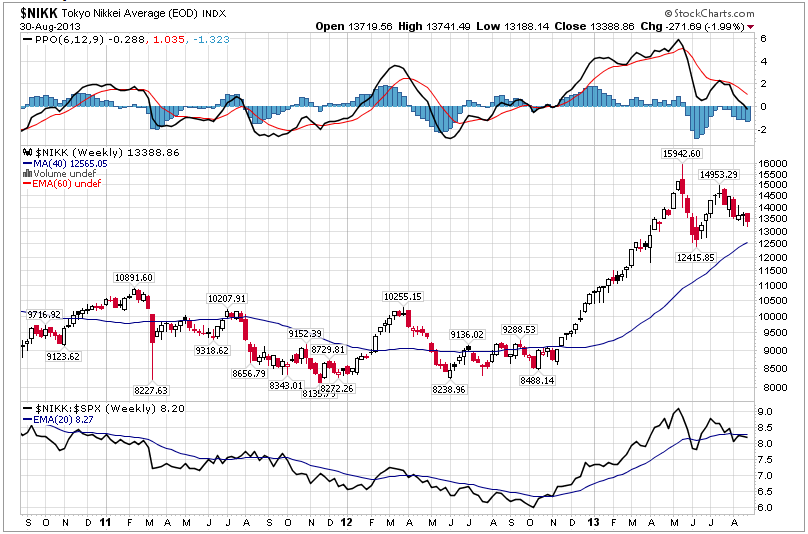
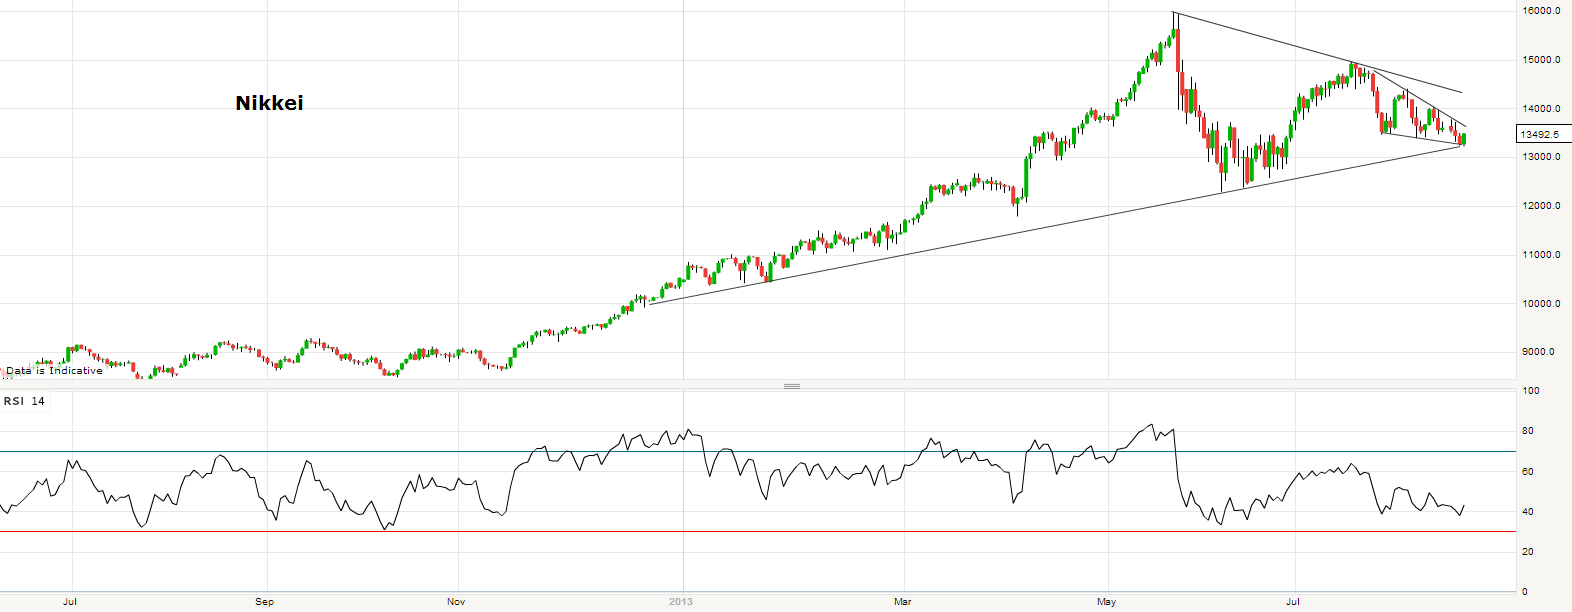
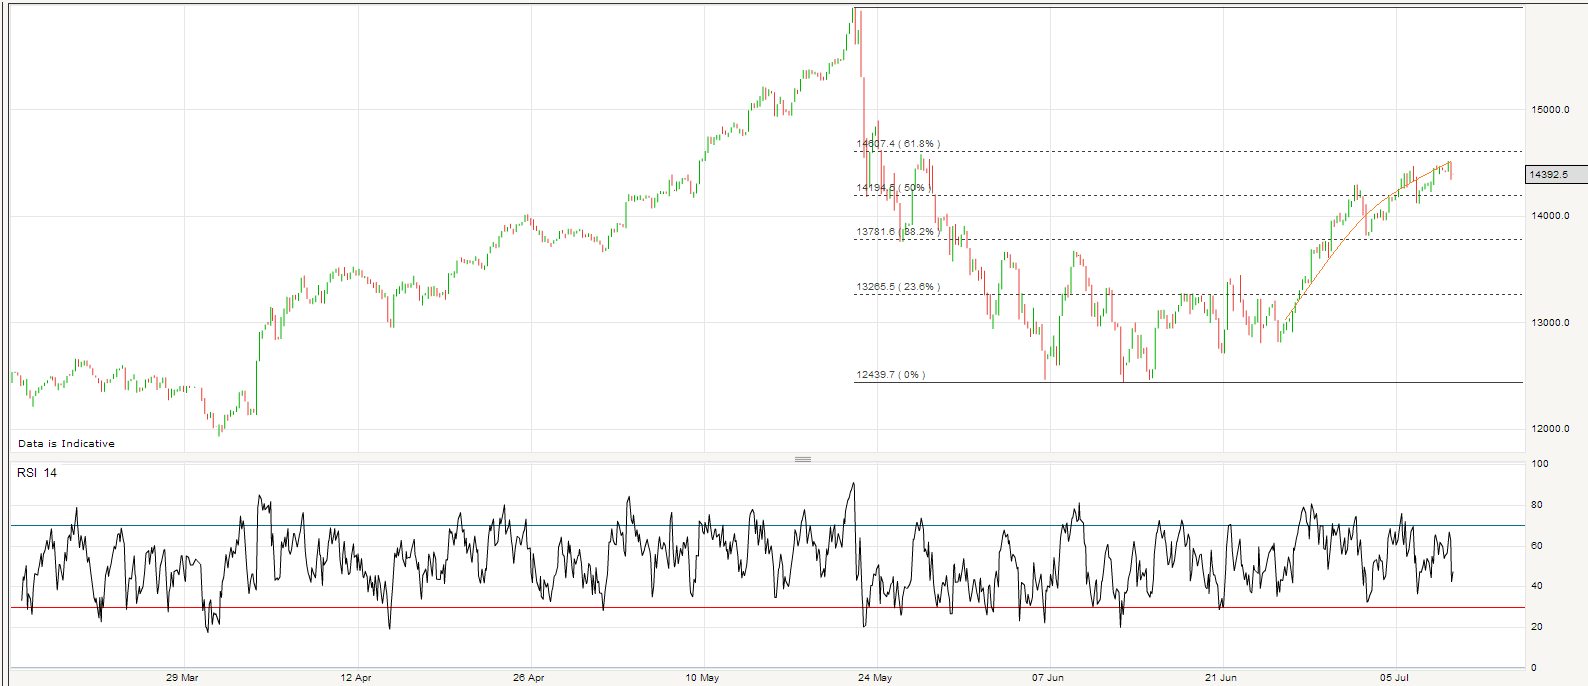
Let’s take an updated look at Japan. The Nikkei has formed a triangle on the weekly, hopefully evident to all:
 Source: Stockcharts
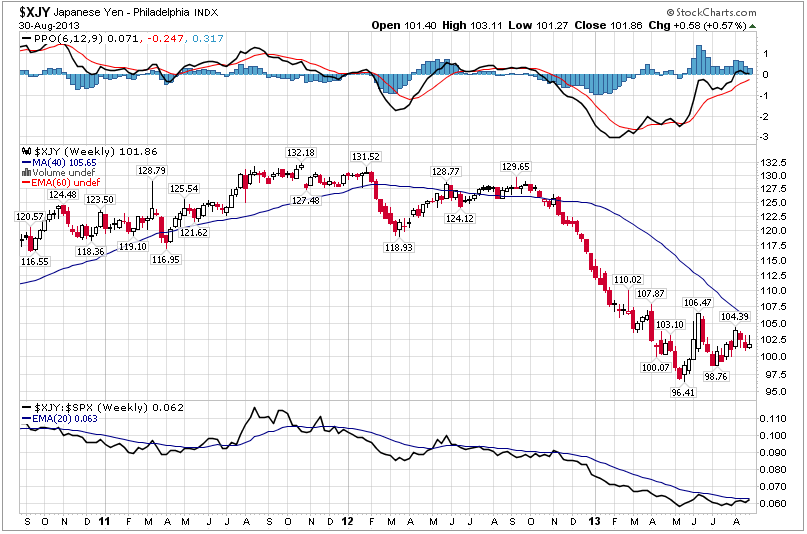
I don’t believe it’s clear which way that’s going to resolve. However, a similar but inverted picture on the Yen shows a candle last week that could mean this is a bear flag before further drops:
 Source: Stockcharts
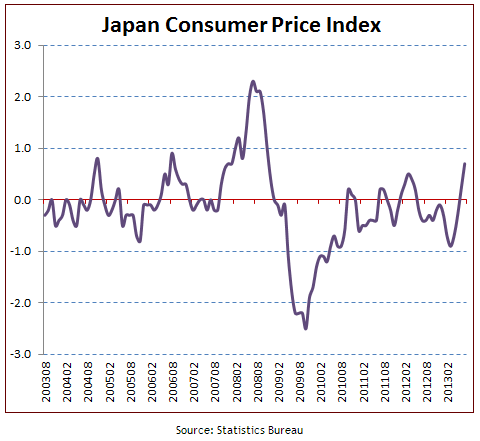
If the Yen breaks down that should benefit equities. However, the cheaper Yen has made imports to Japan more expensive, and Japan is a big energy importer. The Government’s aim of reviving inflation looks to be going well:
 Source: Sober Look
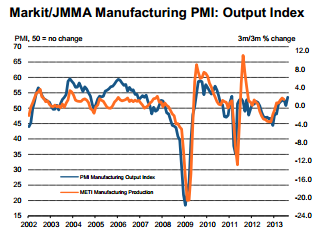
However, this is largely the result of fuel and utilities going up as imports become more expensive, which is clearly no good for the economy (however, note that its exporters have benefitted). If commodities were to rally hard then Japan would suffer. However, as that development is just my speculation at this point, there is also positive evidence in the Japanese economy, which is what I would expect given their current demographic tailwind. We see the latest PMI shows strength, and makes last month’s drop look more like a blip:
 Source: Markit
So, until or unless commodities, particularly oil, start to rally hard, I would side with Japanese equities breaking upwards. However, if US stocks are making a cyclical top then I would expect global equities to turn down once the topping process is complete and I would not see Japanese equities going the opposite way. Once again though, if US equities are making a cyclical top then we should see commodities rally again to provide the tipping over, and Japan would then suffer accordingly. In short, I will hold off adding to my single Japan long position, pending further developments.
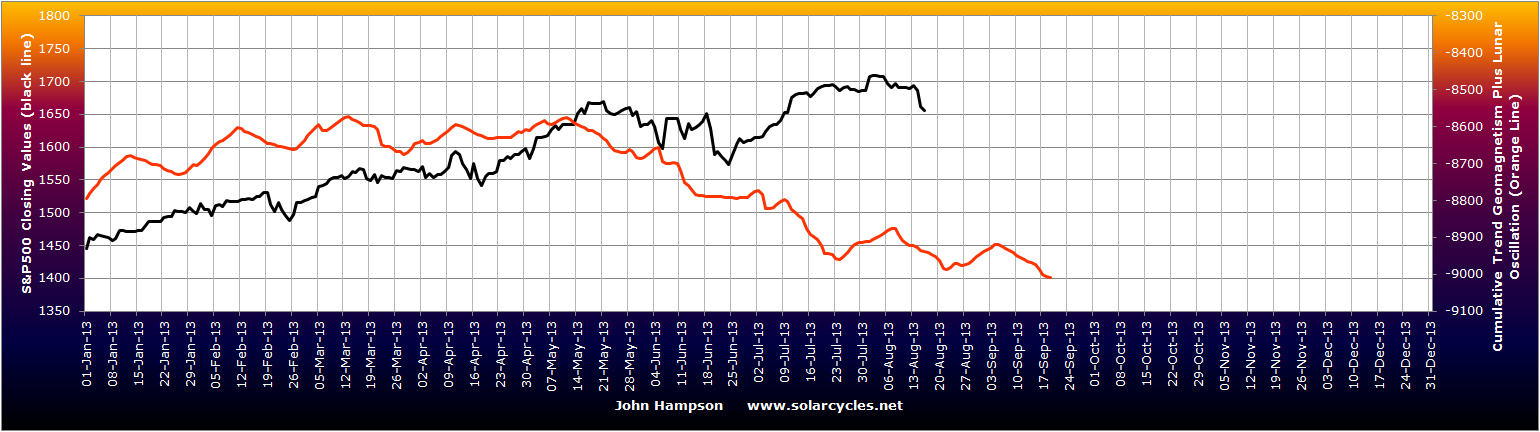
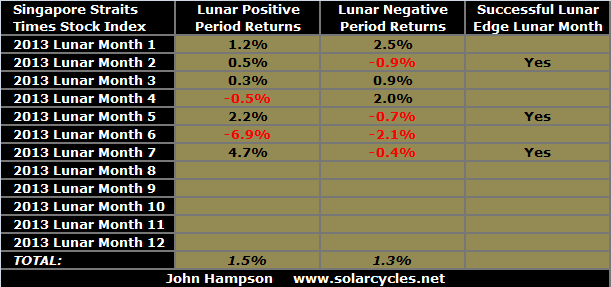
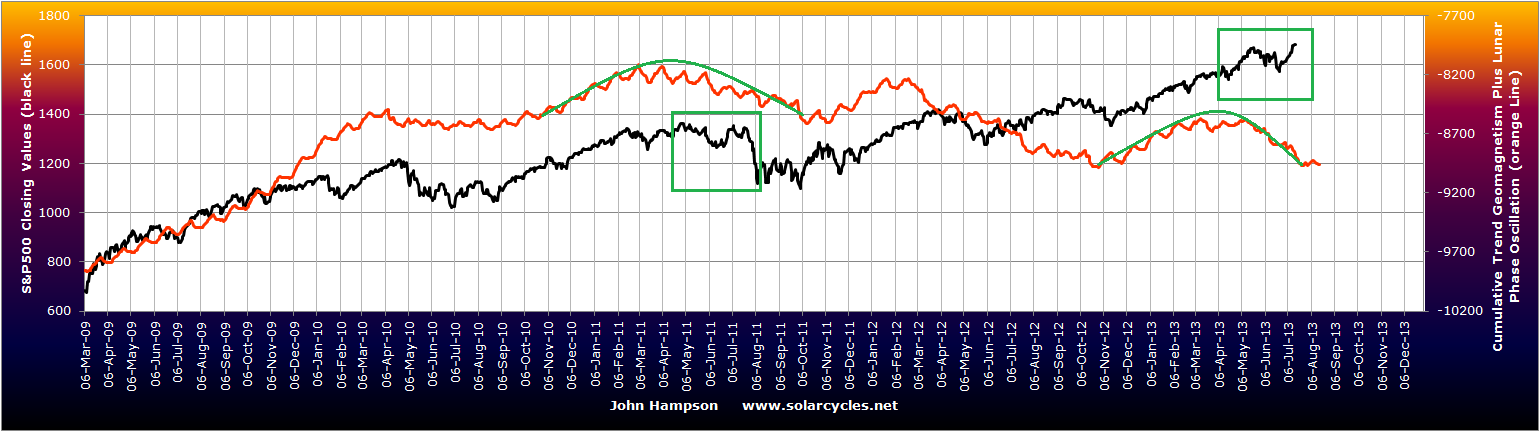
This week we have the new moon on Thursday and the end of the lunar positive period at the weekend. I expect stocks can mount a rally this week and that may well be the next leg up in the topping process. I have updated all models this morning and the geomagnetic forecast for the next 3 weeks is overall down to flat.


 Source: Markit
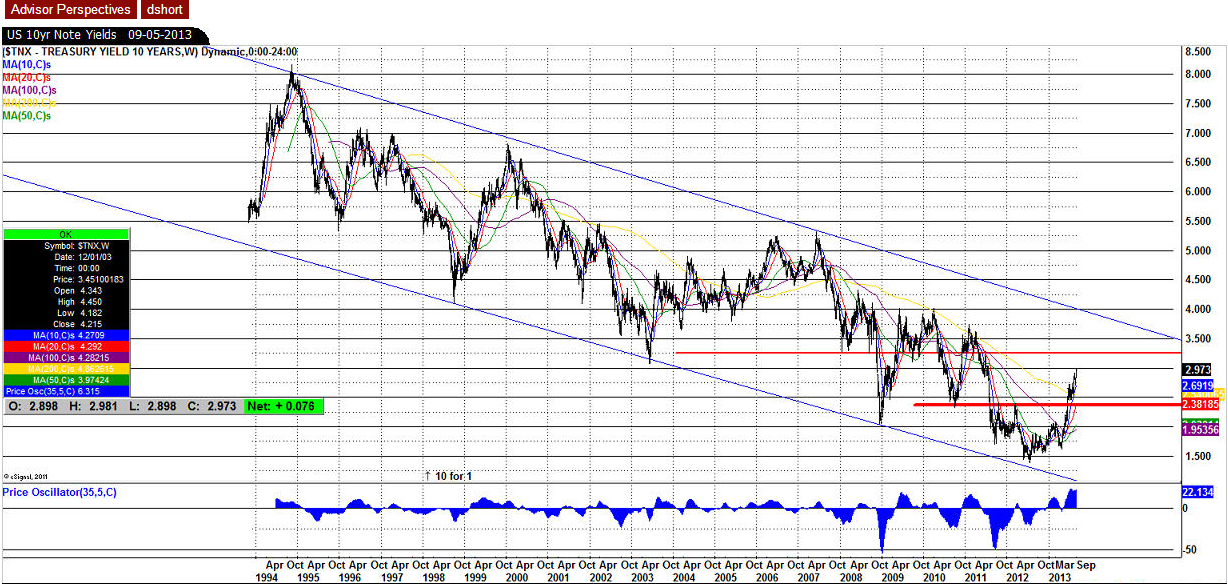 Source: D Short
 Source: NASA