Divergences, Ratios and Surprises

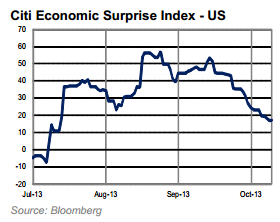
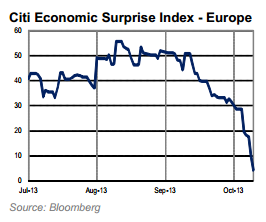
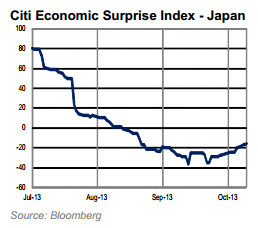
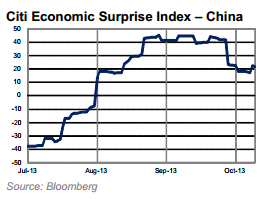
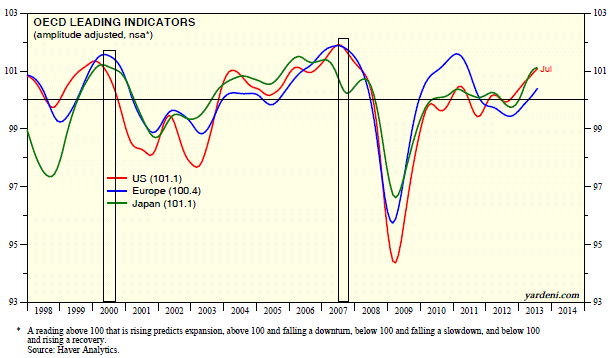
Here are the latest economic surprises indices for the major nations:

19sept5 19sept4 19sept3 19sept2Source: Citibank

Japan aside, economic surprises for most of the majors topped out as we turned into September. Historically there has been a fairly good correlation between economic surprises and stock market returns, but the correlation has deteriorated throughout 2013 and turned negative:

19sept7

Source: JP Morgan

Is there anything about that period from early 2009 to mid 2010 where correlations also were anomalously negative? My take is that by March 2009 most of the major stock indices were at p/e 10 or below, and thereafter we saw a period of post-panic bargain hunting at historic cheapness, despite and regardless of continued disappointing economic data. That doesn’t apply at today’s valuations.

Here’s another look:

19sep1
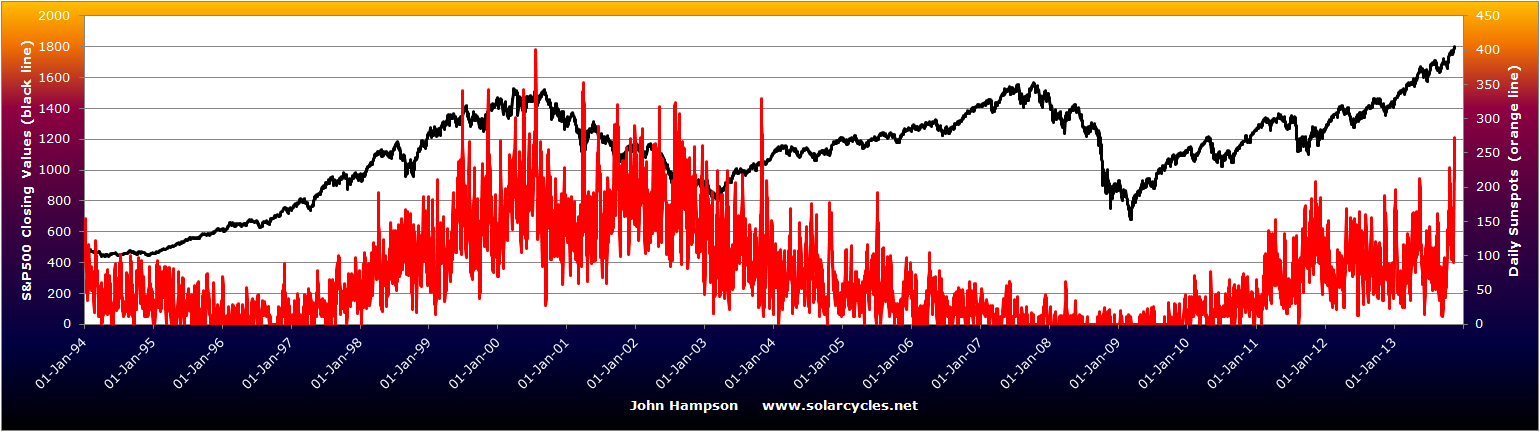
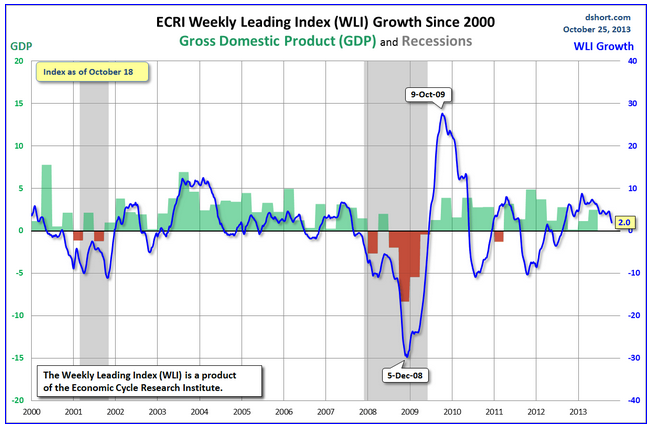
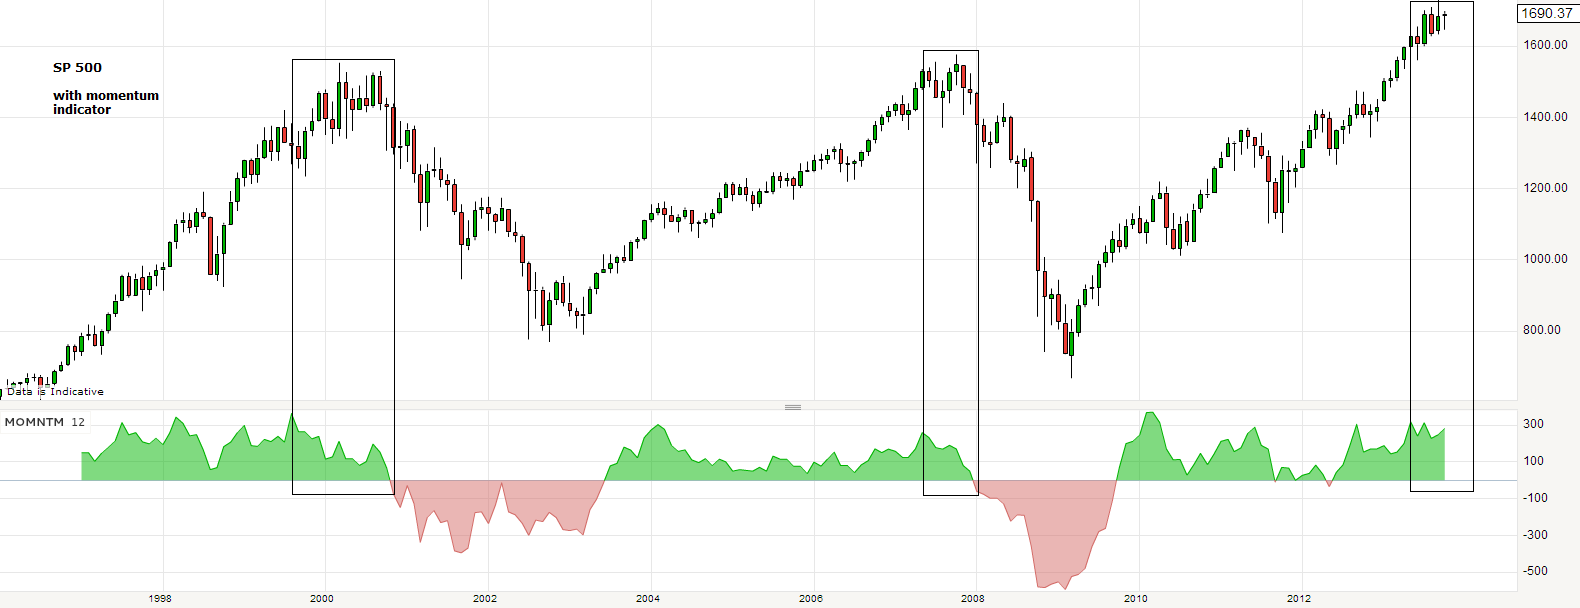
I’ve charted the peaks in US economic surprises versus the SP500. It can be seen that from 2006 to 2012, trend reversals in economic surprises reliably brought about corrections in the SP500, but sometimes with the stock market eeking out a marginal new high and then rolling over. But since the end of 2012 the two economic surprises peaks have been largely ignored by the market.

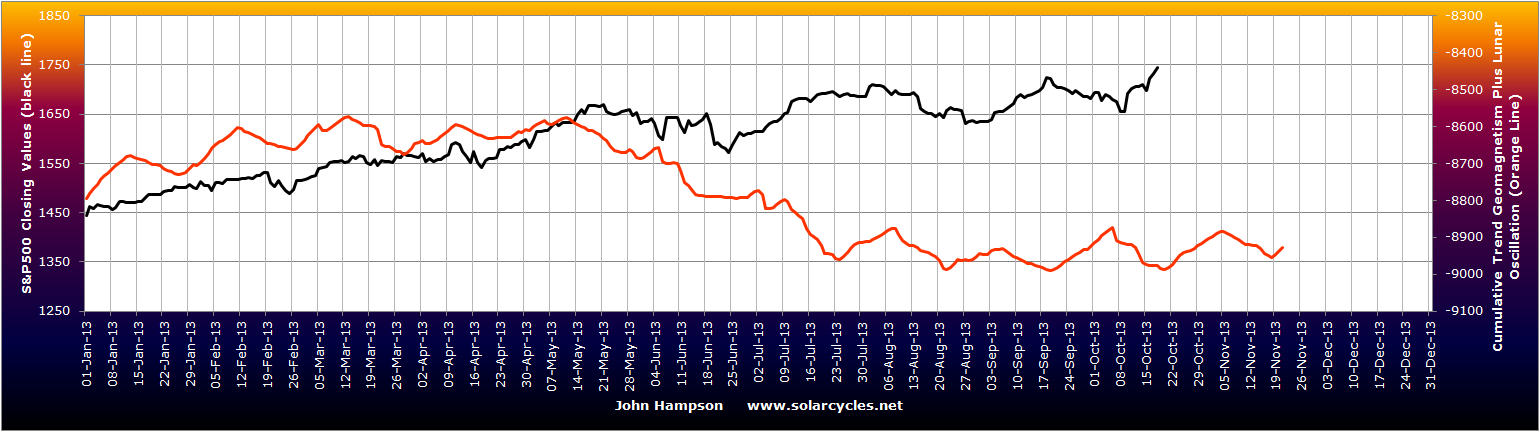
There have been other notable divergences since the turn of the year.

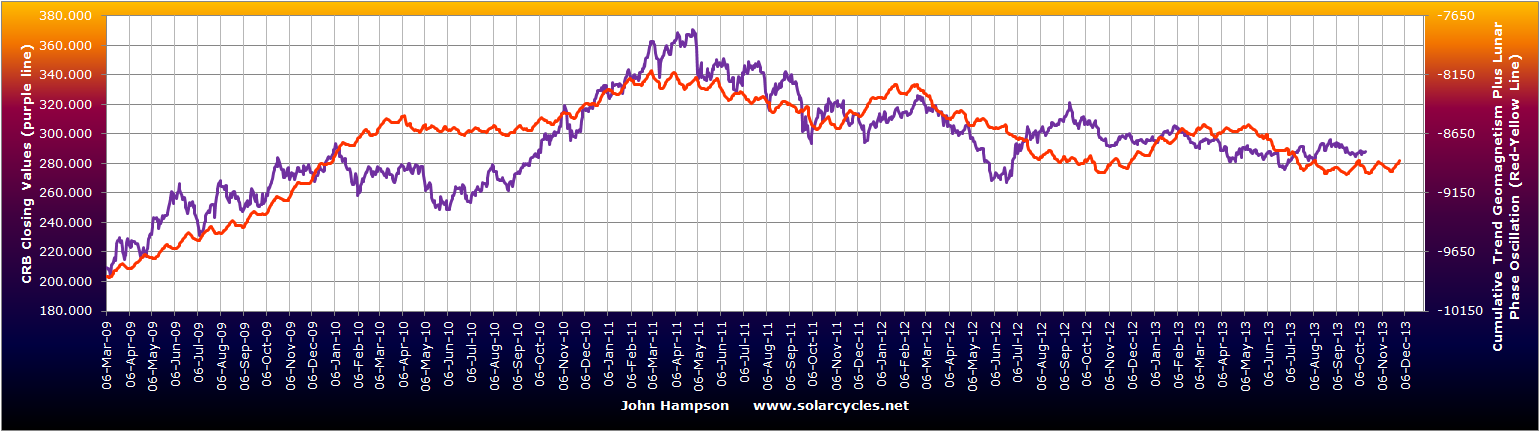
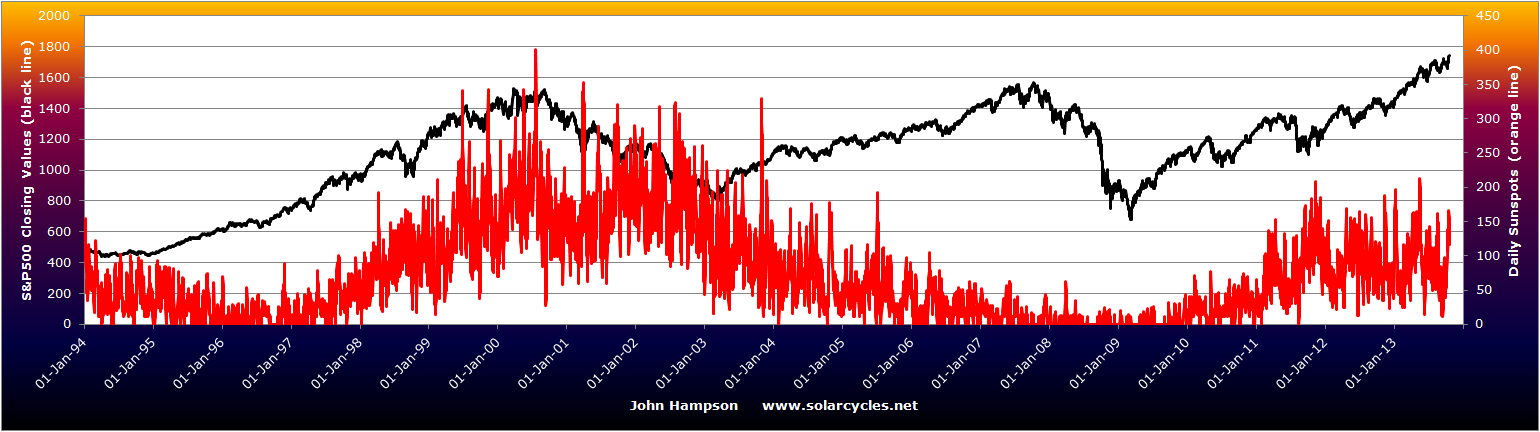
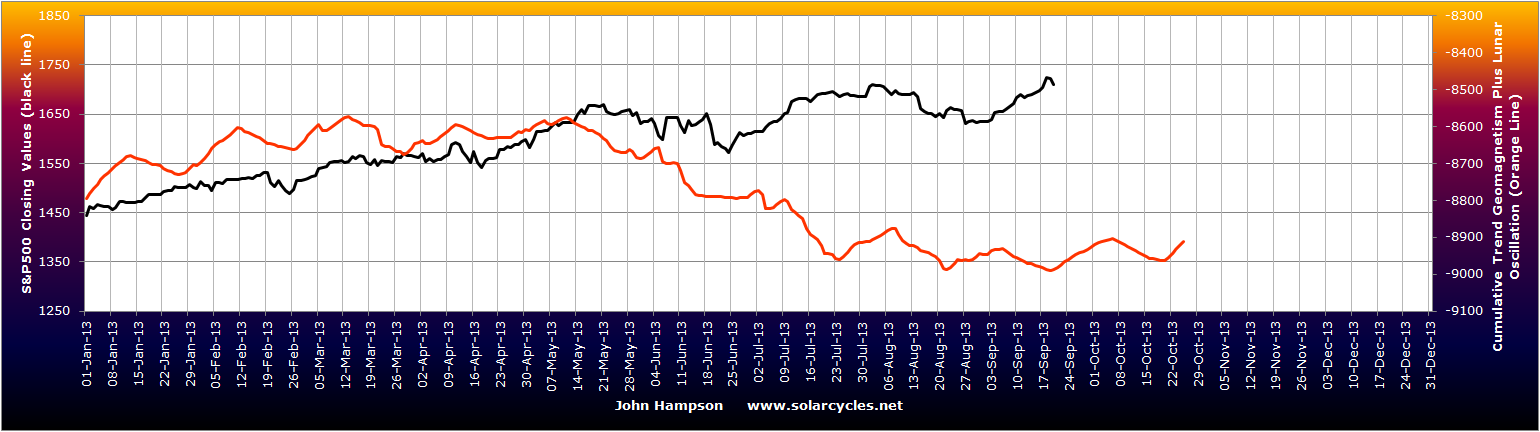
Equities have diverged from geomagnetism:

19sept12

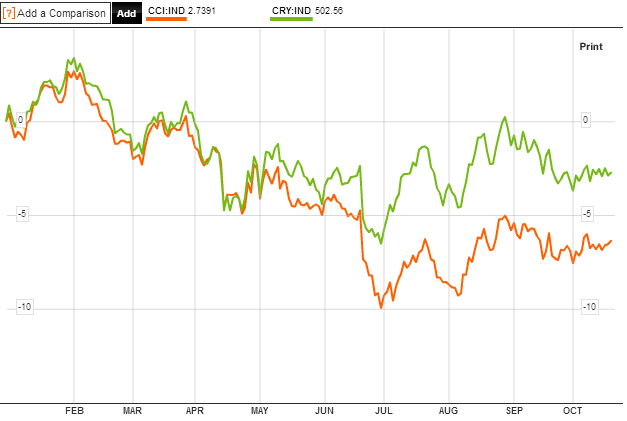
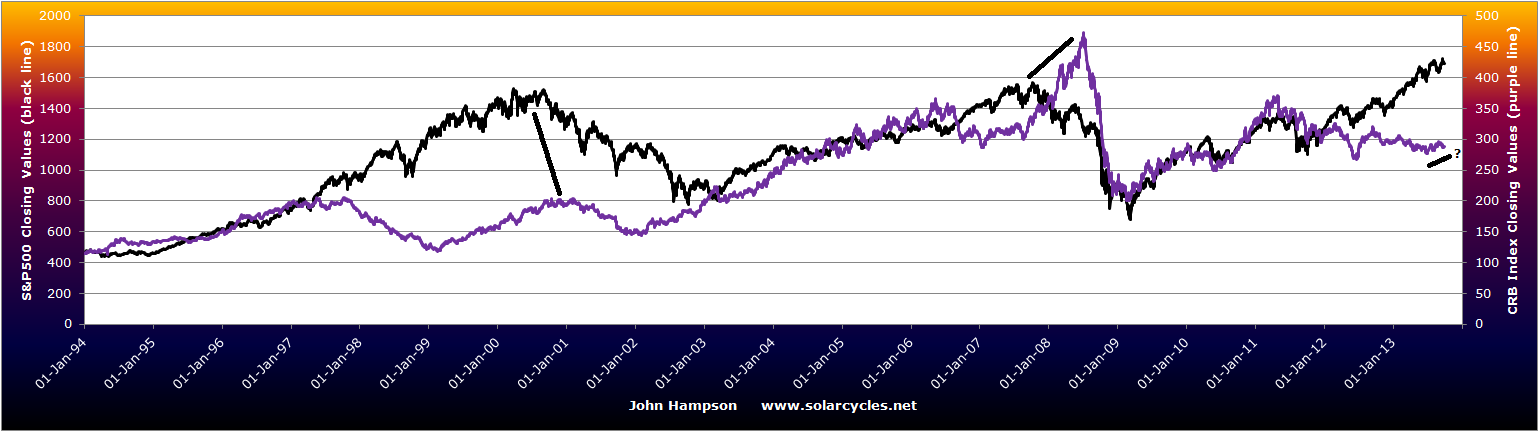
Junk bonds, which have historically correlated with equities fairly well under ‘risk-on/off’ sentiment, have parted ways with stocks and are actually down for the year. Commodities likewise:

19sept11Source: Yardeni

I have extended this commodities:stocks ratio chart from early 2012 to the current level in November 2013, showing the degree to which stocks are now valued versus commodities:

19sept13Source: Stockcharts

Down to 0.15, very close to the level reached at the 2000 equities peak.

Versus bonds, equities have also made a sharp run up in relative valuation this year:

19sept14Source: ispyetf

If this is the solar maximum at the end of 2013, then it would be normal, by history, for the secular asset class of the time to be bid up in a speculative finale, diverging from normal correlations and leaving models behind, in a final overthrow. If this is occurring with equities (perhaps disinflation has killed off commodities), then the above charts would be evidence for that, and we are left trying to look for clues as to how much further, both in time and price, the speculative finale has to run. If it isn’t equities, but rather commodities that are bound for a speculative finale (as they would rather befit the ‘secular’ asset class leading into this solar peak), then the above charts are warnings that the rug could be pulled from under equities at any time.

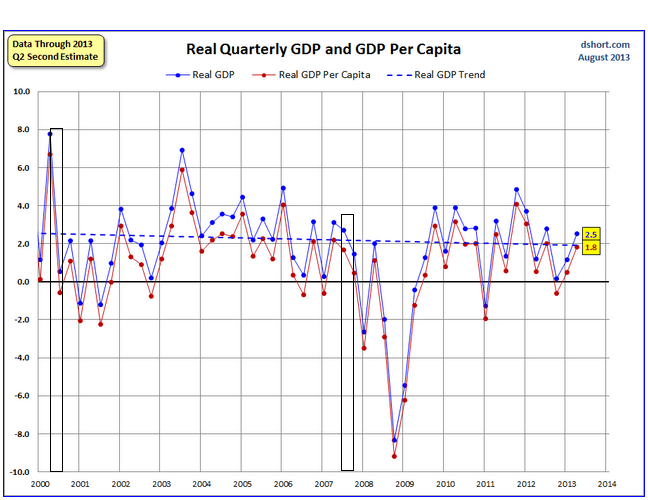
Right now, the balance of evidence suggests that it is stocks being bid up to a speculative finale, if my solar thesis is correct. Even without solar, we see various evidence for that, in my last post and this. See how margin debt has accelerated over the last 12 months, as it did prior to the last 2 major stocks peaks:

19sept10

Source: Dshort

And now look at the decline in trading volumes:

19sept15Source: Marketwatch

There are fewer and fewer participants in the market chasing it higher, and the margin debt and credit account levels (last post) suggest increasing leverage to do so. Unless more people and institutions come to the market, then that is a recipe for a steep decline or crash ahead. By demographics, those additional participants are unlikely to materialise. Recall that demographic trends in the US were up into around 2000 and have since been downward, continuing this decade. I suggest that is what we are seeing in the trading volumes ‘mountain’ above.

In summary, I believe the equities bull is on borrowed time and that risk-reward is stacking up on the short side. But it comes down to how much further in price and time stocks can extend first. If solar-inspired speculation is at work then parabolic becomes more possible. If on the other hand equities are to make a topping ‘process’ rather than a parabolic, then by normal measures this has not started in a meaningful way so should at least extend for several months and postpone a major decline until 2014. If commodities are to become the speculative target then they should take off as late cyclicals whilst stocks make a topping process. This remains theory only, and deflationary demographics are a headwind to this occurring, so I have my doubts.

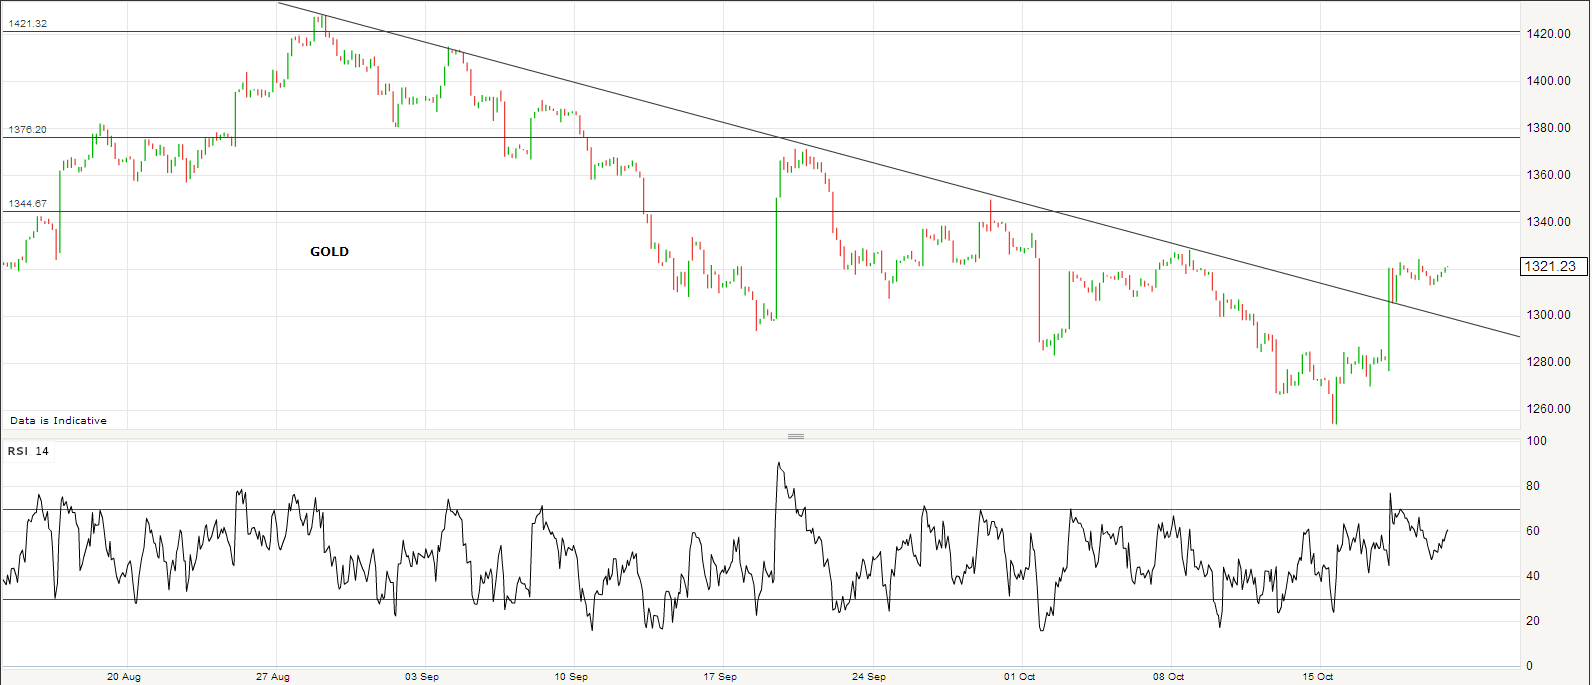
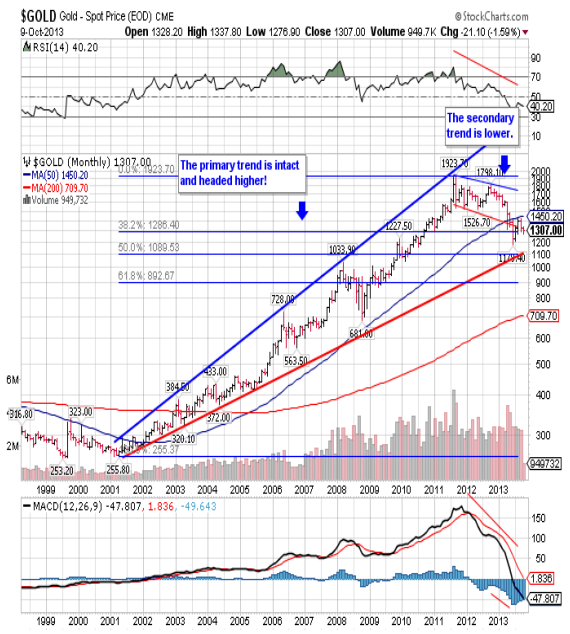
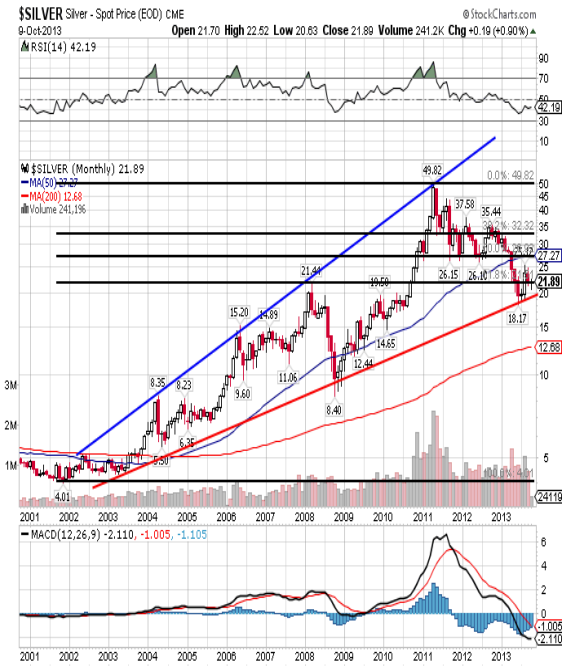
On that note, if we look at when gold really took off in the past, it was under conditions of negative real treasury yields. Rises in yields over the last 12 months, together with shrinking inflation, have taken real yields positive and are a problem for gold. Deflationary winds, due to demographics, threaten to take inflation yet lower, whilst treasury yields by late 2012 had reached historic extreme lows, suggesting renewed downside may be limited. So, if I could speculate how fortunes could be reversed in gold, it would be either the world tips into deflation and gold performs more ‘uniquely’ (gold’s performance under deflation is limited in history, but I suggest it ought to perform as the default go-to asset under such conditions when all others are unattractive) – or – central banks take renewed action against the disinflation in progress by increasing rather than decreasing stimulus, e.g. the ECB launches QE and the Fed maintains QE rather than tapers.

19sept9Source: Dshort

State Of The Markets

Starting with the equally-weighted commodities index versus the world equities index:

17nov11Source: Bloomberg

Commodities remain depressed but still within a large triangle. Last chance though here as the triangle compresses and they test horizontal support again. Their underperformance, based on supply and demand, is consistent with the demographic trends now in place in most of the major nations.

World equities broke out of their mid-year range, rendering the potential topping process redundant. That means equities need either to start over a multi-month topping process at some point ahead, or make a parabolic top instead. The increasing rate of gains, shown by the trend, suggests the latter could potentially occur (or be occurring), and this is supported by increasing evidence of a solar maximum taking place now:

17nov13Historic solar maximums have been correlated with speculative manias, such as Nasdaq 2000, Nikkei 1989, gold 1980 (last 3 solar maximums). I anticipated that commodities would be the speculative target for this solar max but there is reasonable evidence that such speculation froth is taking place in equities, as the next 5 charts show.

Firstly, Hussman’s long standing bearish call on the markets has to be taken with a pinch of salt, but the ‘bubble’ technical overlay shows what could be occurring:

17nov6Source: Hussman

Secondly, the steep wedging of both the SP500 and volatility indices is also indicative, and suggests both could be heading for a pop:

17nov5Source: Chris Kimble

Third, the situation for free cash in margin accounts together with margin debt levels reveals a dangerous extension, which is also suggestive of excessive speculation:

17nov3Source: Dshort

And fourth, a lack of hedging to go with that:

17nov2Source: Sentimentrader

Finally, fifth, the rally is now much more weighted into the hands of traditionally ‘dumb’ money rather than ‘smart’ money participants:

17nov1Source: Sentimentrader

On the flip side, we do not see significant deterioration in breadth nor rotation into defensives that would ordinarily warn of a top in the markets. The next 2 weeks are the positive lunar fornight so there is a reasonable chance that equities continue to rally through that period, and indeed could feasibly carry that through the traditionally strong Xmas period into the beginning of 2014. I believe the technical breakouts and steepening trends in stock indices together with the solar-inspired excitement could potentially make for a parabolic finale here. It’s a tough one to call because of the extremes already reached in some of the indicators above. Complacency is high and it has been a long time since a 10% correction. Stocks are also overvalued, historically, as the Q-ratio and CAPE reveal:

17nov7

17nov8The 2000 outlier shows how much further overvalued stocks could feasibly yet become, but that anomaly aside we can see that by both measures warning signs are flashing. What could tip the market over? Rising rates (bond yields are back on the rise), an inflationary shock, or a deflationary shock. Normally, stocks would tip into a cyclical bear under excessive inflation. Right now we see the opposite. Take a look at the rate if disinflation in Europe:

17nov9Source: Yardeni

Add to this a crisis emerging again in emerging Europe, and I can see a case for the ECB taking to QE. If that were to occur, then maybe commodities can catch a bid again and make their speculative rally, under a brief but significant inflationary shock. Chris Carolan’s solunar model for crude oil paints the possibility that oil could come back here:

17nov12

Source: Spiralcalendar

If the whole class cannot rise again, then precious metals alone could, under a deflationary shock, i.e. the world tips into a deflationary recession. This could occur with further commodity falls dragging global inflation rates yet lower. Emerging markets such as India and Brazil are in trouble again with low growth and high inflation, sinking currencies and debt problems. And leading indicators suggest global growth could be tipping over as of year end in the developed nations:

17nov10Source: Moneymovesmarkets

Under deflation, equities would normally fall hard and fast, to the lower ranges for CAPE and Q ratio above. That would likely mean sub 2009 lows in nominal terms. But under inflation, equities normally more slowly wind down to those valuation levels, and in nominal terms the damage is less severe. Under deflation the US dollar should rally, whereas under inflation the US dollar should break down. The US dollar was on the cusp of a major breakdown several weeks ago but has since rallied away from oversold and overbearish conditions, leaving both possibilities on the table, and its performance from here should be a key signal.

Right now, the deflationary outcome looks the most likely, which would make a short on the stock indices a very tasty trade. However, before that there is the potential for stocks to climb further, and possibly at an increasing trajectory. That makes for difficult timing. With the positive lunar fortnight right ahead, and momentum still with equities, I am expecting stocks can rally further in that period, barring any external shocks. But with various high danger levels already reached for this stocks bull, I am looking to build short here, not chase long. Regarding commodities, I continue to watch and wait, still long the complex, but not adding. I believe precious metals will come again, due to the unprecedented demographic downtrends, but am less sure about the broader complex due to the demographic impacts on demand. But let’s see – the moment of truth draws nearer – see below – and I don’t want to try to front-run or second-guess it. A speculative and final rally in commodities remains a possibility whilst the complex continues to consolidate up high. Yet if they cannot rally, and break down below the major support, I believe the global tipping into deflation will accelerate and kill equities in due course.

17nov14Source: Martin Pring

Latest

I’m on holidays, so just some updated data below.

Sunspots still high, adding weight to possibility of solar max still ahead – modelled versus SP500 here:

29oct20131

Geomagnetism forecast extended for next 3 weeks, overall still flat – modelled versus commodities index here:

29oct20132

FOMC output tomorrow, new moon on Friday, lunar negative period begins the start of next week.

Economic surprises falling in US and Europe, improving but negative in Japan, and positive in China:

29oct2013329oct20134

29oct20135 29oct20136Leading indicators for the US falling:

29oct20137 29oct20138

Update

Stock indices rose into the full moon, making for a third consecutive lunar inversion. Here is the updated lunar-geomagnetic model versus the SP500:

21oct20131Forecast geomagnetism is fairly benign and we are now into lunar positive fortnight, however the three back-to-back inversions leave me less confident as to the direction of the stock market. Normal service may resume here (i.e. a two week uptrend) but the triple inversion maybe has some significance.

Breadth broke out, as in Advance-Declines:

21oct20132Source: Stockcharts

This development casts doubt on a stock market topping process. However, other developments have added weight to my criteria list for a top (last post), namely treasury yields fell again, commodities indices edged up again, ECRI leading indicator growth fell further, narrow money leading indicators for the G7 have worsened, Citigroup economic surprises for the major nations have all turned into downtrends, bar China which has turned flat. Here are the CCI and CRY commodity indices:

21oct20133


Source: Bloomberg

Still tentative uptrends short of momentum, still too early to say if they are going to take off. Crude oil has flattened out but is still in a downtrend for now, whilst gold broke up beyond downsloping resistance on Thursday and held the break on Friday:

21oct20134

Follow through is still required though, so also tentative but more promising.

The result is I am watching the markets at the start of this week: can stocks rally and the SP500 break upwards out of its wedge on good breadth, or is another pullback going to come to pass (earnings revenues disappointing so far but the season only still getting under way); can commodities (particularly gold) rally and gain momentum; can the US dollar break beneath another support level at 79 (expectation has switched again to no QE taper in the near term)?

For a more definitive judgement on whether equities are topping cyclically we need more time, and more developments. On balance I believe we are in the early part of a topping process, pending further evidence. Next we would require a deeper correction ahead to produce a lower low, followed by a rally back to the highs whilst leading indicators fall. Rising commodities would normally play a role too, and if they are in a new uptrend, they need more time to rally some way higher. But all this could take weeks or months to fully develop.

I am also watching the sunspot count as the sun has woken up again. If the solar max is still ahead then we ought to see a sustained period of higher solar activity.

21oct20135


Cyclical stocks bull top?

Weighing up whether the equities bull market that began in 2009 is topping out here, we can look to fairly reliable historical topping signals, and I can summarise as follows:

1. A topping process, normally months, with reversals of reversals of reversals in a range – yes, up and down legs since May within overall range

2. Evidence of overbought and overbullish extremes (such as RSI and sentiment surveys) – I found this not to be too reliable as an indicator once the topping process has begun, but nonetheless, investors intelligence bears would be one such current reading – click here for link

3. Breadth divergence – yes, advance-declines or Mclellan summation index would be two

4. Cyclical sectors topping out before the index top and money flow into defensives – nope, not happened meaningfully yet

5. Major distribution days near the highs – we have had some 90% down days since May

6. Yield curve flat or negative – since the debt impasse began, treasury yields at the shorter end of the spectrum have indeed inverted, the longer end remains healthy

7. Tightening of rates through rising yields – we have seen a doubling in treasury yields over the last 6 months

8. Excessive inflation – nope, we are seeing global disinflation

9. Rolling over of leading indicators and recession model alerts being produced – combining OECD, Conference Board, ECRI, narrow money and Recession Alert, we don’t yet see this in any meaningful way

10. Market valuation excessive – measures such as the Q ratio and cyclical p/e show the US to be currently overvalued, whilst globally speaking valuations are within normal historic range (however, by my work this is relative to demographics and as such USA and Europe should get cheaper)

In summary, we see some warning signs of a top in progress, but not yet a full set.

To be clear, not all cyclical tops are a process. Some are parabolic manias that end in a spike, with a similar crash down the other side. Examples link here.

However, we don’t see parabolic rises in equities in global stock indices currently, and if this is a top being formed currently, then it is of the topping process type. The 2000 and 2007 tops were topping processes, as were the multiple tops around the 1970s.

What I have found about the topping processes is that when the topping range began, there were precious few topping signals present – as if the stock market were as competent a leading indicator as any other. But when the topping range ended – the last push up – the majority of signals were clearly present. I have highlighted the 2000 (Mar-Aug) and 2007 (July-Oct) topping ranges on the charts below to show this.

First, OECD leading indicators – downtrends in evidence by the end of the topping ranges

14oct20131

Second, ECRI leading indicators – by the end of the topping range had fallen through zero
14oct20133


Third, treasury yields – rising prior to the topping range, then falling once topping range in progress
14oct20134

Next we see the topping ranges on the SP500, which if you zoom in, had different shapes in 2000 and 2007 but in both cases there was a last push up to the highs, with many topping signals present, before the bear began. I show here what happened with commodities – both times topping after the stock market. In 2007 commodities only took off once the equities topping process had begun, so there is the potential for that to occur now, but it has to happen without delay if this is a top.14oct20135

Fifthly I show US housing, declining into the market tops. The recent drops in new home sales, related to the increasing mortgage rates, could be similar if it continues.14oct20136

Sixth, US GDP – again clearly in a downtrend by the end of the topping ranges, so should look for the same this time14oct20137 Seventh, margin debt. We see a similar overthrow rally in margin debt recently as per the 2000 and 2007 tops, and again margin debt was in a clear downtrend by the end of the topping ranges so should look for the same to occur
14oct20139 In short my message is this. If this is a topping process in equities, then we should see a further leg up ahead where the bulk of these indicators have moved into clear downtrends. We have certain topping signals already in place, but the rest should fall into place ahead if this is a topping range. It means a golden opportunity to go short would be following a further leg up in stocks against the backdrop of these remaining indicators having turned. If this is not a top in equities, but a consolidation before further gains, then we should break free from the range, and the topping indicators in place one-by-one cease to be.

I want to end by commenting on the global disinflation in place currently. This to me is consistent with demographic trends, and is the threat to a commodities rally coming to pass. If commodities can’t rally as per historic topping order norms, then I would point to the unprecedented collective demographic deflationary trends in place now.

As inflation levels drop in the major indebted economies, the danger is that inflation drops below yields making the massive debt effectively grow bigger. Central banks would then need to intervene further to suppress rates or initiate inflation, perhaps by increasing QE. If, on the other hand, commodities become a speculative rally target here, then inflation will increase but the move would have detrimental impacts on the economy. Central banks would again be bringing out the toolkit. It’s the trap that I referred to before. Can instead the goldilocks scenario continue, of low growth, low inflation and equities rising, with the Fed able to slowly ease out of QE? I personally can’t see it, because it is such a fragile position. Rallying yields or rallying commodities or government pullback on stimulus/spending would likely tip the fragile economy over, and I believe one or more of those will happen in due course. It would take stronger growth to prevent this, and I don’t see it can occur against the demographics.


Stock Indices, Commodity Indices

Here is the CCI commodity index and the CRY (Thomson Reuters) commodity index. All I can say is the combined picture for the two still remains unresolved.

11oct20131Source: Bloomberg

The possible breakout and end to the 2011-2013 bear market should be clear to see, but at this point it hasn’t done enough, and a breakdown beneath the horizotnal support could still come to pass. Looking at individual commodities within that things aren’t much clearer. Gold and silver could be basing currently, or it could be weak action before further falls. Crude oil dropped sharply on Wednesday, looking bearish for the commodity indices, and then rose sharply on Thursday, looking bullish: confusing action. Certain agri commodities have broken out of their downtrends, others not. Simply put, we’re just going to just have to wait longer to see which way the complex is heading.

Turning to stocks, US equities have underperformed since the government shutdown, correcting more than other country stock indices. A sharp and broad reversal upwards yesterday made for what looks like a fake-out (failed breakdown) on the SP500 that is normally bullish, and puts the German Dax, Aussie ASX and Hong Kong Hang Seng (as examples) all back flirting with major breakouts:

11oct20132 11oct20133 11oct20134 11oct20135The 90% up-day in the US yesterday, together with the break back into the wedge is typically bullish, whilst acknowledging that nothing has been resolved on US shutdown or debt ceiling, and developments or non-developments in that arena can still buffet the market around. Nonetheless, the broader market action is still showing signs of a cyclical topping process: the volatile moves up and down since May, the divergence in breadth, the overthrow moves in nominal price and margin debt this year which echo 2000 and 2007. Here is the SP500 on a monthly view with a momentum indicator:

11oct20136It is typical at the end of a cyclical bull for the market to lose momentum as buying is exhausted, with alternating and short up and down legs in a range at the top, before selling in earnest begins. The momentum indicator has made three lower highs since May. If this is a cyclical topping process then any further leg up should be weak, with more loss of momentum, more new percentage new lows, narrower market participation. If this is not a cyclical topping process then we should see the opposite: strong rallying with renewed momentum and broad participation, breaking away from the range in play since May. From a technical perspective, looking round major indices such as the Dax, ASX and Hang Seng, it should be clear how such strong rallying could erupt from collective major breakouts. However, I believe the weight of evidence instead supports a topping process unfolding, pending further developments, and as such believe the danger lies in long positions rather than short.

*Update*

Below, gold and silver secular bull market charts (from Robert Williams, hat tip Roger Reynolds). Both have primary uptrend still in tact. Gold has corrected to the 38 fib, silver to the 61 fib (silver acting as a leveraged gold, both up and down). Gold could yet correct further to the 50 fib and meet the rising primary support, circa $1100. However, gold corrected around 33% in 2008 and then resumed the bull, and has corrected a similar percentage this time round. Drawing these factors together, we would appear to be at a key make-or-break point for precious metals, similar to (and playing into) the picture on the commodities indices.

11oct20137 11oct20138Source: Robert Williams / Stockcharts


Update

I’ve been busy with the shift of focus, towards shorter term trading. I advised recently that a poor year for commodities threatens my year end PnL, so pending the validation or invalidation of solar cycle and demographic theories, I am taking action to try to ensure a good year-end figure. What this means in practice is (i) taking profits on markets where applicable (ii) using shorter term indicators and leverage to bring other positions to profit and then close out and (iii) as the range of markets I am involved in narrows, attacking the remaining markets, plus (iv) trading in and out of other opportunities where I see them. So I am gradually reducing the range of markets I am involved in whilst leveraging up on the remaining markets: a combination of decreasing and increasing exposure to keep risk levels satisfactory. And no longer term strategic positioning any more – that will be resumed following this exercise. It’s an enjoyable challenge, as I haven’t used this approach for some time. No guarantee of success though, and only in the early stages.

It remains to be seen whether the solar peak is ahead or behind us, and if it is ahead of us whether the anticipated correlated commodities peak will occur. It is also still not yet clear whether commodities are changing trend into an uptrend, or still in a bear market since 2011. Below, both commodities index and sunspots versus Sp500.

8oct20131

8oct20132Similarly unclear yet is whether equities are in a cyclical topping process. We see breadth divergences, but not yet deterioration in leading indicators. We see the kind of price oscillation within a range that would mark a top, but as yet no real marked shift in sector performance that would be typical of a top. By my demographic work, we should tip into another global recession and equities bear in due course, but it would be historically typical if this was triggered by tightening: bond yields rise too far (not yet there) or government cuts back on spending/stimulus. On the latter, the US government shutdown, if prolonged, threatens to do the equivalent job of reducing government spending; or the government may agree to spending cuts to raise the debt ceiling (deadline Oct 17th); or the Fed may taper QE (next FOMC output Oct 30th). The near term prospect of a taper looks less likely with the government shutdown potentially shaving off GDP, but it remains out there as unknown, and on that note, commodities typically perform historically (as shown in the first chart above) once equities have topped and the economy has topped, once rate cuts are underway. Clearly that isn’t our current scenario, which adds to the uncertainty over commodities. Plus, again referring to demographics, we have an unprecedented collective global downtrend in place which could potentially overwhelm any possible commodities/inflation rally. Which brings me back to the start: nothing has been validated or invalidated yet in terms of solar, demographic, commodities, equities, bond yields and government spending/stimulus. Gradually developments in all these areas will make it clear, but pending that, my focus is making money shorter term.

So to the near term. Below I show the position of the SP500: at support in a rising wedge. That rising wedge could spell a breakdown ahead, but first a bounce may be in order.

8oct20133The US government shutdown and debt ceiling uncertainty is affecting market sentiment, but news of a likely agreement could at any point provide a relief rally. If the impasse remains however, then the next two weeks are the negative lunar period which takes us up to the debt ceiling deadline and could therefore keep downward pressure on stocks.

Below is the latest geomagnetic-lunar model versus the commodities index. The geomagnetic trend has flattened out and has a positive edge looking out over the next 3 weeks. Indeed we are into the last quarter of the year, where we typically see more benign geomagnetism and positive seasonality for pro-risk (which I believe are correlated). If equities are not yet making a cyclical top, then there is both a backdrop and a time window in which to rally away from the price range of the last few months.

8oct20134The US dollar is flirting with major breakdown, but arrives there oversold and overbearish. A breakdown would add weight to a commodities rally, so I continue to watch. Crude oil is typically the main driver of an inflationary commodities rally and looks to have formed a short term low over the last couple of sessions. I am watching that too, as further drops back into the range of the last couple of years would cast doubt on commodities making a meaningful uptrend.

*Updated short term lunargeomagnetic model versus SP500 10 Oct*:

8oct20135

Charts To Start The Week

Last week, stock indices largely printed bearish shooting star candles (on a weekly view, up into and on FOMC output then reversal of gains Thu and Fri), which also looks like a potential lunar inversion, and a potential important Equinox reversal too. The Equinox was 22 September to be precise, and Gann found this date/event often marked major tops in history (on or very close). Chris Kimble has also produced this (hat tip Gary) below, and notes last week produced an all-time record for inflows into equity funds worldwide:

23sep20136

Source: Chris Kimble

As various stock indices were at important breakout levels, and ended Friday retesting those levels (having jumped above then fallen around the FOMC), then a breakdown in the first part of this week would make things look more bearish, because we would have a shooting star fake-out and more of a trend supporting lunar / equinox reversal.

Chris Puplava pointed out overbought signals as other reasons for a pullback (although he still sees no threat to the ongoing bull market). I have added vertical lines to his summary picture to view more clearly what happened to the SP500 on previous occurences, namely sharp uptrends gave way to more sideways ranges:

23sep20131Underlying Source: Chris Puplava

Leading indicators remain overall positive. For example, US CB and ECRI leading indicators were both good readings last week. This is supportive for stocks. On the flip side, we have seen some breadth divergences, which would be one topping process sign, and we know margin debt is at lofty levels.

Here is the latest geomagnetism forecast (with lunar oscillation). Overall flattish, but with a slight upward bias. I noted previously that the lunar positive fortnight from today plus the relatively benign geomagnetism could make me long-biased. However, if we have seen a lunar inversion then we could see down rather than up this week, which would negate that edge.

23sep20138Let me bring in commodities. When stocks retreated in July/August we saw commodities gain interest, which was also a potential sign of a topping process in stocks, as historically we have seen commodities rally last as (and after) stocks top out. Since then we have seen money flow back the other way. This is how we stand on the CCI and CRB commodity indices:

23sep20133

23sep20132Underlying Source: Bloomberg

Hopefully it is evident from the two charts combined that commodities have the potential to break into a bull rally here. However, it is just potential, and time is of the essence. If the CRB is to break upwards then it has to make the current backtest of the breakout stick, and pull upwards from here.

Here is the US dollar index. See how it has arched over and is now threatening breakdown. A bearish break would benefit commodities and provide one ingredient for that potential rally.

23sep20135Underlying Source: INO

Also, here is a chart from Chris Carolan showing how the Euro has the potential to escalate against the USD based on relative central bank money printing:

http://spiralcalendar.com/wp-content/uploads/2013/09/092213eurbal.gif

As the Euro is the biggest component of the US Dollar index, that then is a possible breakdown catalyst.

Another factor for commodities is China, as their biggest consumer. Today’s Markit manufacturing PMI came in at 51.2, a 6-month high for China. The stock market has also picked up the last two months and has the potential to run up to the top of this channel:

23sep20134Underlying Source: Cobra / Stockcharts

The most bearish assets (in terms of public opinion) of the current period are corn, wheat, oats, soybean oil and coffee – all agricultural commodities. The volatiility index for stocks (Vix), and treasury bonds, are down with them at bearish extremes. So, if we are to see a mean reversion – which is likely, but the timing is the difficult part – then it would be into commodities and out of stocks (Vix rises).

Lastly on commodities, my solar maximum correlations remain potentially in play, if the smoothed solar maximum is ahead of us. Sunspots are back up to the 100-mark currently so the sun is showing some life again, and certain analysts predict another sunspot peak ahead around the turn of the year. I have established that experts typically agree on the solar maximum once the solar magnetic flip is complete on both poles. The sun’s north pole switched polarity in May 2012, but the south pole flip is still ahead and likely within the next few months. So we should know for sure by Q1 2014. Either an end of year sunspots rally will produce a new smoothed maximum for SC24, before the final polar flip, or the pole will flip and Feb 2012 will be cemented as the solar max. By my research, a commodities rally over the next 6 months to a new index peak would fit with the former, not the latter.

In summary, the research for this post has produced a bias against stocks and pro commodities. As you know I am long commodities so disclaimer as always. However, I was also net long equities and have taken some profits on the long side. If stocks rally to new highs this week, and on good breadth, then much of the bearish case would be negated. If commodities sag further into the end of September, the rally potential in the commodity indices would fade.

Stock Indices

Major global stock indices are attempting major breakouts:

17sep1

17sep2

17se3

17se4The Dax broke above its recent range yesterday, and the FTSE is flirting with its all time highs. The US indices are further advanced, having already made and held overthrows earlier in the year, and whilst the SP500 and Dow could still feasibly be carving out a topping range, the Nasdaq 100 shows no signs:

17se6Indeed, recent strength in tech has cast doubt on the transfer from early to late cyclicals, which is one topping process sign normally:

17se8

Source: Bloomberg

Homebuilders, another early cyclical, have also pulled up sharply. The other two shown are materials and energy sectors, late cyclicals, which over the last week have underperformed relatively. This casts some doubt on the topping process.

Recall we saw some topping signs present, and some absent. One topping signal was breadth not making a new high in August with the SP500, as shown:

17se7Source: Stockcharts

Now if breadth rebounds and takes out that double top it would negate this, and I’m wondering whether that’s what may now occur. Following the FOMC output tomorrow, we have 2 weeks of positive lunar pressure with a positive geomagnetism forecast to accompany. As per my speculation, I wonder whether taper-light with supportive wording will be the catalyst for a breakout in global indices and a 2 week rally, pushing any topping process further out in time.

It’s a difficult call because, to be clear, there are indeed some warning signs. If European and Asian stocks are turned down away from those major resistance levels, and the SP500 and Dow turn back down into their ranges, then technically a topping process will look more compelling. Margin debt is frothy, put/call ratios are frothy, certain indicators of Martin Pring are on the edge.

But, new highs – new lows do not signal a top at this stage. We don’t as yet see excessive rises in oil or bond yields. Leading indicators continue to point to broad sufficient strength into year end. Economic surprises for emerging markets have turned positive. In short, I am wondering whether a topping process in equities is going to be postponed for now, and we see another breakout rally first. If we see degradation in leading indicators, sharp rallies in oil or bond yields, or the US pulling back too sharply on QE and government spending (debt ceiling) then I would feel more confident predicting a top. For now things look too benign. Of course the Fed could surprise us tomorrow with an aggressive taper programme, but the continued relative historic weakness in the economy does not support it.

I side with the historic norm and predict rallies in oil (inflation) and bond yields will tip the economy and equity markets over in due course, but at the moment neither are threatening enough. If that scenario doesn’t occur then I predict demographics will tip the economy and asset markets into deflation, with the help of the Fed pulling back on QE/spending. So, the former would be an inflationary tipping into recession, the latter a deflationary turnover. For now though, whilst there are warning flags, we don’t appear to be sufficiently down either path to tip equity markets over. Your thoughts?