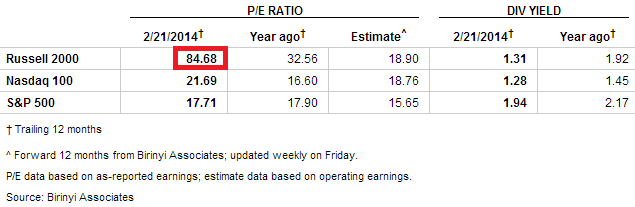
Just as the defining sector of the 2000 solar maximum speculative mania was Internet, a case can be made for both Small Caps and Biotech as defining manias at the current solar maximum. In 2000 the Nasdaq Composite made a parabolic blow-off and hit p/e >80 as companies were ‘revalued’ on expectations rather than earnings. The Russell 2K currently trades at p/e >80 and the index of Biotech companies trades at p/e>160, with both having a significant weighting of companies trading on expectations.
The Russell 2K trades at its most expensive historic valuation:

Source: Karla Tango
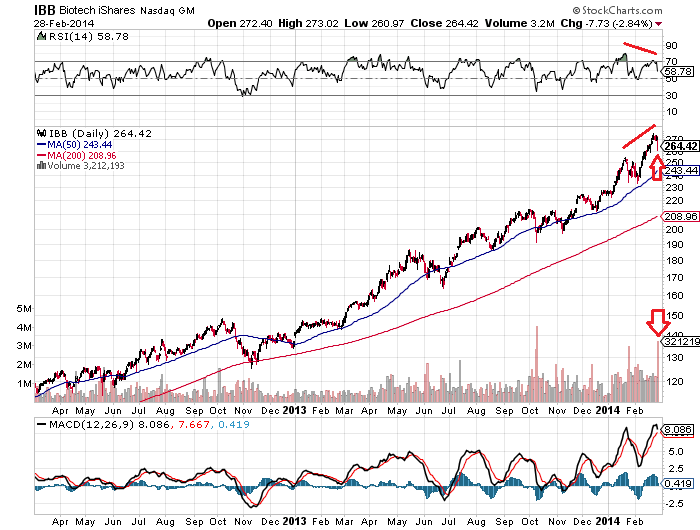
The Nasdaq Biotech sector is in a parabolic trajectory signalling imminent exhaustion:
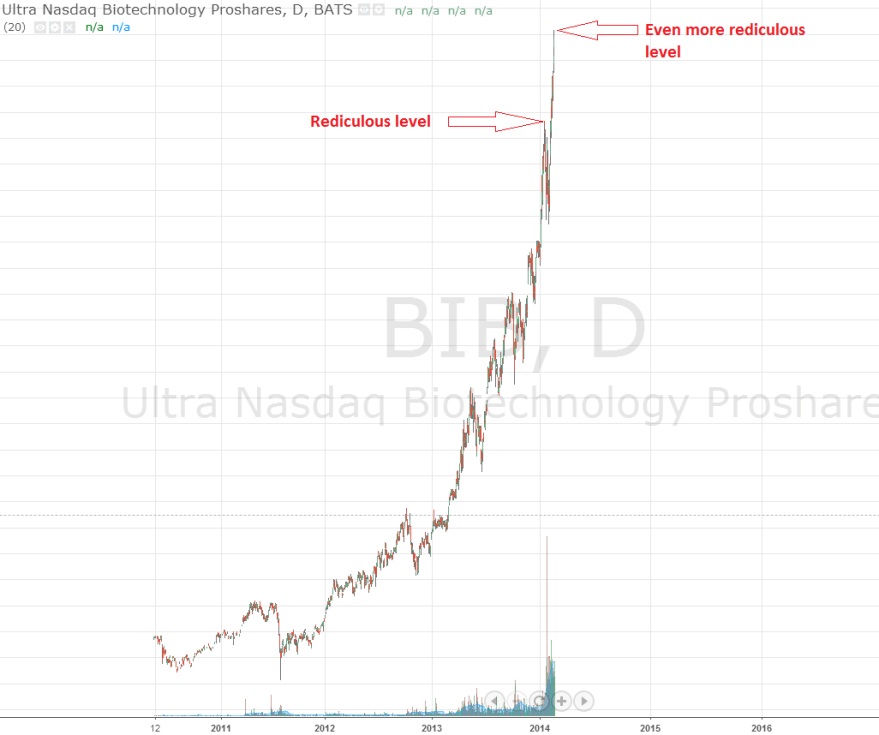
Source: Blogspot
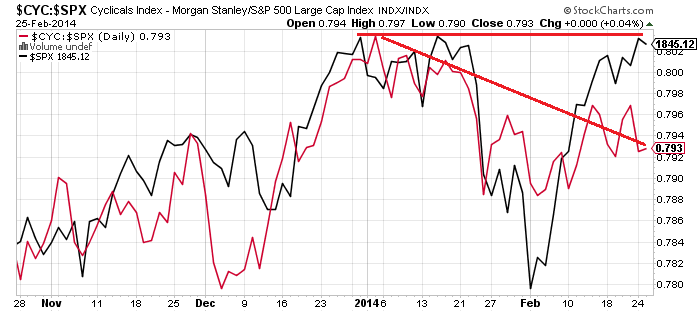
Marrying the two, the strength in the Russell 2K in 2014 has been dominated by Biotechs:
 Source: Bespoke
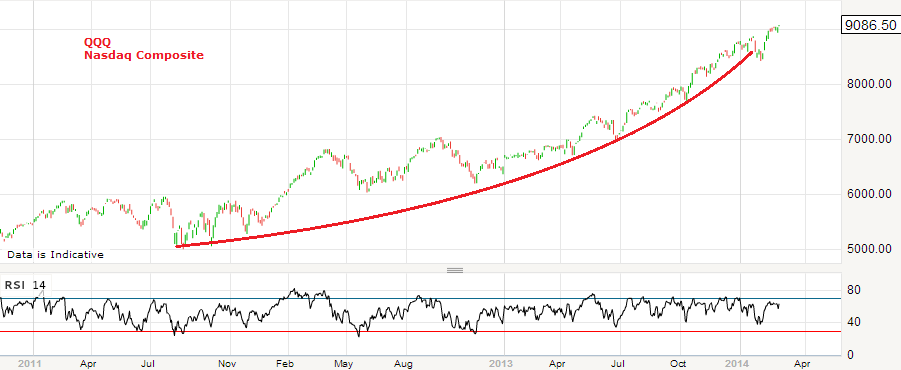
Similarly the Nasdaq Composite has been significantly driven recently by Biotech strength. So a pop in the Biotech bubble would have significant ramifications for the Russell 2K and Nasdaq, and the wider markets.
On Friday, Biotech had a significant down day on high volume, having built up a negative divergence in RSI:
 This occurred at the new moon and as we head into the inverted geomagnetic seasonal lows of March and April. Add in the near vertical trajectory of the parabolic on the longer term view and we have the potential for a top having occurred on Friday, but subject to follow through next week.
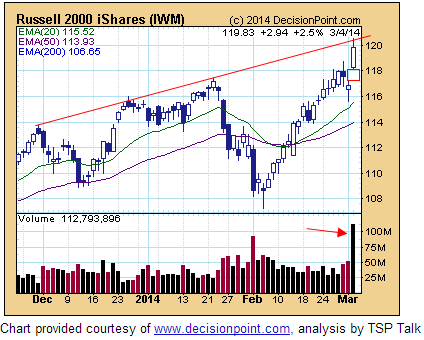
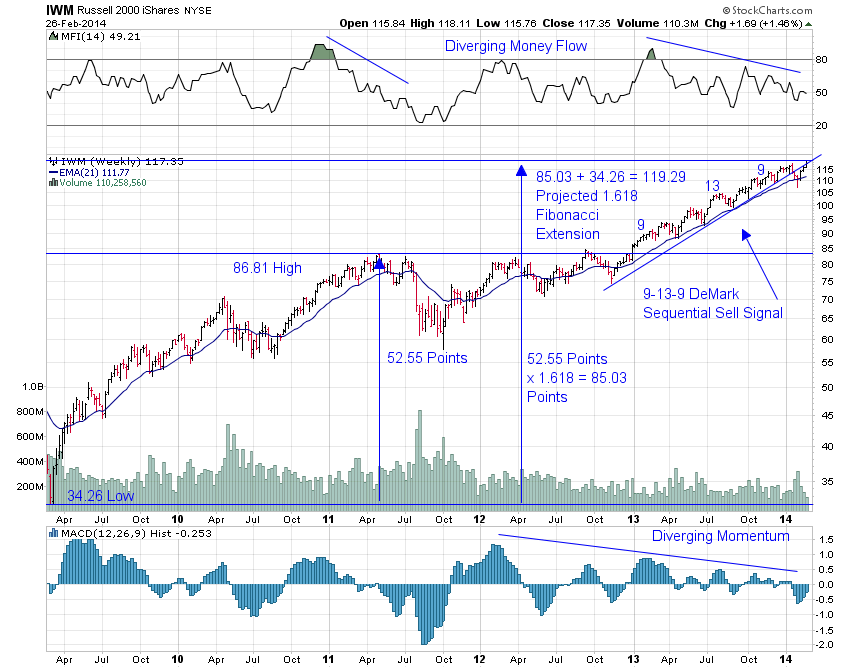
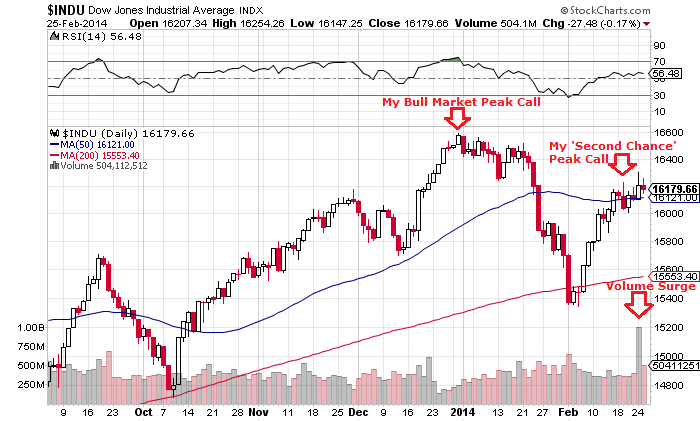
Similarly, the Russell 2K experienced a high volume reversal on Friday and shows other topping signals:
 Source: Stocktwits
To further judge the likelihood of a top, a key question is: could the R2K and Biotechs rise materially higher yet? Whilst we cannot calculate a precise answer to that, we can look to various indicators to build up a case for a limit.
The Biotech sector has risen approx 150% in the last 2 years, which is very similar to the gain in the Nasdaq Composite from 1998-2000. Real margin debt and net investor credit have both now exceeded the 2000 market peak (and 2007 peak), whilst real margin debt to GDP is at the same level as the 2000 peak.

 Source: DShort
Citigroup’s panic/euphoria model, which aggregates short interest, put/call ratio, retail money funds and more, is above 2007’s peak but remains some way off 2000’s mania; whilst their CEM model points to a market correction right ahead which would fit with Friday having marked a peak:
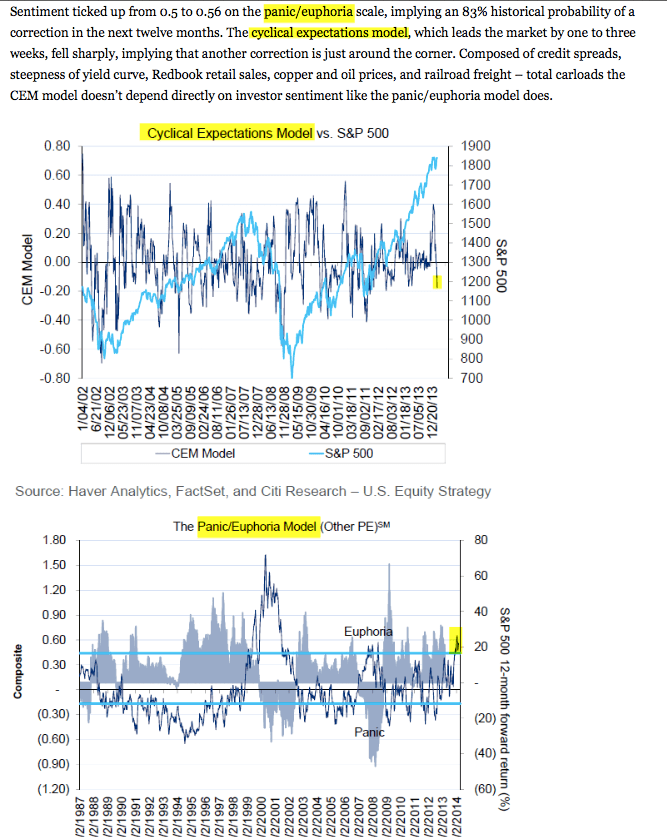 Source: Citi / Fat-Pitch
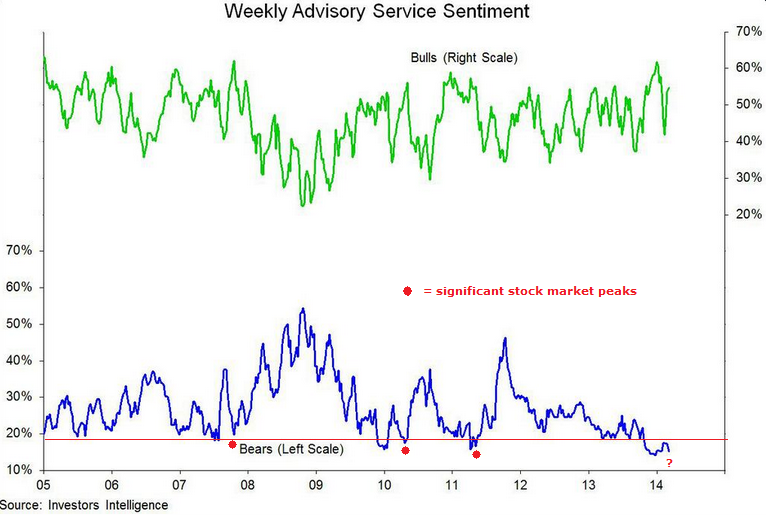
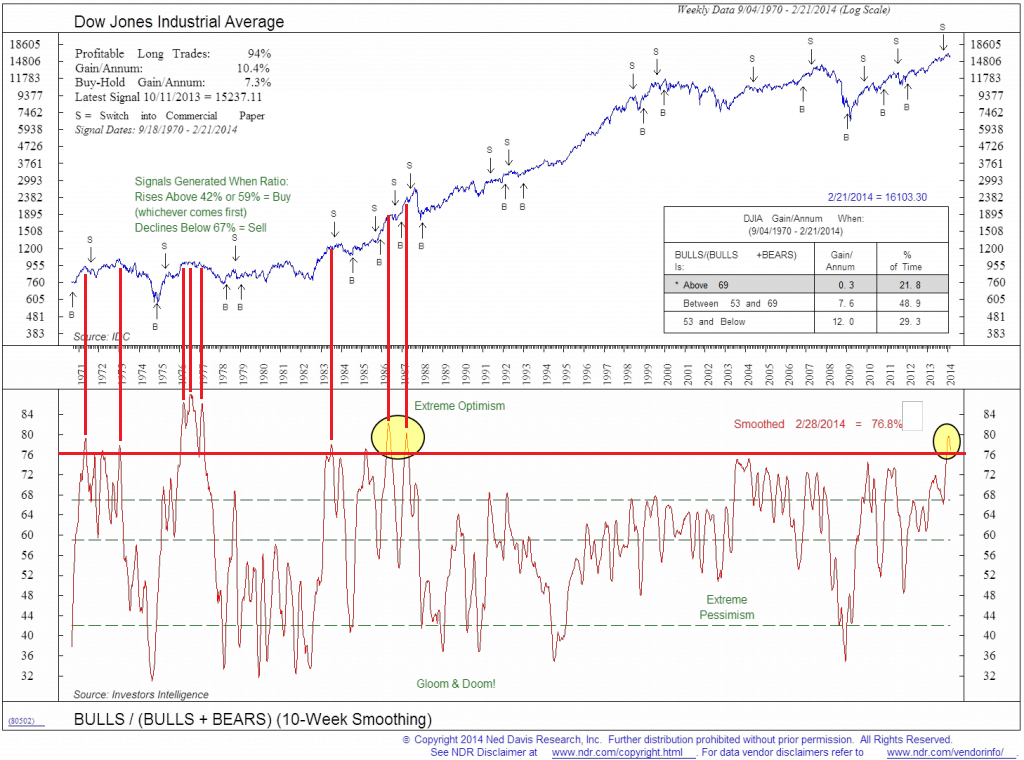
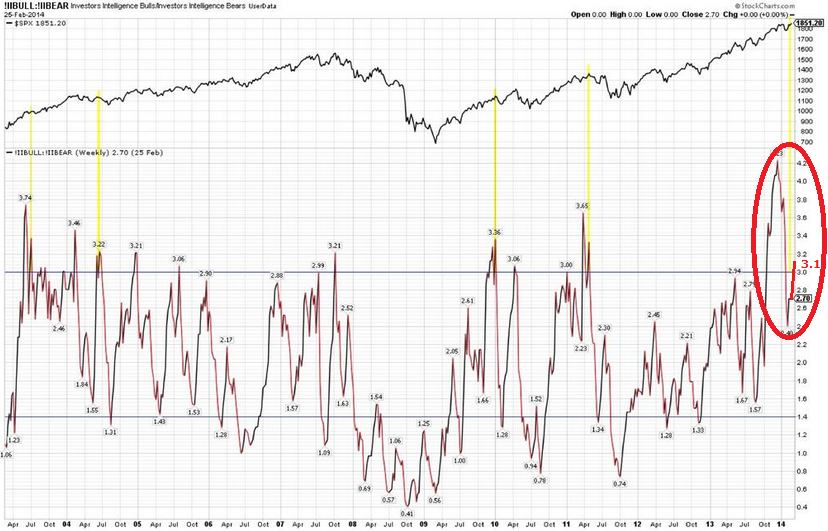
Sentiment as measured by Investors Intelligence with 10 week smoothing is above or at levels that have previously marked tops, with an exception in 1986-7 where the market first rallied higher for several months before ultimately crashing.
 Source: CMG Wealth
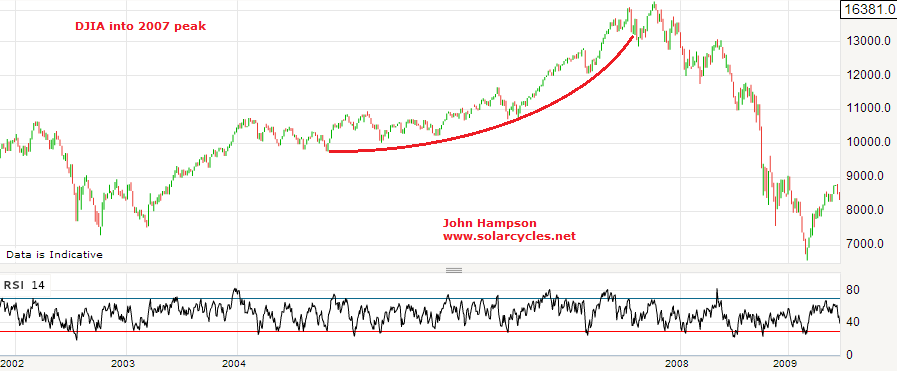
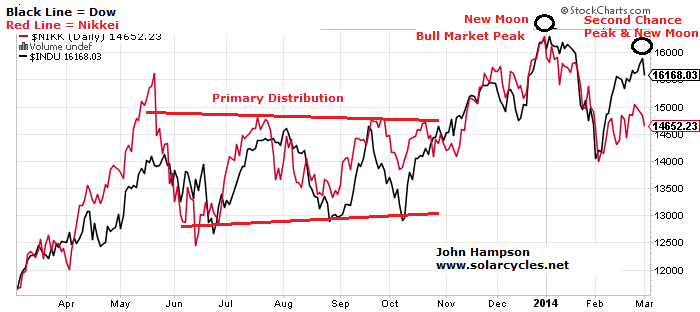
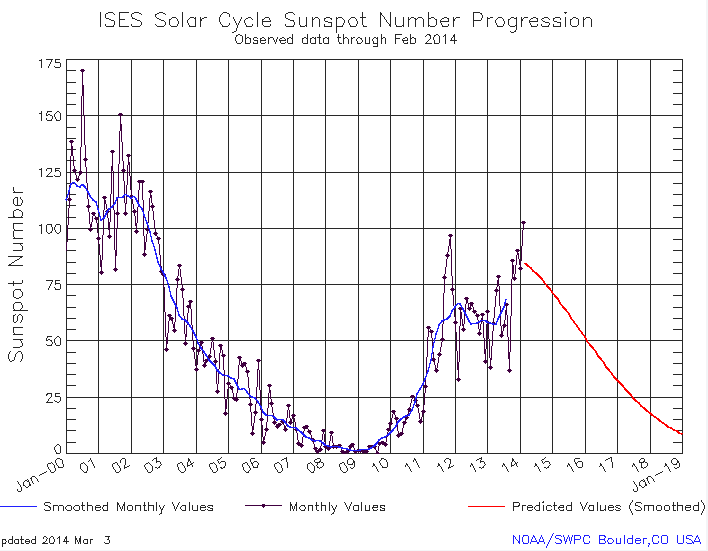
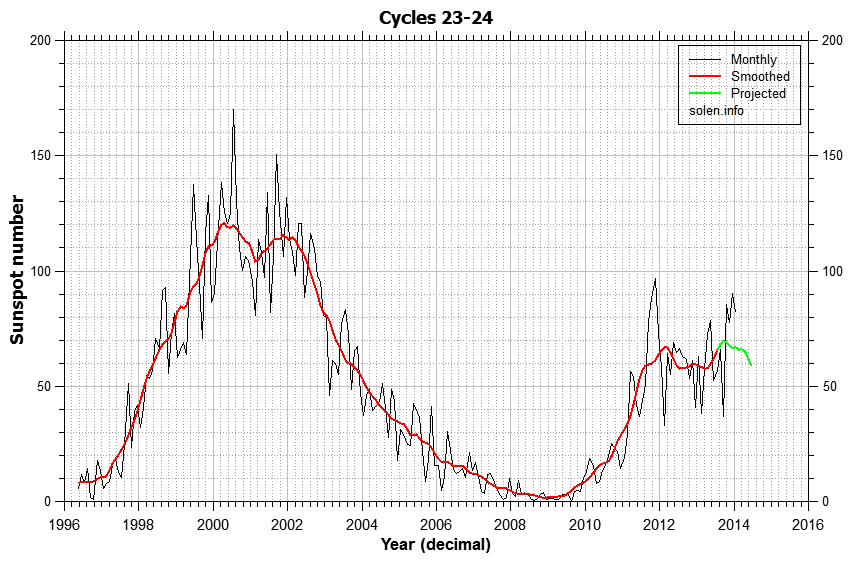
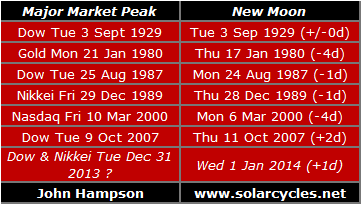
Solen’s updated solar cycle progress and prediction chart still suggests a peak at the end of 2013, which is consistent with the Dow and Nikkei having topped out then and other indices now rolling over to join, and my own daily sunspots chart also reflects this:

Source: Solen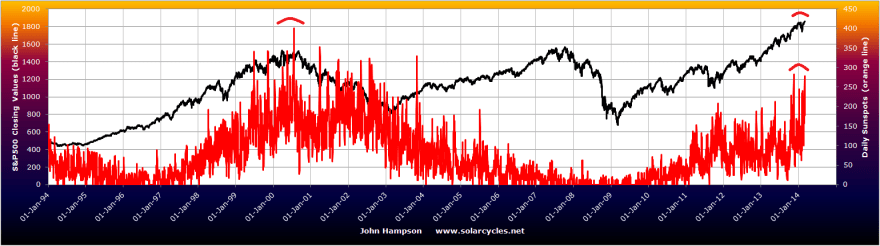
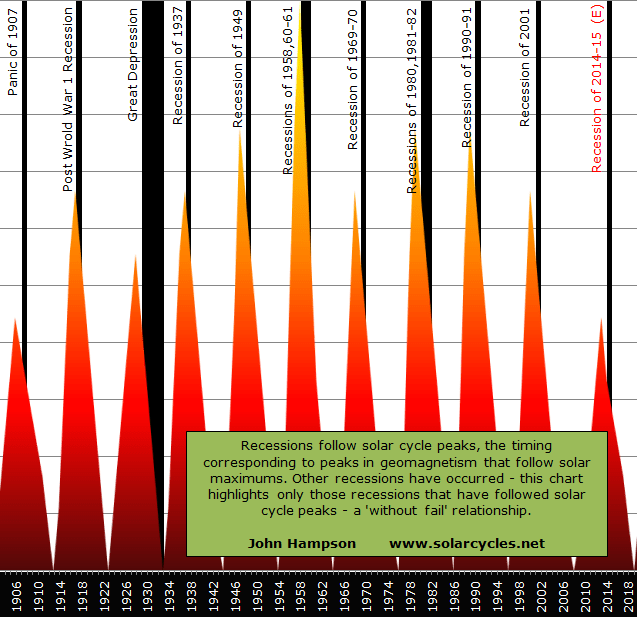
The waning of the solar maximum has historically given rise to a recession in the US. ECRI’s leading indicators rolled over in early 2013 and have recently reasserted that downtrend. Any further deterioration from here would suggest such a recession is coming, and that sort of timing would be a general fit with the business cycle:
 Source: DShort
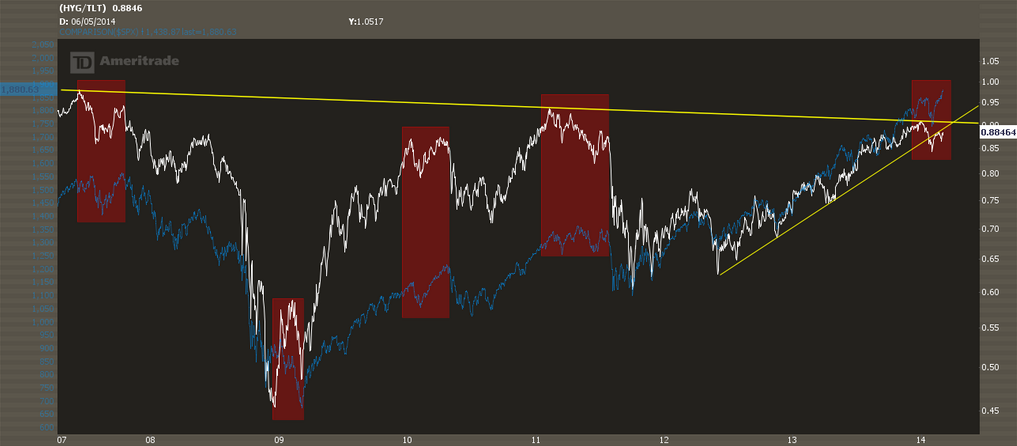
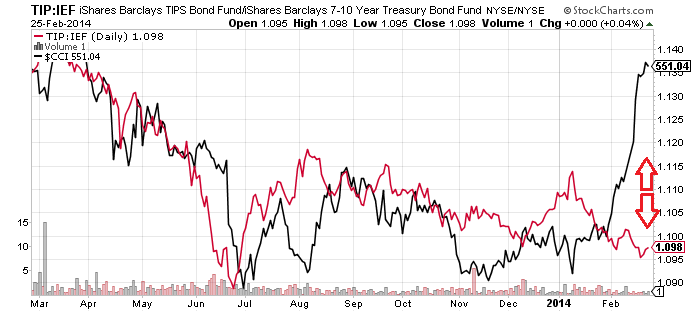
In keeping with that prospect, 20-year treasury bonds look to be breaking out following an 8-month basing:
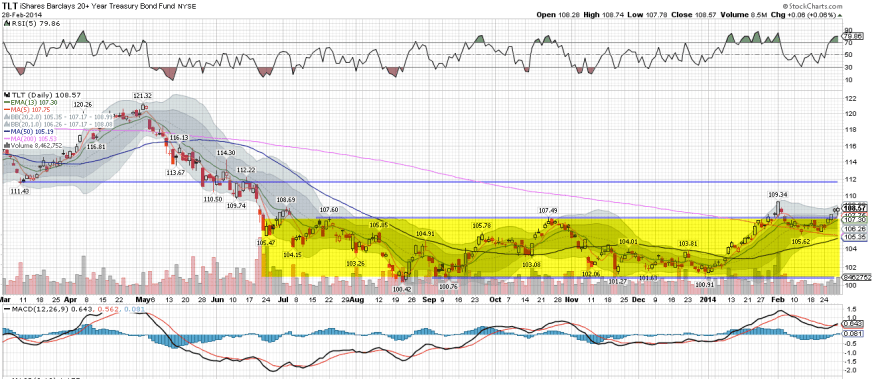 Source: Fat-Pitch
Drawing all together, I have a reasonable case for the Russell 2000 and Biotech to have peaked out on Friday, with the latter feeding into the former, and both into the wider markets. The Friday candles and volume and the negative divergences in both the R2K and Biotech suggest a peak. The Citi CEM, new moon and inverted geomag seasonal lows of March and April suggest follow through could then occur this coming week forwards. The rate of trajectory of the Biotech sector suggests terminal exhaustion should be close at hand, and that would then feed into the R2K’s fortunes as per the Bespoke table above. Valuations, leverage and sentiment collectively suggest significant further gains are unlikely. Solar speculative maximum timings suggest other US indices should now be ripe to join the Dow in rolling over, or more specifically began a topping process at the end of December which is now completing, and in so doing becoming leading indicators of a looming recession.