V-Correction Or Breakdown Part 2

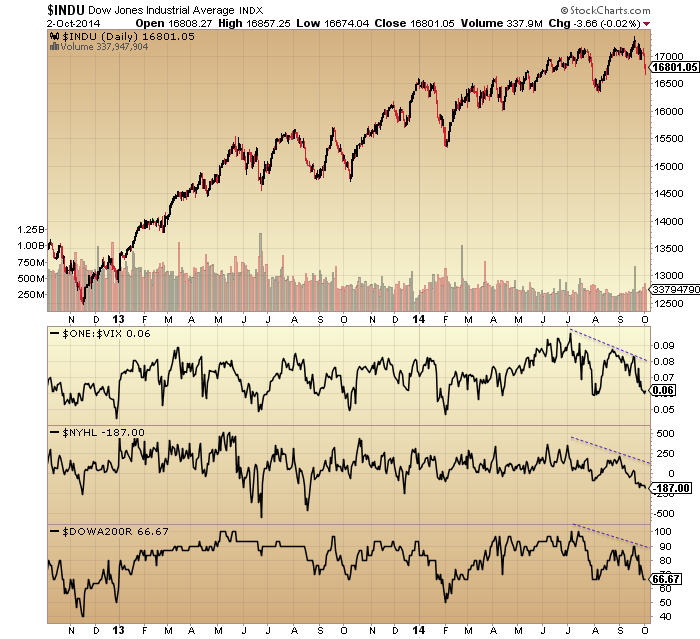
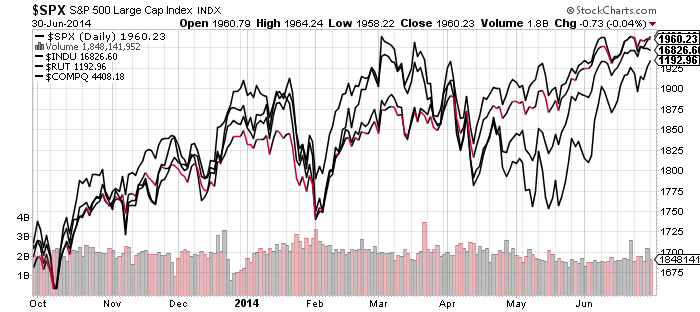
Tuesday’s selling to a lower low delivered the missing positive RSI divergence on the SP500 and out of that we saw a strong rally on Wednesday.

9oc1

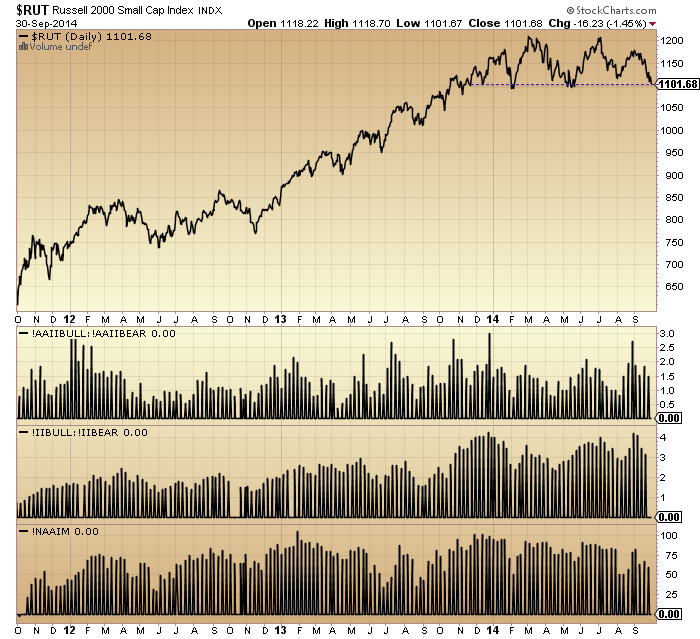
It was a necessary stick save for the bulls at key support in most indices, particularly the Russell 2000. So we are back to: is this another v-correction or just a save before a true breakdown?

There were clues behind the scenes yesterday.

The best performing sectors in the rally were the defensives: utilities and healthcare.

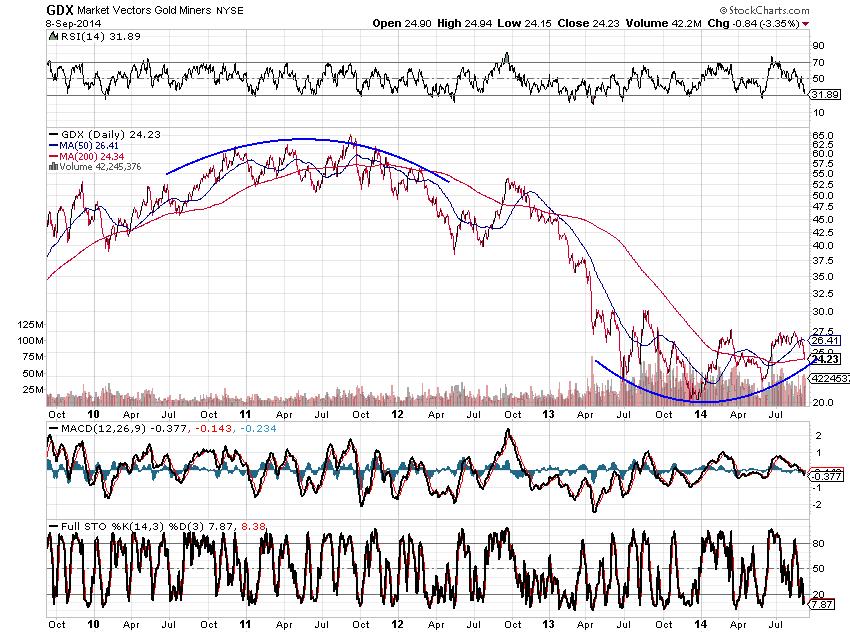
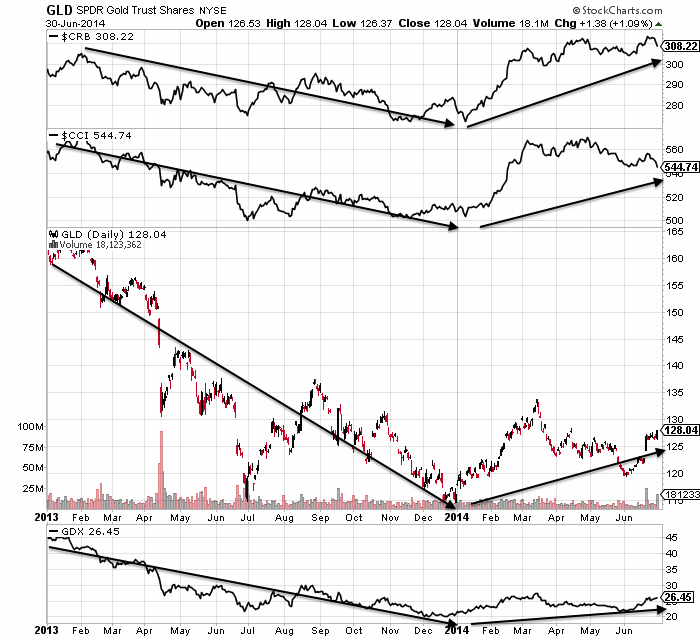
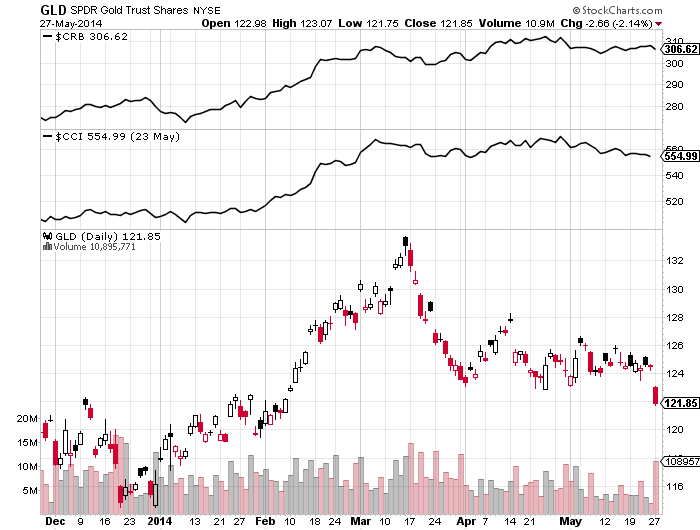
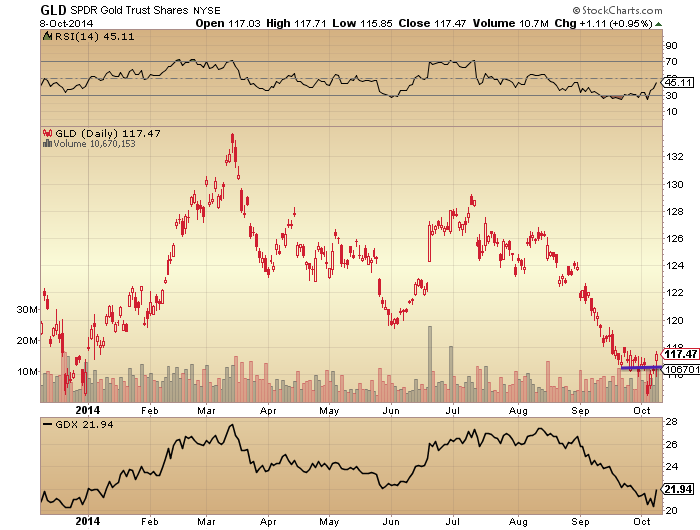
Gold and gold miners rallied and appear to be turning last week’s breakdown into a fake-down.

9oc7

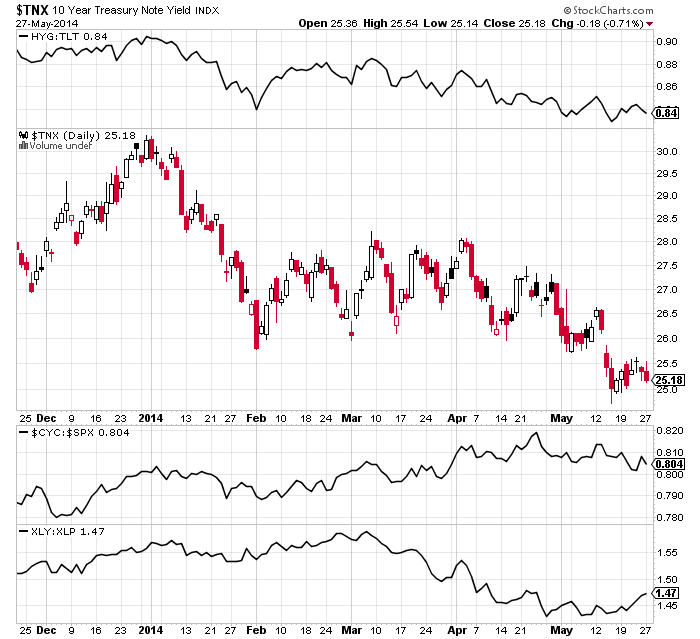
Treasuries also rallied, so either risk or defensives have it wrong.

9oc3

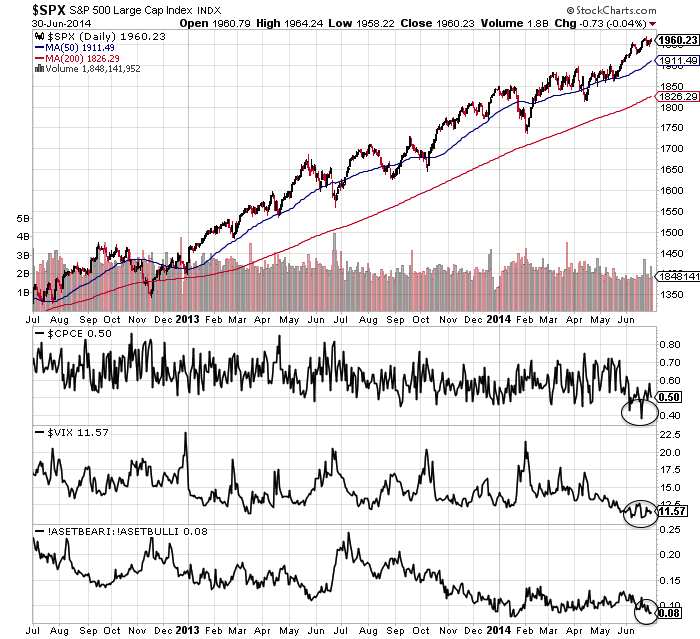
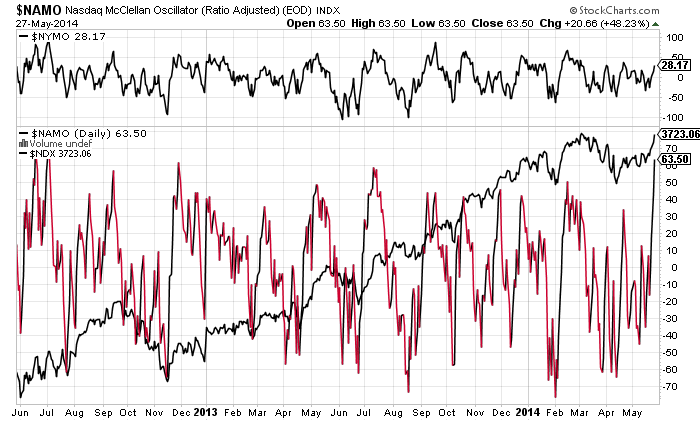
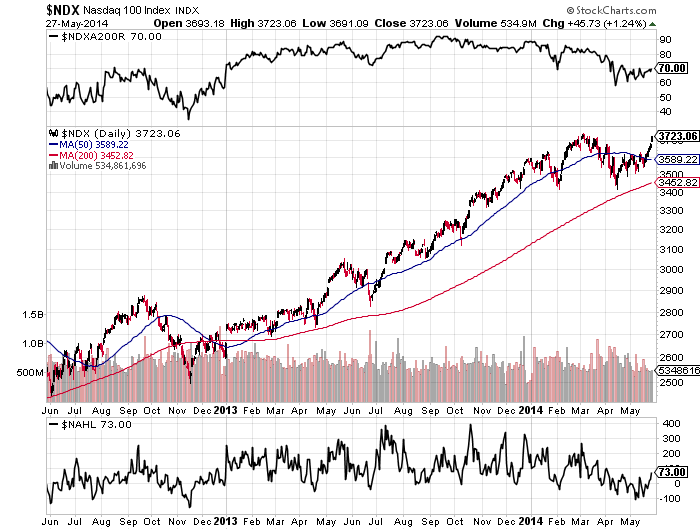
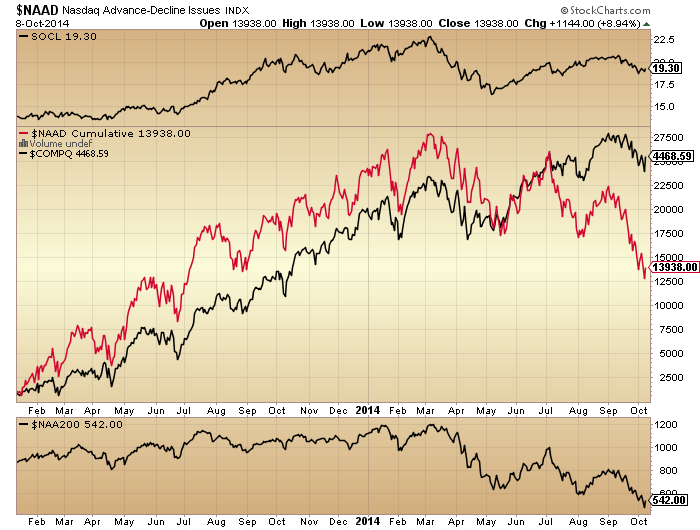
Breadth weakened rather than strengthened, casting doubt that equities have it right.

9oc4


9oc10

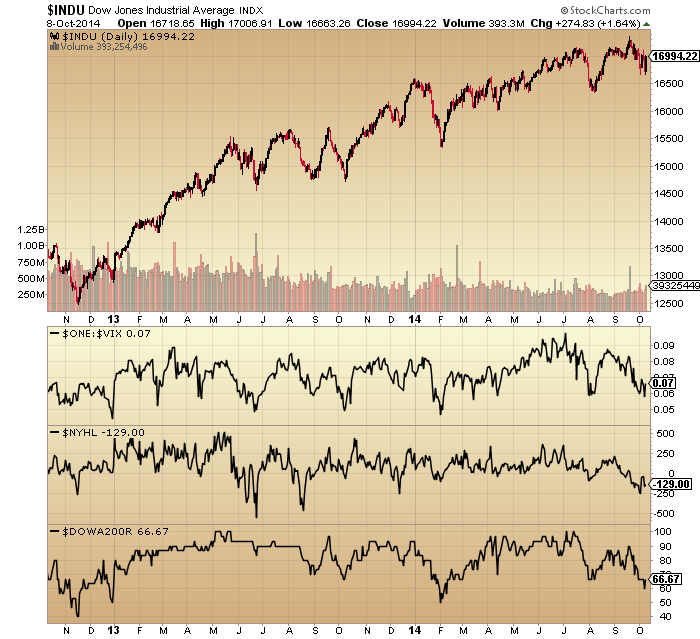
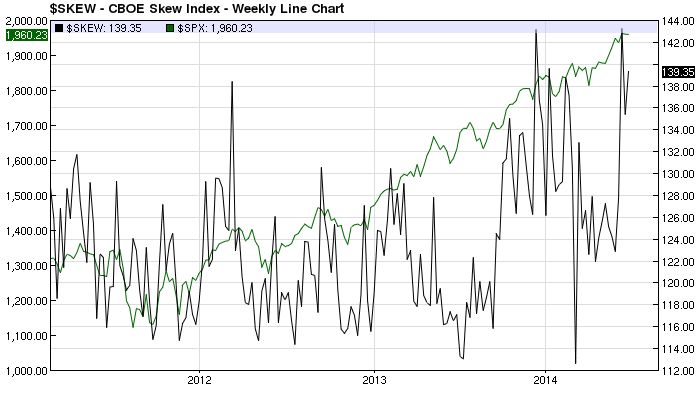
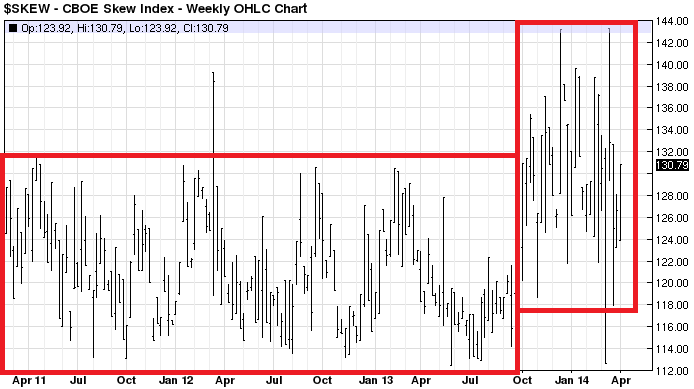
The above chart shows Vix remains divergent too.

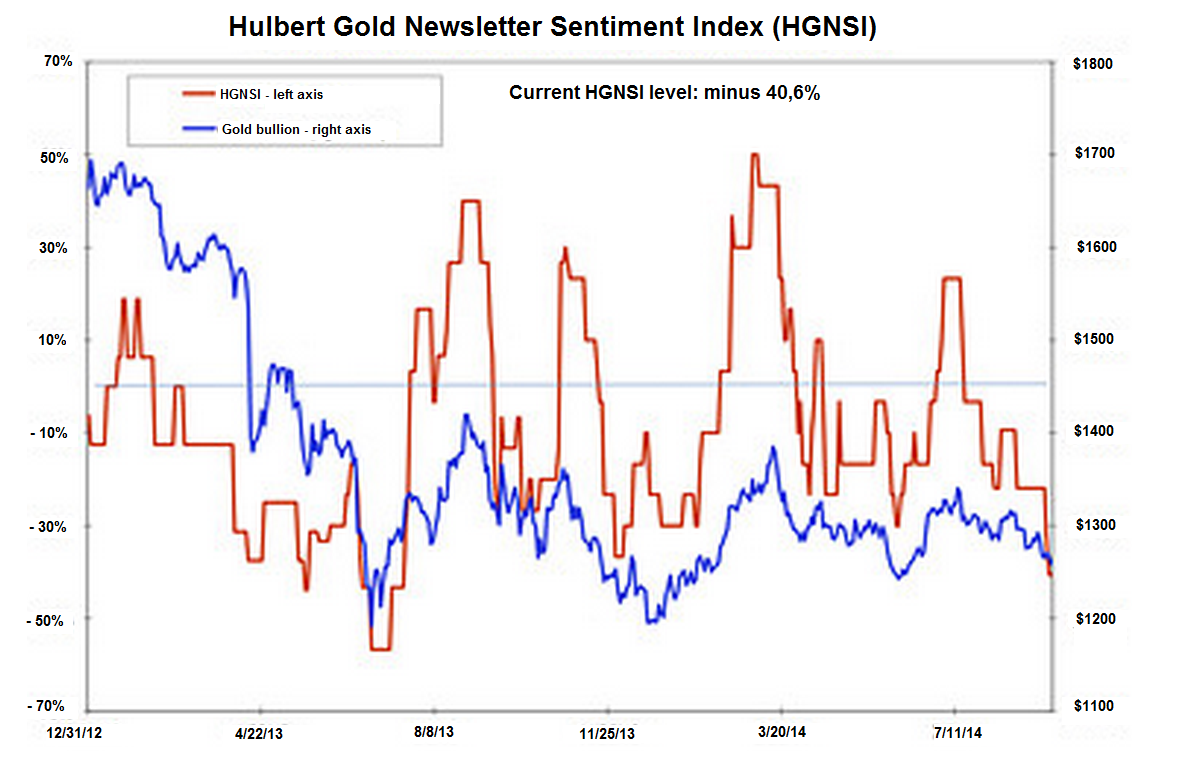
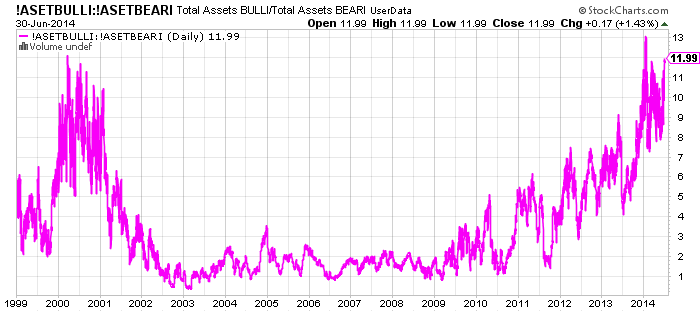
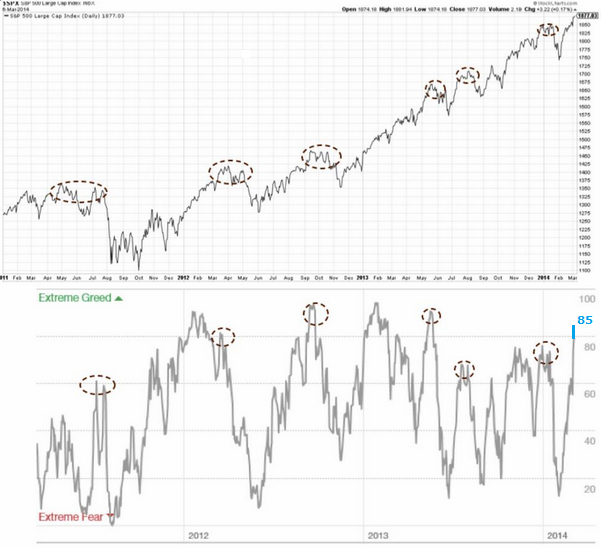
Investor Intelligence % Bears are at 14.1 this week, still at the historic extreme, so there has been nothing remotely resembling a washout. Complacency rules.

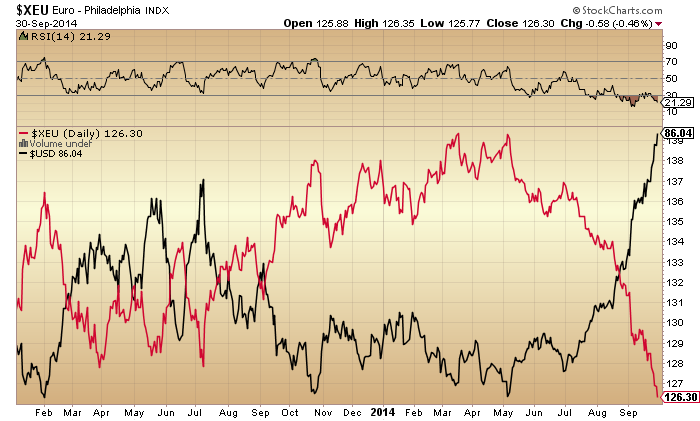
The US dollar’s parabolic has broken.

9oc6

Lastly, to respond to the point that this chart may be cherry picking the RUT as it fits time-wise:

Screen Shot 2014-10-07 at 07.15.41

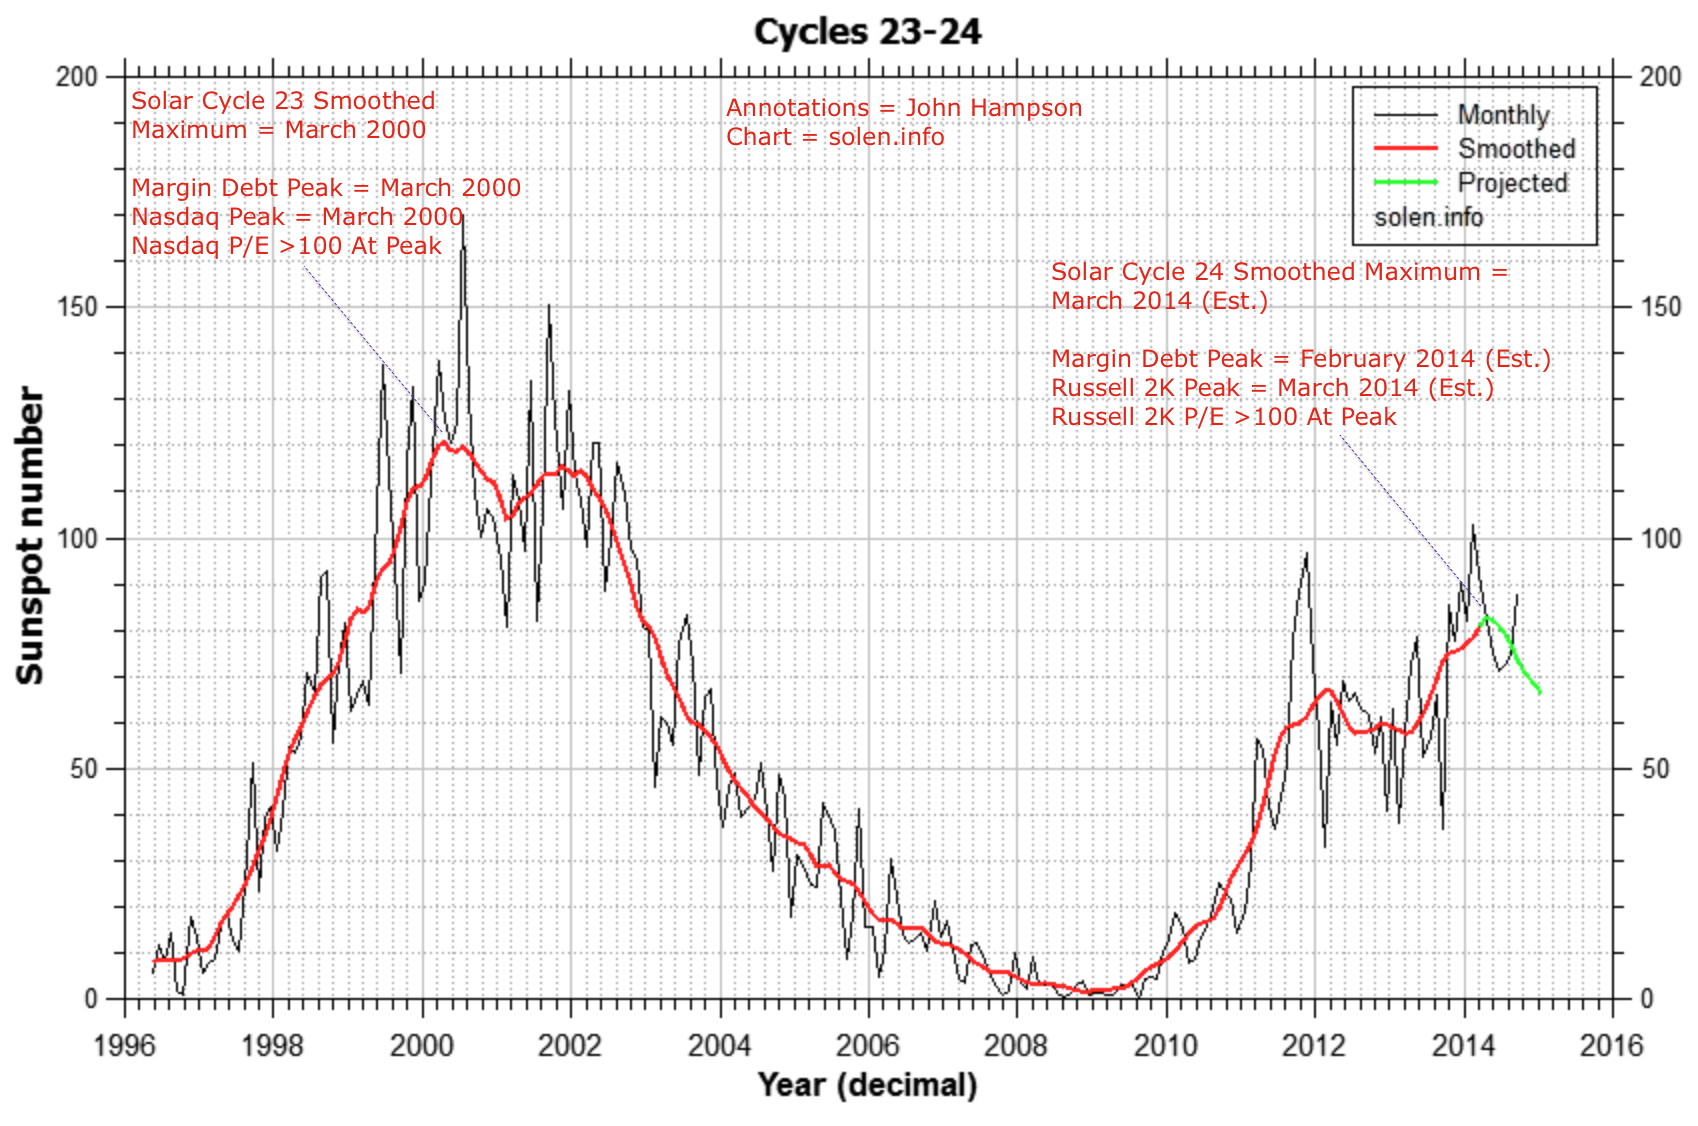
My case is that the RUT was the speculative target as evidenced by the p/e, hence the epicentre with RUT and margin debt right at the smoothed solar max. However, the point is that all stock indices should top out close to the solar max, without any cherry picking. So, the last solar max peak looks like this:

March 2000 = Smoothed solar max

December 1999 = FTSE peak

January 2000 = Dow peak

March 2000 = Margin debt peak; Hang Seng peak; Dax peak; Nasdaq peak; SP500 peak; Russell 2000 peak

April 2000 = Nikkei peak

So, the epicentre was March, and all major global indices topped out within 4 months of this. Now, if you assume here in 2014 the smoothed solar max was March and that all stock indices have now topped out (for which there is a strong case), it looks like this:

March 2014 = Smoothed solar max

February 2014 = Margin debt peak

March 2014 = Russell 2000 peak

May 2014 = FTSE peak

July 2014 = Dax peak

September 2014 = Hang Seng peak, Nikkei peak, SP500 peak, Nasdaq peak, Dow peak

So, the epicentre was March and all major global indices topped out within 6 months.

However, this can’t be validated until we are sure that the smoothed solar max was then and that stock indices do not make new highs from here. Nonetheless, with every month that passes odds are that this is correct and that stocks were on borrowed time since March.

To sum up, by the looking under the hood, the probability is that yesterday’s rally in stocks is quickly reversed again. This could happen as soon as today, or perhaps more upside can be squeezed out into the end of this week. But the signals point to ultimate failure, which means the stick save at support is just a temporary reprieve for the bulls. To those who think yesterday’s save means waterfall declines aren’t going to happen this year, understand that this was a crucial save at the final support on the RUT: it was unlikely to break without a fight. Traders have become conditioned to buy the V-bounce at support over the last 18 months, but the clues are that this time should fail, as covered in recent posts. 6 of the top 10 biggest Dow down days occurred in the window right ahead:

19 Oct 1987
26 Oct 1987
28&29 Oct 1929
6 Nov 1929
15 Oct 2008

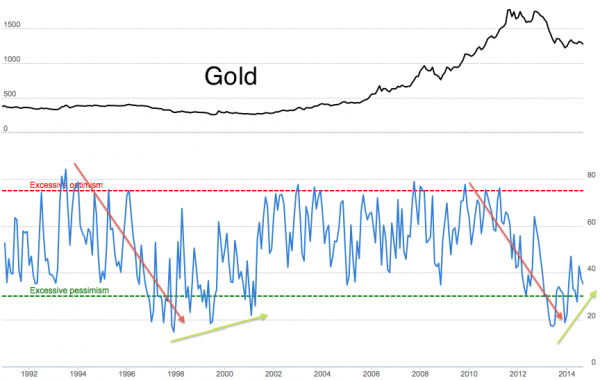
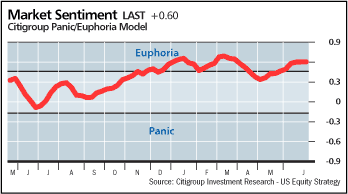
And I believe this picture nicely sums up the Q4 2014 scene:

9oc9

V-Correction Or Breakdown?

The bounce yesterday in equities arrived at an appropriate point when stock indices are cross-referenced technically: channel support on the SP500 and key horizontal support on the Russell 2000:

Screen Shot 2014-10-03 at 09.04.23 Screen Shot 2014-10-03 at 09.33.33

Plus rising support on the Hang Seng – which has generated what could be a fake-out above the long term wedge followed by a breakdown (if it can break):Screen Shot 2014-10-03 at 09.05.12So can all these indices break down, or are we to see another dip-buying v-correction?

3oc11

 Source: Stockcharts

On the above chart a positive RSI divergence was a reliable signal for a v-correction bottom. We do not have that yet, which suggests there should be another leg down of selling, even if shallow, where momentum wanes, if this were to be another v-bounce. This period into next Wednesday’s full moon is the likely window for this additional selling to occur.

However, beyond the prospects of a slightly lower low ahead, could this be the correction that does not produce another V above the 200MA, but forms a ‘true’ correction? I believe the clues are in what’s different this time compared to the previous corrections:

Breadth has made a lower low on the SP500 this time:

3oc10

Breadth deterioration is notable on the Dow since the last peak, plus Vix divergence:

3oc8

Nasdaq breadth has deteriorated sharply since the last correction:

3oc9The bubble-end flagged strongly on technology at the latest peak:

Screen Shot 2014-10-03 at 08.57.14

Source: Sornette

Junk bonds double-topped at the last peak and have since made a lower low:

3oc7

Recent deterioration in stock market internals has been a global phenomenon:

3oc4 3oc3

Source: GaveKal Kapital

The disconnect between global GDP trends and global stocks reached its greatest in the last couple of months:

3oc5Source: Zero Hedge

And inflation expectations have dropped to the lowest since the 2011 bottom:

3oc6

Source: Sober Look

By yesterday’s bounce in equities, NAAIM exposure had pretty well washed out, whilst conversely Investors Intelligence bears remain extreme at 15%. Put-call had reached a suitable extreme for a bounce whilst exhaustion signals are still largely absent. So, some case for a longer bounce here, and some case for the markets to continue downwards. However, note that the extremes in II, Rydex and Skew and the lack of fear spike in the Vix are at this point very mature and at every correction the odds increase that we see the true breakdown.

If we tie in the worst seasonal geomagnetic month of October, an earnings season beginning next week that should cement the disconnect between reality and valuations/projections, the ‘borrowed time’ clues post-solar-maximum (circa March), and the extreme positioning in gold and silver (which I believe are ripe for a short squeeze as/if stocks fall through support), then the case grows for this being the correction that becomes the breakdown.

3oc1

Source: Market Anthropology

To sum up, there has been a broad deterioration over the last 3 months that suggests this should be it: namely, the correction that becomes the breakdown. Stocks bounced yesterday at necessary levels to prevent such a breakdown, but drawing on the historical analogs any attempted rally out of that should be quickly reversed by the bears. The lack of positive divergence at yesterday’s low suggests there should be a lower low ahead, which could then provide the technical break for a much more voluminous sell-off. At that point (the dawning of this being the dip that isn’t bought), I expect precious metals to finally take off, creating a sharp short-squeeze in gold and silver.

Last Quarter Of 2014

September finished as a down month for all US stock indices, which means the peak in margin debt should remain as February. Cross-referencing: SOCL, RUT and Nasdaq breadth peaks are still signalling a likely Feb/Mar speculation top, whilst biotech remains tentatively supportive, at a double top with March. The smoothed solar maximum continues to look like it occurred around March, so the whole picture remains strong for a sun-driven speculation peak around March and a period of ‘borrowed time’ for equities since.

1oc9

1oc2 1oc3

The SIDC chart shows that they are still running with an alternative in which the smoothed solar max double tops ahead at the end of the year, but the majority of other solar scientist models are aligned to their SC prediction (smoothed max behind us, circa March). By cross-referencing with measures of speculation above, the behind-us scenario gains further weight.

The Russell 2000 has now reached the key technical level around 1100 for triggering potential waterfall declines, and it arrives here at the most bearish point in the year, the seasonal geomagnetic low of October supplemented by downward pressure into the full moon of next Wednesday 8th.

1oc1Conversely, if the RUT and other US stock indices can hold up through the full moon and the rest of October, then a year end peak in large caps would gain weight, with the seasonal upward pressure out of November. As things stand though, the recent collapses in junk bonds and inflation expectations, the September declines in all stock indices and the acuteness and maturity of many different stock market indicators (which I have detailed on this site) all support the October breakdown option.

Turning to other markets, the US dollar is in a parabolic ascent, the Euro a parabolic descent, and the slide in precious metals continues. All three show extremes in positioning and indicators that are suggestive of a reversal, and the parabolic trajectory of the FX pair suggest a snapback should be imminent, but when?

1oc8 1oc5I see it as linking in nicely with the situation in equities. If US equities break down through the key technical supports (to clearly kill the prospect of another v-bounce), then gold should at that point reverse course, and the dollar may then be sold off. Much of my recent work on stock market indicators shows that the case is strong for equities to break down without delay, suggesting these intercorrelated reversals ought to indeed occur here in this pertinent window at the beginning of October.

The rising Dollar negatively affects 45% of S&P companies. Earnings season for Q3 gets underway next Wednesday, and the predicted earnings growth rate is 4.7%. This stood at 8.9% on June 30th and 12.2% at the start of the year. For the YTD picture, US earnings growth forecasts at the start of 2014 were Q1 4.4%, Q2 9.2%, Q3 12.2%, Q4 13.5%, whilst actuals are Q1 2.2%, Q2 7.7%, Q3 4.7% (est). In other words, to justify valuations, average quarterly 10% earnings growth was required and projected, but the reality looks like less than half that. As earnings season typically have a ‘sell’ or ‘buy’ theme, I suggest odds are this one will be a sell (as reality dawns), and help pull down equities in October.

At the macro economic level, economic surprises in Europe and China continue to languish negative, whilst the US remains positive. The global real narrow money leading indicator predicts a slowdown once we hit 2015, whilst ECRI leading indicators for the US remain poised at a low level from which a fall in equities would likely tip then negative. This brings me back to what leads what. I recently covered that equities in fact tend to lead leading indicators by a month on average and that previous major tops reversals in leading indicators only occurred once equities had made initial hard falls, which in 2014 they have yet to.

This in turn leads me to the question of whether equities could yet have a second chance peak ahead, like in August 2000 (after the first March peak) or October 2007 (after the June top). In both those scenarios, large caps dropped around 15% before rallying to the second chance peak, whilst leading indicators diverged negative into the second chance peak. The possibility here would be for large cap stocks to break down in October, perhaps 15% again, but then rally back up towards the recent peaks by year end, perhaps for a 31 Dec second chance (lower) peak.

Well, the speculative targets of RUT, SOCL and IBB all show second chance peaks already. Developments in margin debt, HYG:TLT, NAAIM, Rydex and various mature divergences also suggest we should be at second not first chance peak. But the price patterns in large caps don’t really fit. UBS side with the year-end second chance prediction, shown below, yet beneath that their TNX divergence chart is another indicator conversely suggesting we should be at second chance peak already:

Screen Shot 2014-10-01 at 12.12.28 Screen Shot 2014-10-01 at 09.56.18I suggest that if we are post-second-chance but having ‘cheated’ a decent first chance correction (and this is the picture painted by most stock market indicators), then the falls from here should be twice as hard and echo action post-second-chance in 1929, 1987, or 1989 (Nikkei) whereby the falls become waterfall declines or panic selling. If the selling is more measured and back and forth then we should alternatively look to indicators to washout and align for a bottom at perhaps a 10% or 15% correction, before a potential rally into year end.

This last quarter was the best quarter so far for viewing stats on solarcycles.net. The best month was this last month (shown below), the best day just yesterday. So, thanks for reading my analysis and thanks to all those who contribute and make for a good discussion board.

Screen Shot 2014-10-01 at 10.01.55

To sum up, I’d give 80% odds to equities falling in October through technical supports and cementing a new bear market. I’d give 20% odds to equities holding up into or making a second chance peak at year end (both around 31 Dec). I don’t have a case for a bull market extending into 2015, as this would invalidate a variety of historically reliable indicators with different angles on the market.

As this is the last quarter, it seems appropriate to stick this up: predictions from the professionals at the start of 2014 for year-end. We can see that all were bullish on equities, predicting an up-year (accepting that they largely play it safe and align with each other). As you know, I was bearish at the turn of 2014 and always expected us to end the year in a bear market, so it’s a black mark against me if we don’t. But I believe the weight of evidence still supports the markets swinging to me by year-end, so let’s see at 31 Dec.

Screen Shot 2014-10-01 at 13.10.46

Gold Update

Gold behaves as the anti-demographic. This chart shows US demographics versus p/e ratio (equivalent to inflation-adjusted stocks) and gold price on a long term view. P/es or real stocks trend with demographics in secular fashion and gold the inverse.

12se1

Underlying Chart: Glenn Morton / My annotations

In the 1970s we saw a gold secular bull as demographics declined, then 1980-2000 the inverse. Demographics turned again around 2000 and put us in a secular stocks bear and secular gold bull from then through to circa 2025, which makes the gold correction since 2011 a pause in proceedings, similar to the Dec 1974 – Aug 1976 correction in the last secular gold bull:

12se8The late 20s stock market peak was equally a demographic peak and gave rise to a stocks bear / gold bull combination. Homestake Mining is used as a proxy here:

Screen Shot 2014-09-12 at 08.10.01Gold should make a speculative mania into solar cycle 25’s peak, circa 2025, with this target on the dow-gold ratio:

12se7A look at long term gold and silver sentiment shows a pattern has developed over the last year similar to the lift-off in 2000.

12se3 12se4Source: Jeremy Lutz

Cross-referencing with the current position in stocks, we see a range of topping indicators and extreme overvaluation in equities, which sets the scene for a new cyclical stocks bear (within an ongoing secular bear) to erupt imminently whilst gold resumes its secular bull. So I am looking for a floor in precious metals around here (I am long and looking to add).

Gold miners show a rounded bottom whilst gold sentiment has reached bottoming levels:

12se10

Source: Emma Masterson12se5

Source: Mark Hulbert

Gold has been falling the last several weeks in dollar terms as the USD has rallied strongly, but gold in yen, sterling and euros looks more healthy. The rising dollar is consistent with the deflation theme that is powered by demographics, and this theme should pull the rug sharply from under stocks in due course. When that occurs, gold should lift off, as in 1987:

29au14Source: P De Graaf


Three Peaks

By the end of 2013 we saw various divergences emerge that warned of a potential trend change ahead, and still do:

1jl1 1jl2The first major peak point occurred at the turn of the year, around the 2 Jan new moon and at the inverted seasonal geomagnetism peak (i.e twin optimism peaks), as these charts show:

1jl6 1j18There were inversions at this point in different assets and sectors, and the Nikkei peaked-to-date 31 Dec. Various risk-off, defensive and late cyclical assets and sectors have been the dominant money flow targets since then.

The second major peak was the central peak: where the solar maximum, margin debt and the speculative-targets of RUT, IBB and COMPQ likely made aligned tops, close to the 2 Mar new moon optimism peak:

1jl22

1jl10 1j12

The third peak, I believe, occurred at the end of June, close to the 27 June new moon optimism peak and the mid-year inverted geomagnetism seasonal peak (again, twin optimism peaks), to complete the topping process:

Screen Shot 2014-07-01 at 08.16.14 1jl9

Indicators showing the three peaks:

1jl15 1jl3 1jl5Screen Shot 2014-07-01 at 08.15.22The four main US indices aggregated also show the three peaks:

1jl20

And this echoes what happened in 2000, where there was a first peak around the turn of the year (real Dow, Nikkei and FTSE all peaked 31 Dec), a second central peak around March (hot sectors, margin debt and smoothed solar maximum), and a third and final peak around August:1jl19So could stocks then run higher yet and postpone the final peak until late summer or even further out? I can’t rule it out, and it is the main threat to my positions: greater drawdown before it swings definitively my way. However, the trend in leverage suggests further price gains from here are unlikely. The COMPQ is at a suitable double top, whilst the RUT and IBB should make lower highs here to honour the Feb/Mar central peak. Various indicators are stretched to levels that are suggestive of ‘all-in’ or imminent reversal. We have mature divergences seeking satisfaction and fundamental doubts through Q1 GDP, negative economic surprises and Q2 earnings warnings.

The bull case: low rates, benign leading indicators, cumulative-advance declines. But the rhyme with 1937 is still very applicable here in my view. Low rates and a/d breadth accompanied stocks to a high overvaluation peak, like today, front-running a return to normal growth and earnings that didn’t happen, and peaking out with the solar maximum. Q1 GDP has gone some way to puncturing that normalisation assumption again, adding to the other factors being in place. Earnings season could now add to that. Once stocks fall, the wealth effect from a rising equity market will evaporate, helping tip the fragile economy over, as it did in 1937.

Key Time

Break out in stocks or new moon reversal back into the range?

The Nasdaq 100 has climbed back up towards its previous high, and so is adding to the moment with the prospect of a double top or bull resumption. Namo is overbought, which could be a constraint on further upside in the near term.

28m7

 Source: Stockcharts

Breadth and volume are more bearish than bullish:

28m8

There is renewed momentum in small caps, biotech and consumer discretionary, which is bullish, but we continue to see money flows into treasuries, out of high yield and recently out of other cyclical sectors.

28m5Treasuries have been outperforming the SP500 all year, and despite new highs in that stock index yesterday, bonds still rallied. The money flows into defensives would rather fit with a stock market in decline, so who has got it wrong?

28m6

 Source: AThrasher

Either the short interest and money parked in cash, bonds and defensives provides the fuel for another leg higher, or the stock market is overdue an imminent correction. The stats show that large speculators are short, that smart money flows have negatively diverged and that a significant degree of the buying is by companies purchasing their own shares. But unless the market is swiftly pulled back into the range here, then short covering could propel it higher.

The Dax made new highs, but has the same weakness in breadth as the US indices. The contrast in volume to price in the SP500 is shown here as the prelude to a correction, historically:

28m4

Source: J Lyons

Gold broke down yesterday as stocks broke up, which is more supportive of equities mustering a rally here. The two commodity indices are also charted below and show a loss of momentum the last 3 months:
28m16

If stocks can break out here, then it’s going to sting. But all those bearish indicators remain in place, and we would likely be looking at a final overthrow move. As one example, in 1987, sentiment hit similar extreme readings around Feb/March time and price range-traded until May before an overthrow rally to a final market peak in August. But let’s first see how price behaves as we pass through today’s new moon, as internals are weak and a true breakout may again prove beyond reach.

Markets Update

The selling in equities into Tuesday did not wash out indicators, suggesting a lower low should be ahead. Yesterday’s bounce produced a very low put/call reading signalling high complacency.

10ap1

 Source: Stockcharts

Risk of an outsized move remains historically high:

10ap2

 Source: Barcharts

Investors Intelligence bulls back up to 54.6%, bears unchanged at 18.6%, continuing the historical extreme cluster of readings.

There is downward pressure into next Tuesday’s full moon. Presidential seasonality peaks out in mid-April. Earnings season ramps up as of next week.

8ap3

 Source: Fat-Pitch / StockTradersAlmanac

Narrow money and OECD derived leading indicators continue to point to weakness in global industrial output into May, before a summer pick up. Economic surprises for the main regions ticked further negative this week.

After a little consolidation, commodities (CCI and CRY indices) are breaking upwards again:

8ap5

 Source: Bloomberg

Whilst the US Dollar is flirting with breakdown again:

8ap4

 Source: Stockcharts

Treasuries and yields are in a range, watch for resolution:

8ap6

 Source: Stockcharts

In short, I expect the current bounce in equities to be short lived and roll over into further declines into next week’s full moon. April remains my target window for major declines in equities, based on historic patterns of falls accompanying this inverted geomagnetic seasonal low period, together with an anticipated solar maximum now on the wane. That would imply this earnings season would be a sell, and I think this is reasonable given we have negative earnings guidance once again whilst stocks have front-run up to valuations that in contrast demand a return to solid earnings and revenue growth. Leading indicators also suggest economic data should continue to disappoint into May, adding to this April window of opportunity. However, if equities can hold up in a range through this period until data picks up again, then maybe we could have a mirror of 2011, whereby stocks did not break down until the Fall. For now though, I suggest this the lower probability, and I expect April can deliver the goods.

Friday Charts

1. Biotech followed through on Friday’s high volume down day with a second one yesterday:

7ma5

Source: Stockcharts

2. Greed and Fear Index has rallied up to extreme greed territory:

7ma1Source: UKarlewitz

3. High yield corporate bonds to 20+ year treasuries shows a divergence with the stock market that has previously marked tops:

7ma2Source: Inflated Temper

4. Household and non-profit organisations allocations to equities:

7ma4

5. Dr.Copper does not think much of the global economy in 2014:

7ma66. Natural Gas inventories are some way below their historic normal range and I expect this commodity can make a renewed bid for $5:

7ma3Source: EIA

Indicator Updates

1. Dow daily candles and Monday’s volume print at high reversal:

26fe12. Nasdaq 100 and breadth divergence:

26fe43. SP500 and defensives outperforming cyclicals:

26fe2

4. Russell 2000 (my largest short) P/E:

26fe11

5. Gold outperforming stocks:

26fe96. Treasuries outperforming stocks:

26fe107. Inflation expectations cast doubt on longevity of commodities (CCI index black line) rally:

26fe138. Smart money sold into 2013’s equities rally and outflows accelerating into this month’s upleg:

26fe89. Rydex bull ratio exceeds levels previously associated with significant corrections and 2013’s anomalous levitation raises risk of sharp collapse:

26fe710. Put/Call ratio (21 day average) also exceeds levels of previous significant corrections, and at best suggests period of consolidation with downward bias ahead for equities:

26fe5