People unwittingly buy into new moons and sell into full moons (typically, not always).

People perhaps a little more consciously buy and sell seasonally, but unaware they are being guided by geomagnetism. Again this is more often than not, rather than every time.

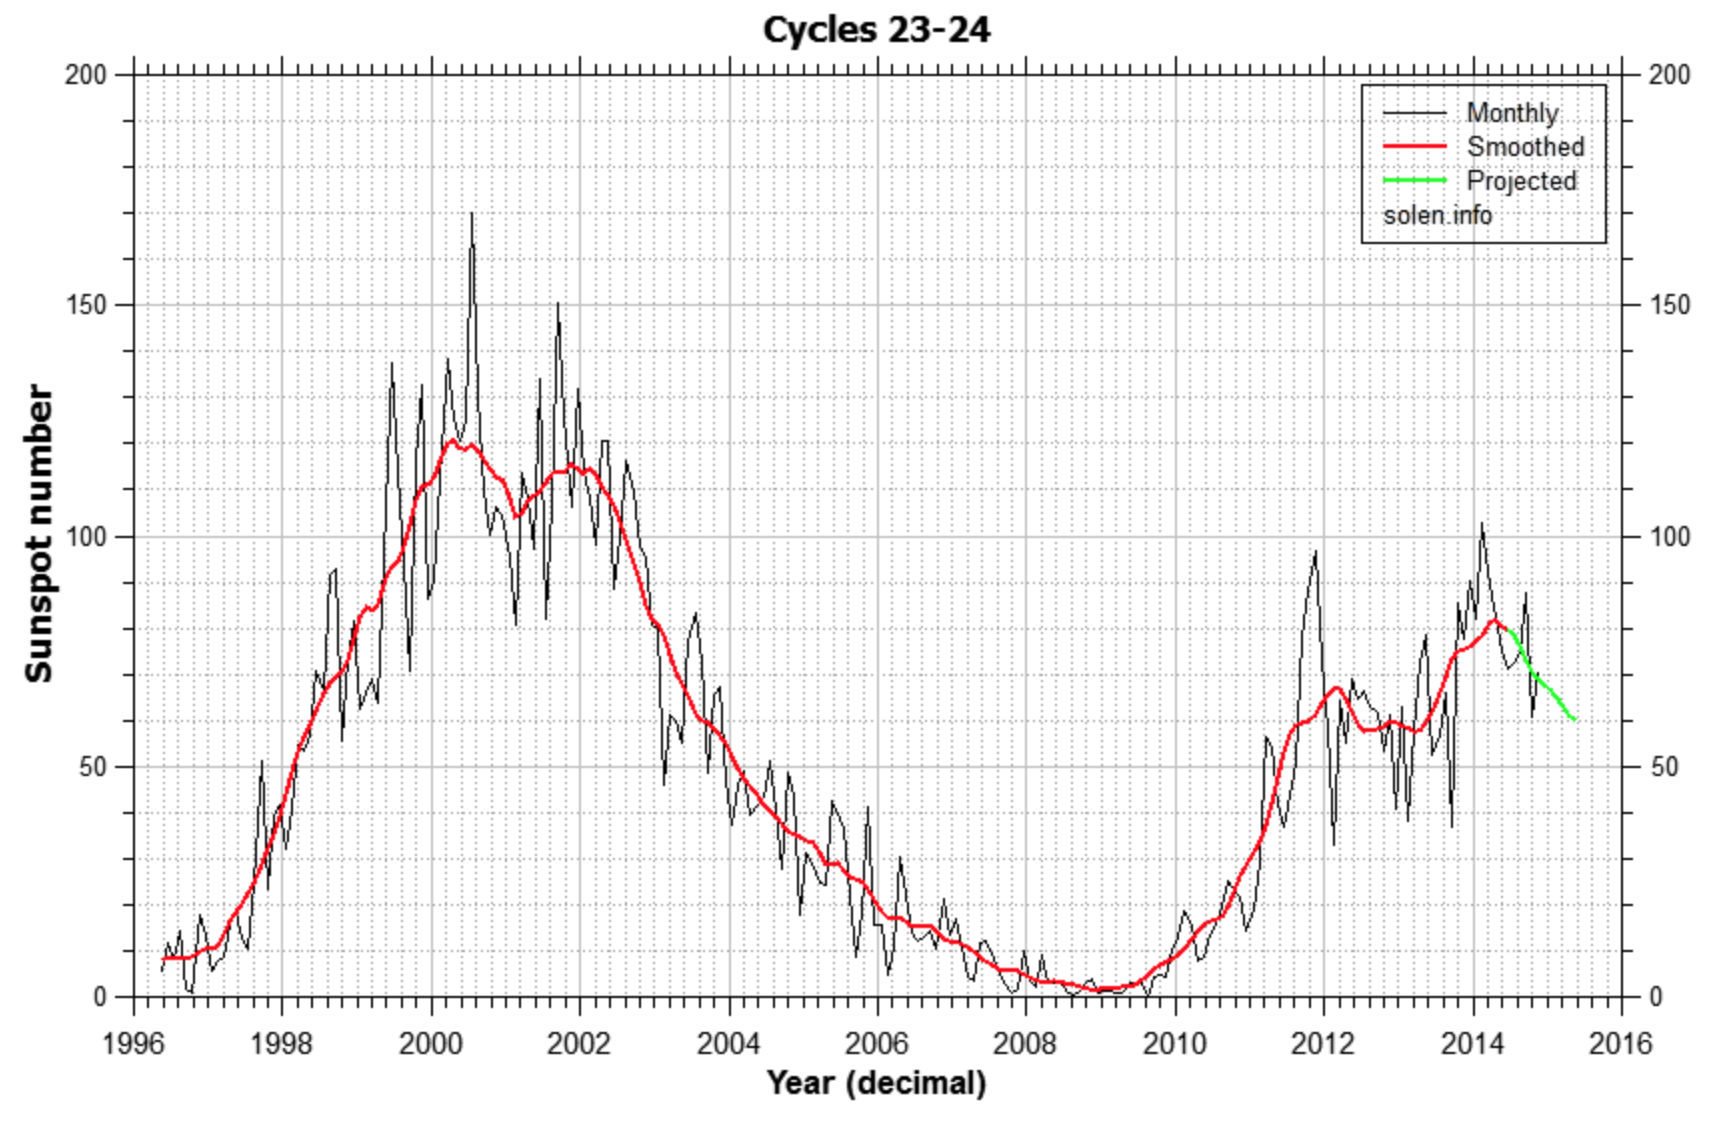
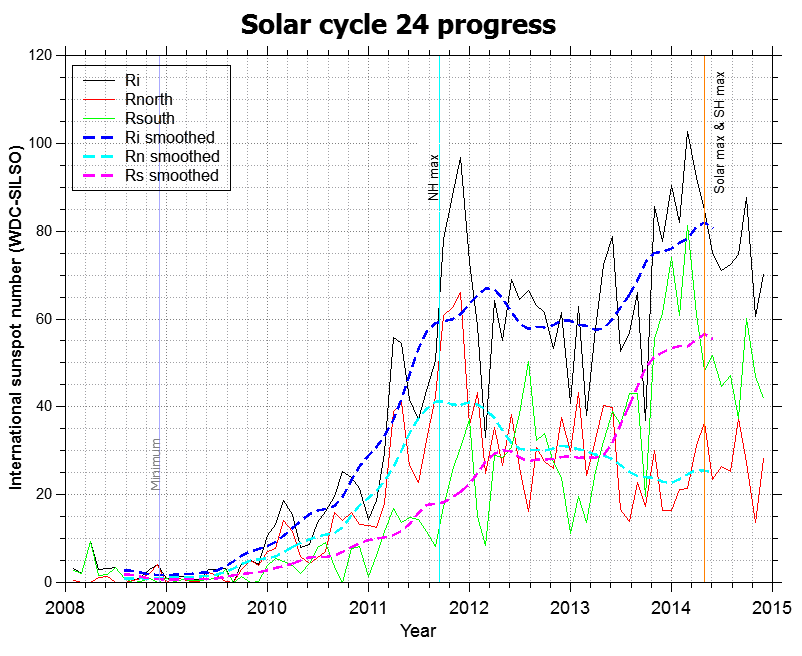
And people unwittingly buy into solar sunspot maxima, typically or normally.

Therefore, it should follow that looking for the new moon which falls closest to the inverted geomagnetic seasonal peak which falls closest to the smoothed solar maximum ought to lead us to a major market peak, in a triple confluence of ‘peak’ buying (within the month, within the year and within the decade, respectively).
Considering the last 5 solar cycles then gives us five exact dates over the last 50 years. They are:
A) SC20: 19 Dec 1968
B) SC21: 17 Jan 1980
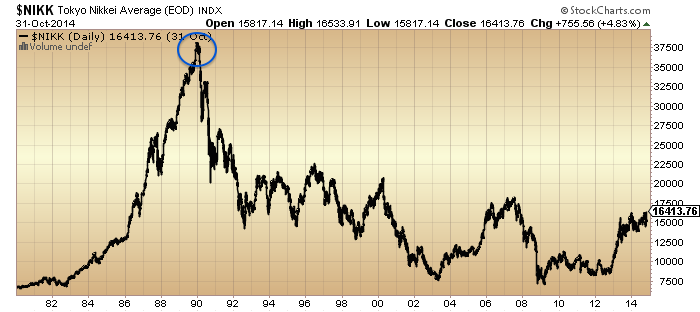
C) SC22: 3 July 1989
D) SC23: 6 Jan 2000
E) SC24: 27 June 2014
Did a major market peak fall close to any of these dates? Yes indeed…
A) Major Dow and FTSE bull market peaks in December 1968, two weeks from the date.
 Source: FiendBear
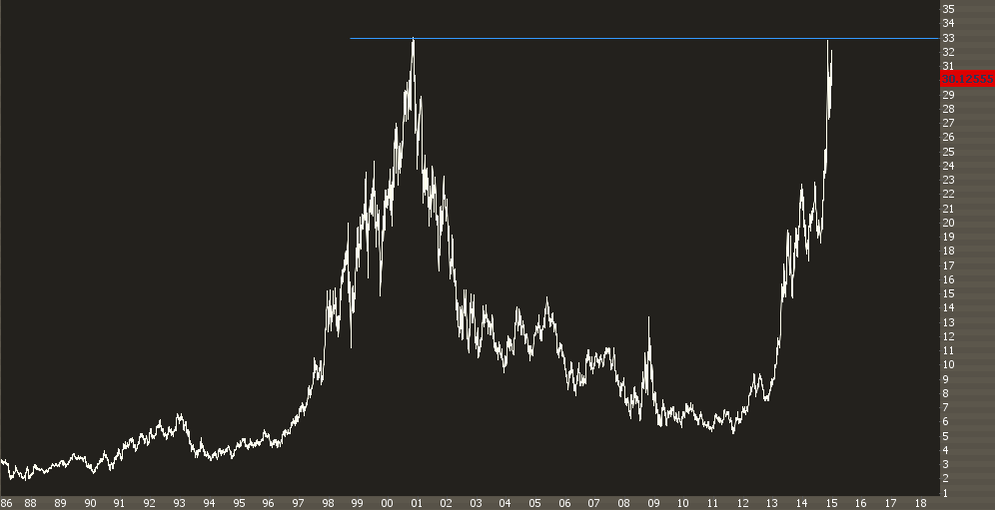
B) Major gold and silver peaks 21 January 1980, 4 days from the date.
 Source: Greshams-Law
C) The Nikkei peaked 29 Dec 1989. The new moon closest to the inverted seasonal geomagnetic peak after the smoothed solar max was 31 Dec 1989, 2 days away. In other words, the rule worked but on the seasonal peak after rather than before the smoothed solar max.
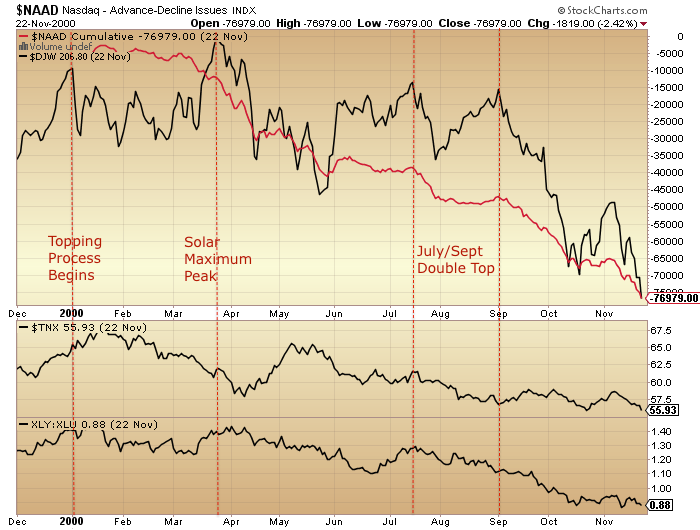
D) Major bull market peaks in FTSE 31 Dec 1999 and Dow 14 Jan 2000, both within 8 days of the date.

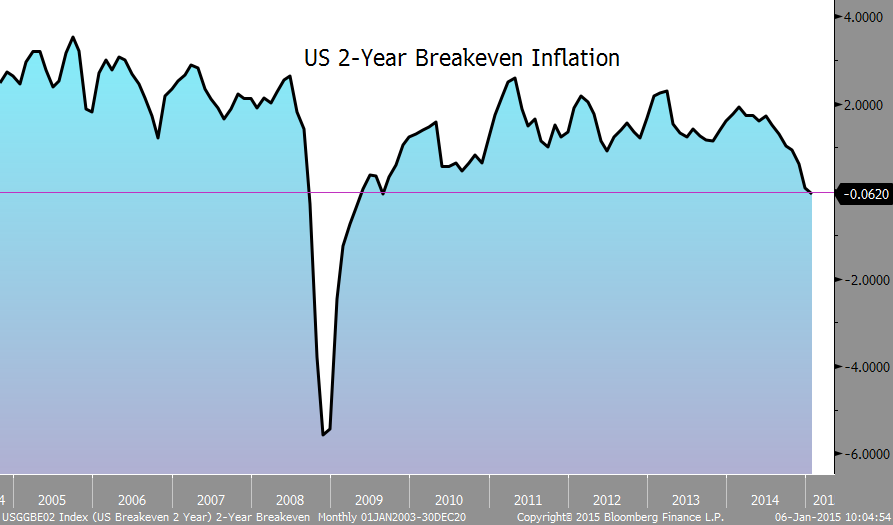
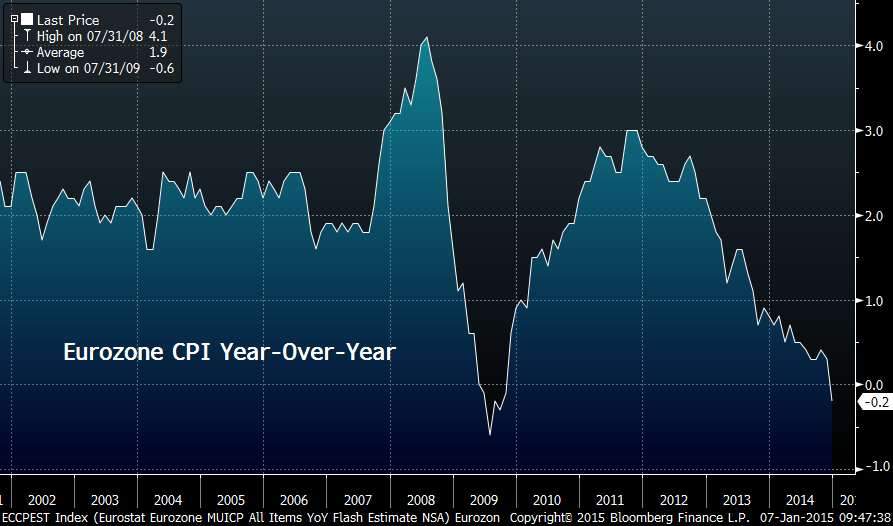
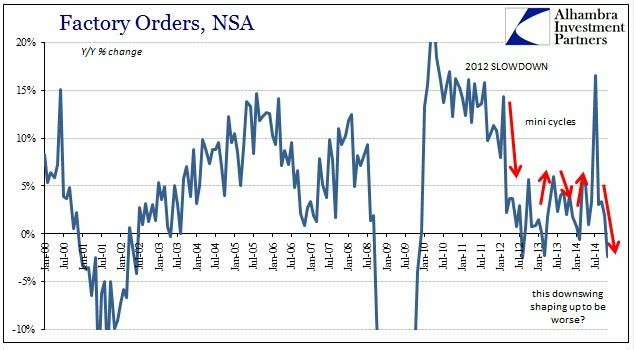
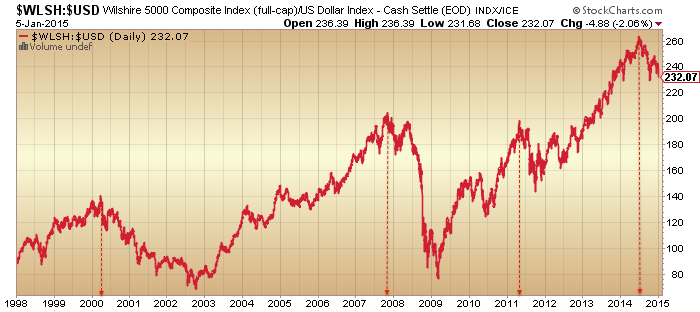
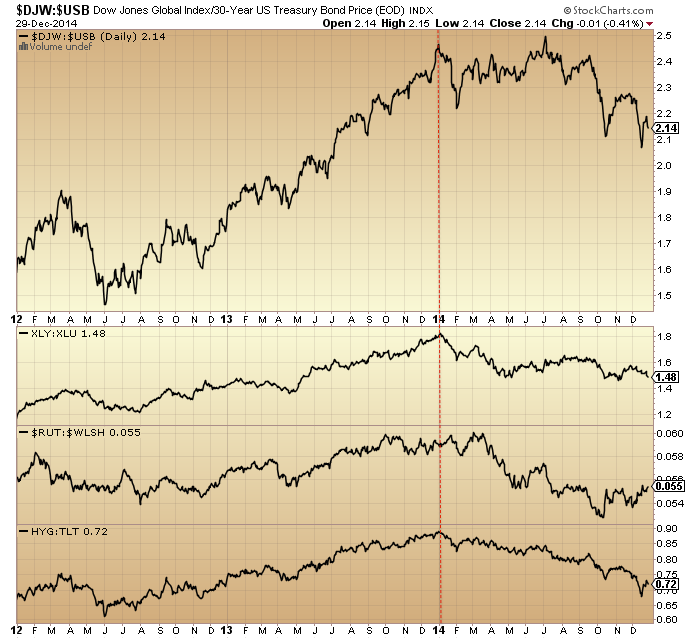
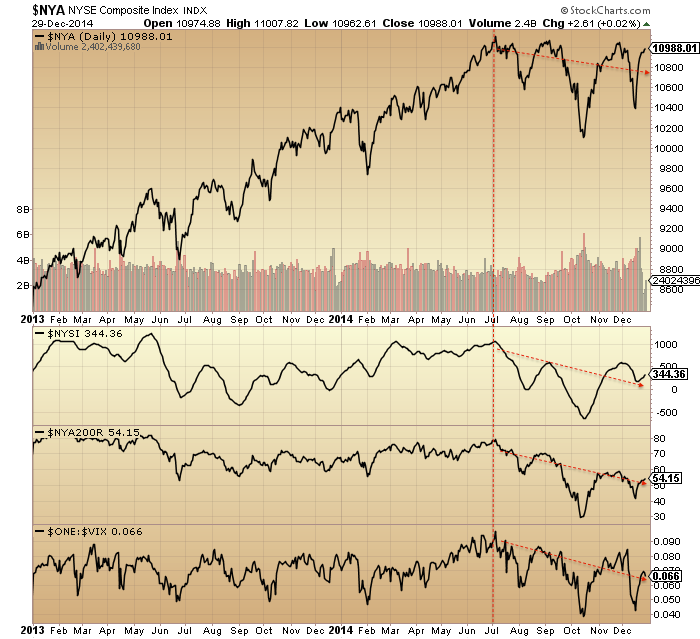
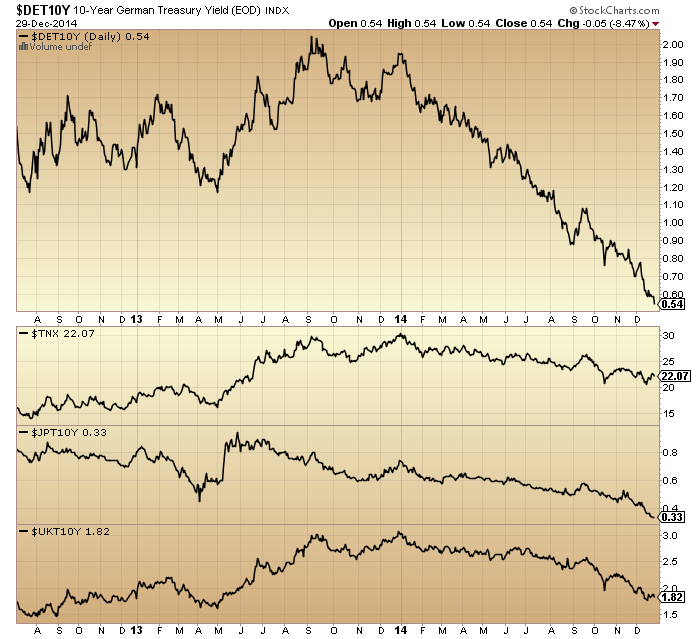
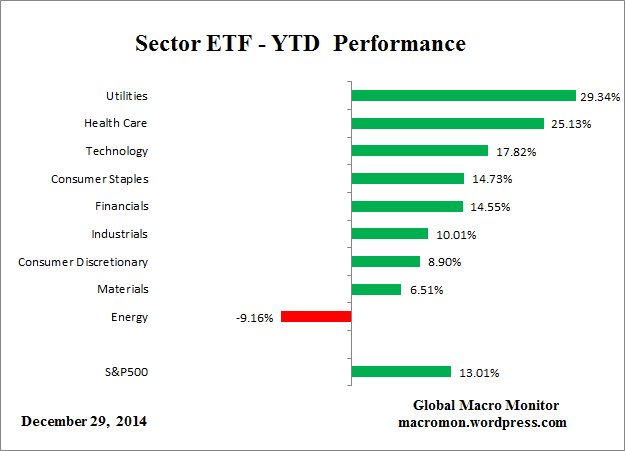
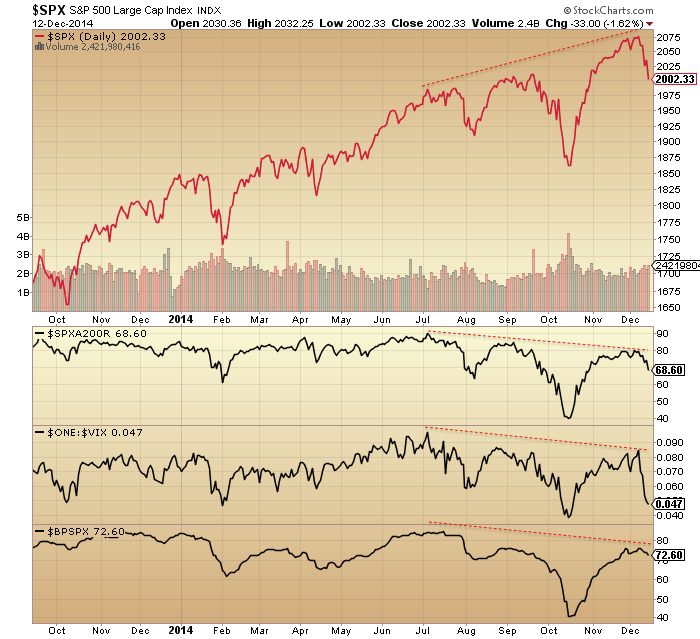
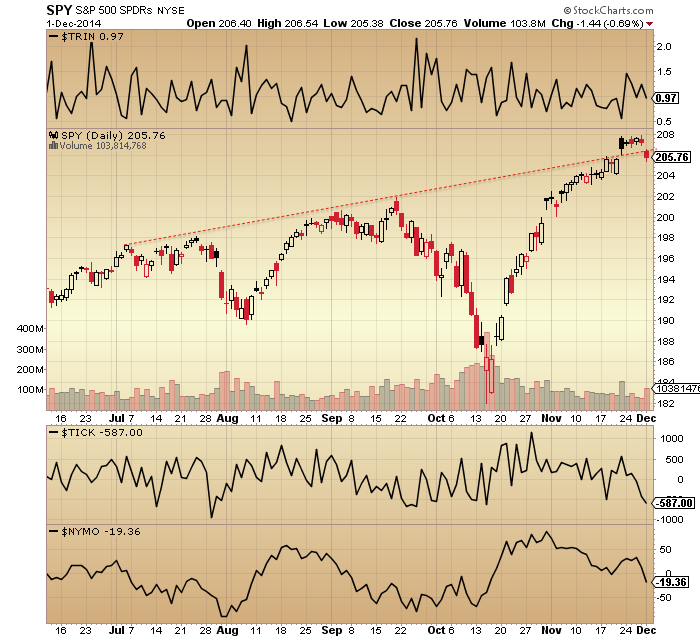
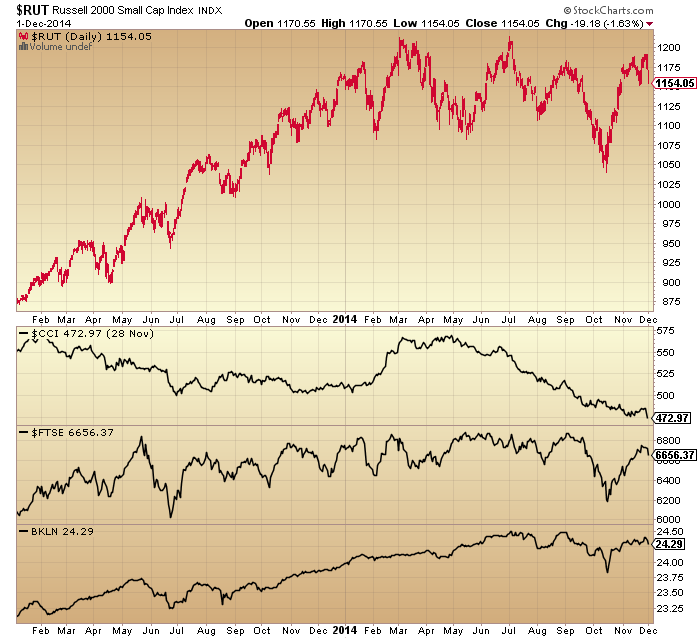
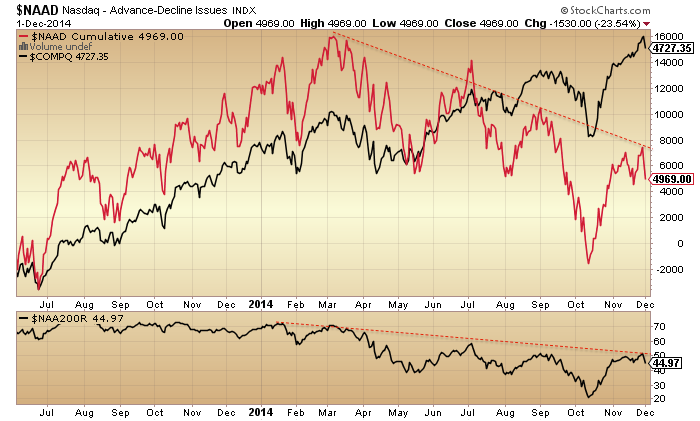
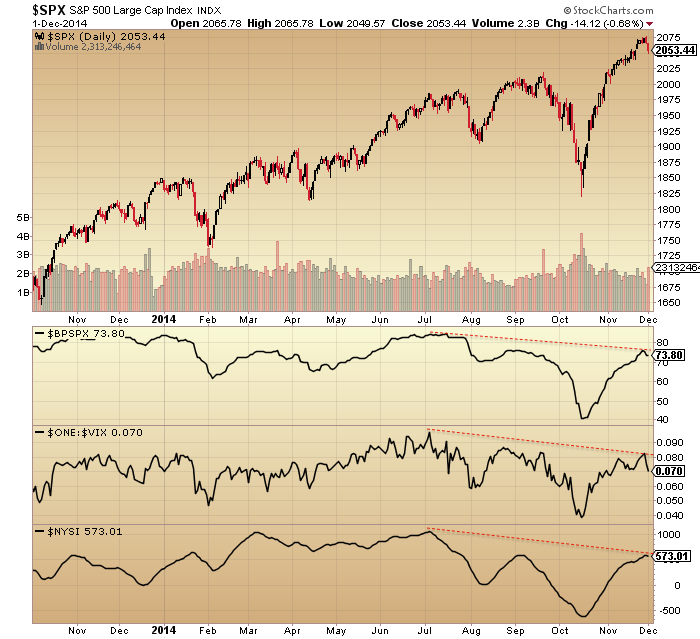
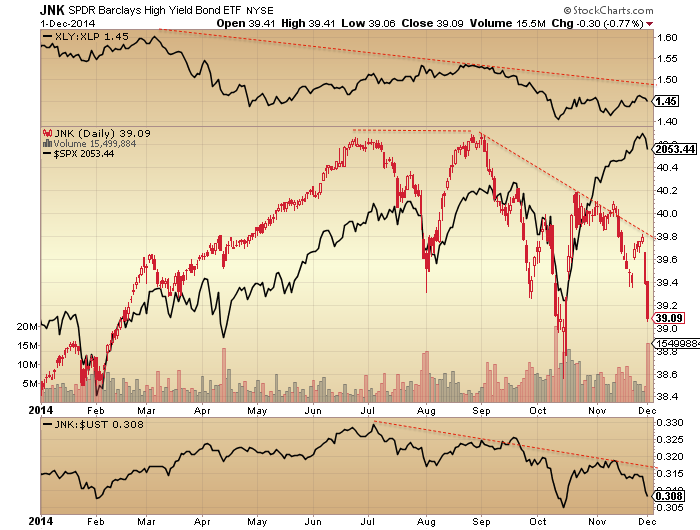
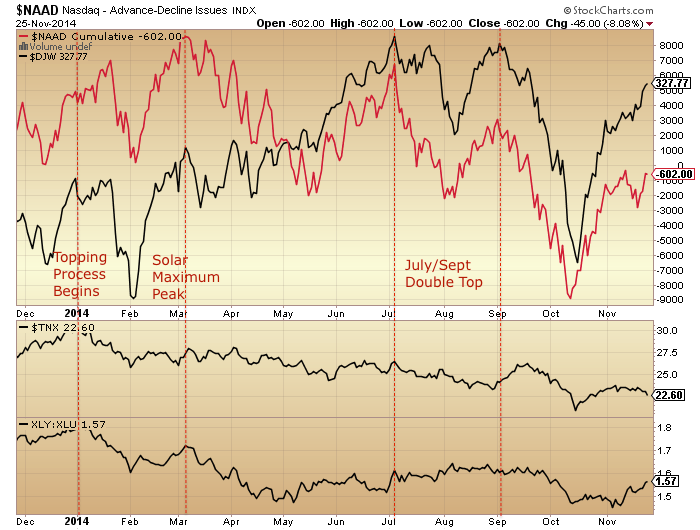
E) Our current scenario. Rather a lot peaked or reversed direction around the date of 27 June 2014:
Stocks:Dollar, Stocks:Treasuries, Junk Bonds and Junk Bonds:Treasuries

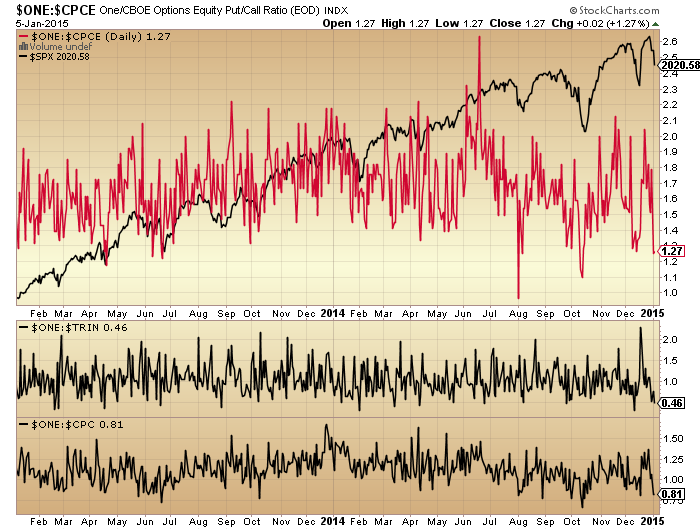
NYSE Composite, NYSE breadth, Volatility (inverted) and Crude Oil
NYSE Cumulative Advance-Declines, Dow breadth, SP500 breadth, Nasdaq breadth:
FTSE, CAC, DAX and Euro Stoxx indices
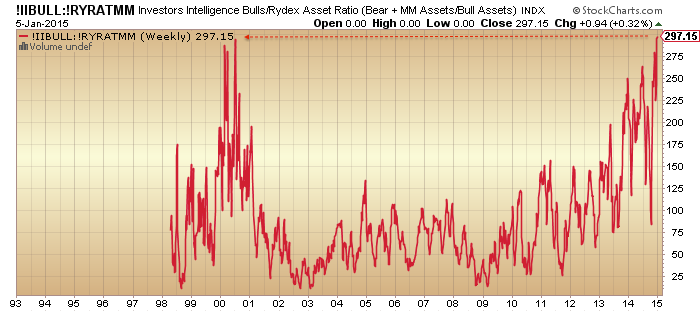
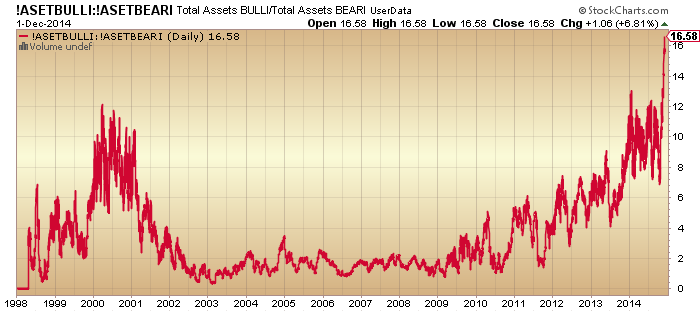
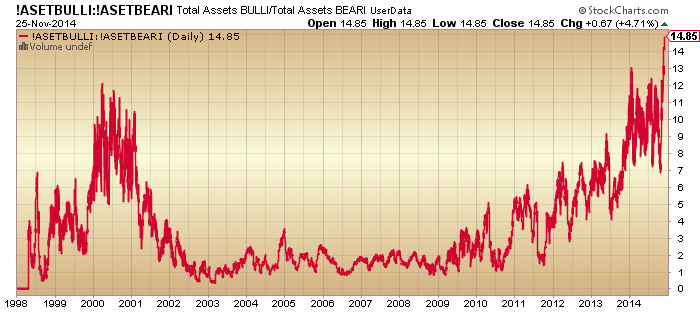
US Dollar (inverted), SP500 Bullish Percent, Leveraged Loans and Copper

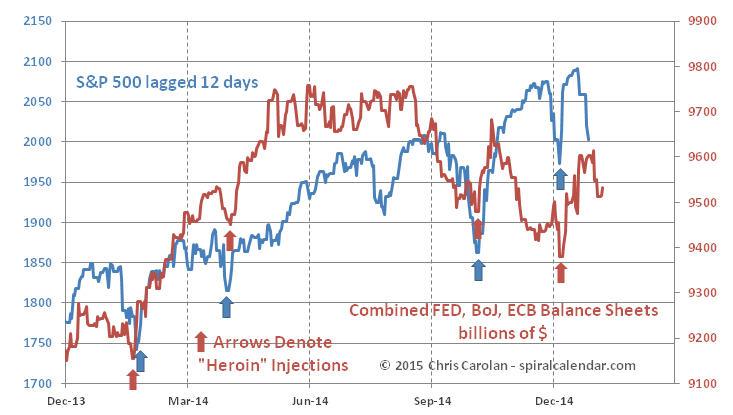
Not only this, but the combined central bank balance sheet expansion of Fed, ECB and BoJ peaked out around this time, as we might expect given the sun should be guiding them too.
Plus, drawing on the Nikkei 1989 experience, if we also look at the geomagnetic seasonal peak that fell at the end of the year 2014, then the new moon was 22 Dec, and the Dow and SP500 peaked very close to this as things stand.
In short, if the stock market is as ‘dumb’ a mechanism as this, then there should be no new highs ahead in any of the indices or indicators listed. The three solar influences of sunspots, geomagnetism and lunar phasing (nocturnal illumination by the sun) silently guided the markets to a peak.
The caveat for this is that solar models are correct and the smoothed solar max is behind us.
So, in the near term, the move up of Wed and Thu last week should be repelled before new highs are reached. Friday’s move down may be the start of that. However, the new moon of Jan 20 is still a high on the geomagnetic model (the last high before we tumble down to the March/April lows) so falls in earnest may potentially wait until after that. The Nikkei in 1990 tumbled in earnest once February hit.