Bali

The Bali experience has left me with a bit of a conundrum: where is going to be as good as that?! Travel is a personal thing, but you can perhaps relate at least in part to my take on an idyll: safe, friendly, rich in culture, beautiful nature, beautiful man-made, great climate, and a cheap cost of living for a bonus. Bali delivered on all fronts.

Bali is peculiar to Indonesia because it is Hindu, rather than Muslim, and the Bali form of Hinduism permeates everything here (95% of residents follow). Tiny offerings and statues of gods everywhere, at least three temples per village and in every building a shrine. 500 new shrines and temples are built every month – the religion is as current as it ever was, with the youth fully involved. A tremendous amount of rituals and ceremonies means the Balinese are often seen in traditional dress, with flowers a key part of the look and the offerings. The extension of Hindusim into Balinese behaviour is ‘ritualised self-control’, which in practice means modesty and restraint. In short, the religion is all-involving.

The religion merges into the culture as their religious devotion is echoed in their devotion to arts and crafts (on a large scale) and to architecture. The architectural themes of gated entrances, pavillions, water features, and of course shrines and statues have been studiously reflected in the hotels and villas on the island, giving the whole island a consistent feel, and beauty. The man-made beauty across the island is all the more impressive given that existence here is tough for many. Tourism now accounts for 80% of the island’s income, but 80% of Balinese still work in agriculture. Working in tourism pays little, working in agriculture less. Hence, it is not uncommon for parents to sell a rice field and send their kids to tourism school. Labour is cheap here – you could live here and have a maid, cook and driver all for $200 a month.

Despite the meagre earnings, the Balinese are a happy people and could not be more friendly. It’s not possible to be a faceless person on the island – all are involved, and this extends to tourists. Tourism has clearly had an impact on the island, but not in the kind of ruinous way whereby the original reasons for coming are slowly devoured. There is no problematic friction between locals and tourists (on which note, the Bali bombings were carried out by a Muslim terrorist group), and the Bali culture remains strong and dominant, rather than diluted and then packaged up for visitors in a less authentic way. To complete the picture, the nature is lush green, with tiers of paddy fields amongst the palms, and there are beautiful beaches, wild chickens and lizards galore.

Negatives? There are quite a lot of ill looking dogs around. The Balinese largely consider them scavengers in league with evil spirits, and as a result they have a difficult existence. There is a caste system, in line with Hinduism elsewhere, meaning not all are equal. You will see swastika symbols – but this is nothing sinister, in fact it means in harmony with the universe and precedes Nazism. And of course, as with anywhere that might be considered idyllic, greed naturally steps in, and some long-time visitors to Bali bemoan this. There are a few opportunists in the most touristy south (often coming over from neighbouring Java), big luxury hotel resorts have edged out old backpacker Bali, and Jakarta has taken its slice through shortening visas and applying a departure tax. As a first time visitor, I would say this: the mature Bali remains very attractive: crime remains very low, trust and friendliness reign, and the beauty and culture of the island rival anywhere I have been.

The majority of visitors to Indonesia go to Bali and Bali alone. On my current trip, that is also the limit of my dip into the 4th most populous nation on Earth too. So I will leave this post as a little Bali travel summary and not attempt a wider analysis of Indonesia and its markets. Some pics to finish then:

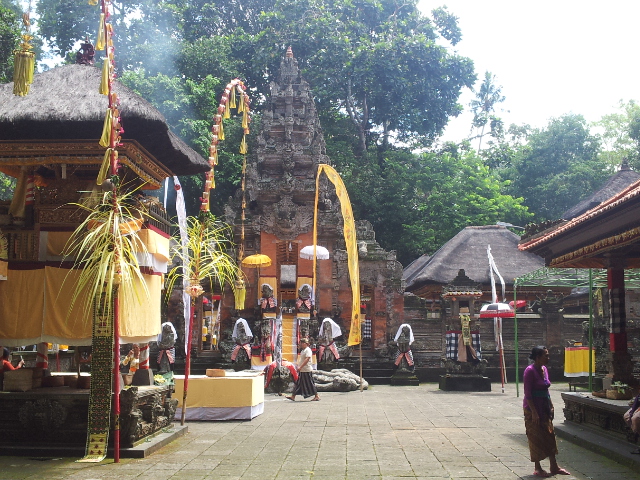
A Bali temple ceremony.

Ubud Temple

Rice field terracing.

P1030311

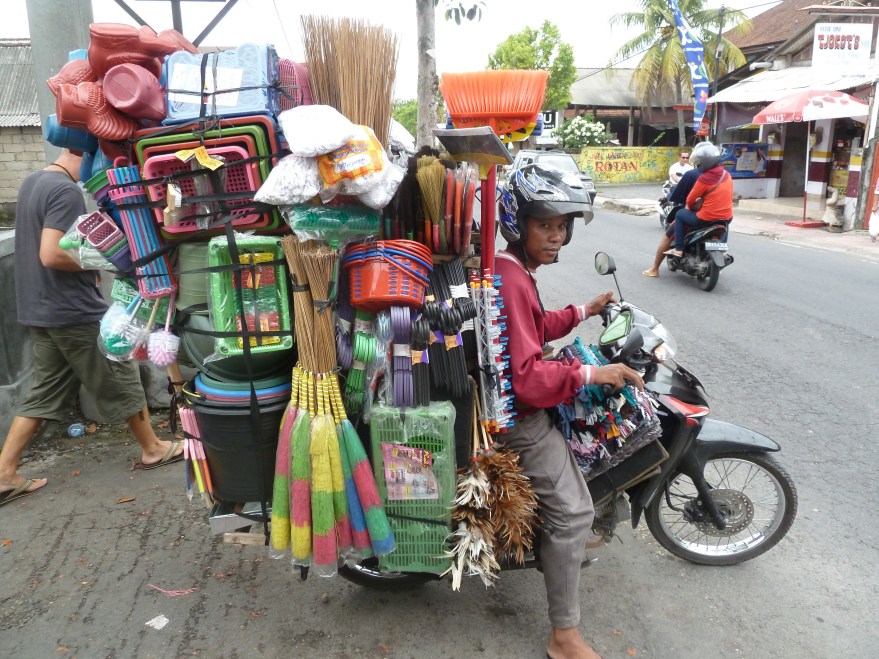
There is no limit to what a motorcycle can carry here.

P1030013

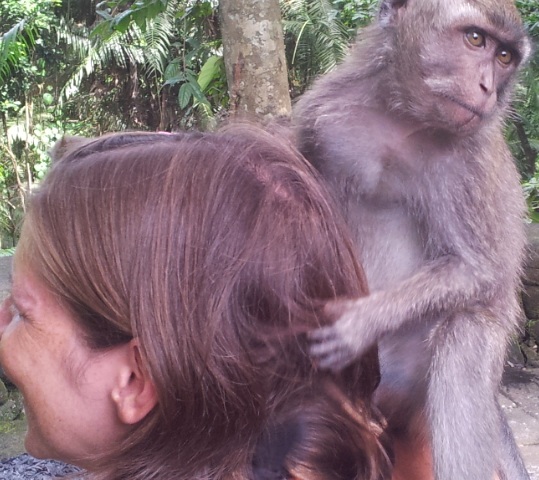
My wife gets a head massage.

Gabi Monkey 2My son relaxes at the beach.

P1030153

Friday Drama

I’ve suffered poor internet access this week, but have it now, so let me catch up on developments since last Friday. I will respond to comments and emails in due course, but first, analysis.

Conference Board leading indicator updates have been mixed. USA, France and Mexico slipped negative. Germany improved to flat and the general Euro area jumped into the positive. Australia also moved into the positive and China put in another good month. The summary table currently looks like this.

21dec20121Source: Conference Board

So a continued picture of mixed fortunes, but with a rotation in leaders, and overall a picture of weak growth ahead, rather than recession. ECRI leading indicators for the US advanced from 3.5 to 4.4 last week and US economic surprises have picked up again the last couple of weeks:

21dec20122Source: Ed Yardeni

Euro debt, which bothered the markets from mid-2011 to mid-2012, has deflated as an issue, to much more benign levels.

21dec20126

Source: Acting Man

The Dow theory divergence of mid-year, which was a potentially bearish signal, has been resolved, with Transports since resuming strength:

21dec20123

Source: Ed Yardeni

And cyclical stocks in the US continue to perform strongly, with breadth also healthy.

However, sentiment for US stocks has reached into frothy bullish territory in both NAIIM and AAII surveys:

21dec20129Source: Sentimentrader

21dec201210Source: Bespoke

Investors Intelligence and bullish percent over call put ratio both however remain in neutral territory, but overall risk aversion has reached very low levels:

21dec201211Source: Big Picture

Meanwhile, the Shanghai Composite has pulled up in a more compelling bottoming fashion, as the drop beneath shown support now looks like a fake out.

21dec20125

Source: Cobra / Stockcharts

Treasuries have declined and yields have added credibility to a W-bottom:

21dec20124Source: Stockcharts

Copper remains in a triangle, unprepared to give a diagnosis on the global economy at this point:

21dec20127Source: Stockcharts

And crude oil ditto:

21dec20128Source: Trading Charts

November’s global climate stats from NOAA came in at the 6th hottest on record, making the year to date (minus December) the 5th hottest on land since records began. That’s a continued support for agri longs, as extreme conditions persist. Yet, soft commodities are, as measured by a broad agri commodities ETF, just range trading of late. Despite China’s improving fundamentals, and the Euro strengthening against the US dollar (USD technically weak formation shown below), commodities as a whole are failing to ignite currently.

21dec201212Source: SeeitMarket

The most surprising underperformer is gold, which currently looks like this:

21dec201213

It just dipped beneath the 200 MA, which has largely supported the secular bull since 2000. Is that a worrying development? It’s not great, but it is doing so on oversold RSI and a daily sentiment index reading of sub 10. Furthermore, gold miners have reached a bearish extreme in public sentiment. I still suggest that gold broke upwards out of its 11 month consolidation in August this year and has resumed its uptrend, albeit tentatively at this point. Gold seasonals, solar/secular history and negative real interest rates all support gold bouncing here and making that tentative renewed uptrend more concrete, but once again it is finely poised. I am happy with my exposure both to precious metals and to miners, but if i were underexposed I would choose now to buy both, based on the reasons I have aggregated here. In other words, I believe gold will bounce here and reclaim its 200MA (with the weak hands shaken out).

Today is the Mayan apocalypse, the Mayan hinge point, a miscalculation, or a falsehood. Tomorrow is a Bradley turn, which would mean today (due to market opening days). I do not buy in to the Mayan blogosphere phenomenon, and have found Bradley turns more miss than hit, but that said we do have some drama today, with fiscal cliff nerves helping bring about a big sell off this morning which at the time of writing has been semi-reversed. I place more weight on lunar cycles, and next week’s full moon typically spells downward pressure into it. However, this is balanced by positive seasonality which goes hand in hand with favourable geomagnetism at this time of year – the updated model shows an uptrend into early January:

21dec201214It’s the morning session in Europe at the time of writing, and I don’t pretend to know how today is going to turn out, given the dramatic market action in the early hours. However, my stance is to stay put on my pro-risk portfolio currently. 1. Weakness in precious metals, 2. indecision in copper and oil, 3. frothy sentiment in US stocks, and 4. complacency in risk aversion, are all current flags. But I would contrast with: 1. oversold and overbearish readings in precious metals and miners, 2. improvement in China, leading indicators and renewed dollar breakdown, 3. good breadth and cyclicals performance, better technicals in European and Asian stock indices, and 4. money pulling out of treasuries which should seek out pro-risk assets (by solar/secular/cyclical history). Broken down into my 3 areas on involvement: I don’t want to exit stock indices longs yet because we do not yet see sufficient congregation of cyclical bull market top indicators; I do not want to exit commodity longs yet because I maintain by solar/secular history the parabolic peak is to come 2013/2014; and I do not want to exit treasury shorts yet because I believe a new secular bear market in treasuries is getting underway and a rise in yields (of some note) should be one feature of the end of the cyclical stocks bull.

Next week is usually a quiet week in the markets globally, due to Xmas, but there is the fiscal cliff deadline at the turn of the year, and so this period could be more volatile. My expectation is that agreement will be reached to prevent the fiscal cliff, and that markets will enjoy a relief rally when that occurs. However, there are no guarantees, so let’s see how things unfold. Next week I will be in Bangkok.

Current State Of Play

Hi all, in a cafe with Wifi, due to storm-damaged internet access at our second hotel (neat Ubud, Bali), so will get down to it.

My trading boils down to this. I am long commodities, attempting to time the secular bull market top. I am long stocks, attempting to gauge the cyclical bull market top. And I am to a smaller extent short treasuries, believing us to have made a secular bull market top in treasuries this mid-year. Currently I believe all these still look good.

Treasuries are still ‘potentially’ making a W-bottom. By Gann they should have bottomed mid-year, and ditto by solar/secular history, which predicts yields should now rise into a stocks cyclical bull top. Still very tentative, more time is required to judge this one.

14dec20122Source: Stockcharts

Regarding the cyclical bull market in stocks (within a secular bear market), there are several ways to assess its likelihood of continuation:

1. A topping process lasting months with reversals of reversals of reversals – as the Hang Seng, Dax and now the FTSE have broken out of their long term triangles I don’t think this is happening yet, though US stocks show the most potential.

2. Overbought and overbullish extremes – we see largely neutral sentiment readings and only short term overbought readings (which I believe has produced the pullback of the last two days).

3. Breadth divergence – NYSE breadth has just made an all-time high, which is bullish.

4. New lows confluence prior to top – we haven’t seen this leading into the US Q3 highs.

5. Defensives outperforming cyclicals – again not seen, cyclicals have been strong.

6. Major distribution days near the highs – we did see these near the US Q3 highs, but since we have seen major accumulation days, which are bullish.

7. Rising inflation, tightening yields, yield curve flat or negative – we don’t yet see these macro developments

8. Rolling over of leading indicators and recession model alerts – we see evidence for growth into Q1 2013 – more below.

The latest CB global leading indicators revealed positive strong for Spain and Korea, but slightly weak for UK and Japan. The latest OECD leading indicators show weak growth but overall above long term trend for the OECD nations:

14dec20123

Source: OECD

Note the horizontal lines are the long term growth trendlines, rather than expansion/contraction divide. Drawing out the narrow money supply leading indicator, the forecast is for global industrial output to increase into Jan/Feb 2013:

14dec20124Source: Moneymovesmarkets

HSBC’s flash PMI for China today came in at 50.9 for December, a 14-month high, adding weight to an upturn in China, and Chinese stocks continue to attempt to make a bottom, with a further 3% jump today at the time of writing.

Economic Surprises have recently weakened for both the US and Asia, but both remain positive. One to watch, as a trend change in this indicator has previously led a trend change in equities.

14dec20125

Commodities have been weaker than equities this last couple of weeks, but I believe they will catch up, with support from an improving China, an improving Euro-USD, depressed sentiment in certain commodities and gold miners. We just passed through the new moon, but with very tame geomagnetism there is support for commodities to rise into year end, as shown by the new model uptrend here:

14dec20128

Finally, a look back at history reveals that the closest mirror for US equities from history is 1967, with a 90% correlation. I find this interesting, because 1968 was the secular equities top and the solar peak – around November/December 1968. In other words, equities are behaving very similarly, as we head into next year’s solar peak, which I anticipate to be a cyclical stocks peak and then secular commodities peak.

14dec20127Source: MCRI

In short, I see no current reason to change my outlook that the secular commodities bull and cyclical stocks bull will continue into the start of 2013. I continue to watch all the measures and indicators outlined above, and believe my first move will be to close of out of the bulk of equities longs, but as yet we do not see typical topping indicators nor compelling divergence in leading indicators.

Currently we are planning to spend a further week and a half in Bali. The rest of our trip is looking like this (subject to change of course, as we are booking and ‘feeling it’ as we go): Thailand, Philippines, Hong Kong, New Zealand, Fiji, Australia, Sri Lanka and maybe Maldives. There are other countries and continents we would dearly like to visit, but we have to draw the line somewhere as time is limited.

Have a great weekend all.

Friday Roundup

Breakout in the Dax:

7dec20121Source: Stockcharts

The FTSE is currently pushing for breakout too.  The US stock indices have made a little consolidation for a potential inverse head and shoulders.

7dec20123Source: Stockcharts

Break out in high yield corporate bonds:

7dec20122Source: Stockcharts

Commodities have not been as strong this week, but the collective CCI index uptrend initiated mid-2012 is still in tact. I am aware that I have hardly mentioned crude oil all year, even though I continue to hold a significant long position in this energy, but for 2 years now it has been range-trading around $100, and there has been little to say therefore about the chart action. However, the longer term picture still shows a secular bull in play since the turn of the century with an extreme episode of greed and fear around 2008, and if that trend is still valid (I believe it is) then we should see crude oil re-take $100 soon.

7dec20124Source: IndexMundi

The Markit / JP Morgan global services PMI was released this week and shows an uptick, as with the manufacturing PMI of the last post.

7dec20125

Combining the two looks like this:

7dec20126Source: Markit

Positive developments in stock indices match up with improvement in PMIs and leading indicators, and I believe we will see pro-risk advance further into year-end.

Lastly, below we see developments in industrial output in the last secular bear of the 1970s have been mirrored very closely in this secular bear. A continuation of the parallel would see a recession in late 2013 / 2014, shallower than in 2008. That would all fit with my solar/secular expectations. Of course, the parallel may fail, but I suggest that the overlay adds weight to my timings as to where we are in the overall cycle.

7dec20127Source: Moneymovesmarkets

Have a great weekend all. My current outlook in Southern Thailand (just trying to work out where we are heading next…):

Panwa

Final Month Of 2012

Certain key assets are finely poised as we enter December. The UK FTSE is once again attempting upside breakout from its long term triangle.

4dec20124

The German Dax is also back attacking key resistance. Yesterday it was repelled at this key level. I suggested yesterday it may need a couple of sessions’ consolidation before a breakout – and this is because it has already travelled a fair way since mid November on ‘one leg’.

4dec20123

The Nasdaq (and equally the Dow) is attempting to reclaim its 200MA (the SP500 is clear above). The Nasdaq remains in its neat cyclical bull channel, and stocks in general continue to display good breadth and cyclicals performance that are not suggestive of a top.

4dec20125

That said, a combined failure in the FTSE and Dax at upper resistance and the Nas and dow at their 200MAs would open up the possibility of a renewed leg down, and for the two US indices that would then look more like a major top had occurred.

I maintain a bullish outlook for equities into year end, due to positive seasonality (including Presidential), tame forecast geomagnetism, a lack of common cyclical bull topping indicators in the US indices, and renewed breakout attempts in the FTSE and Dax (typically resistance caves in under repeated attacks, the Hang Seng has already led the way, and by solar/secular history an upwards breakout at this point would be normal). We have a period now into and around the new moon of 13 December which should also be supportive. So let’s see if I am correct and all these indices break upwards.

Let me just list one or two other ‘important’ dates into year end. The Puetz crash window extends into the end of this week. The Mayan global transformation / apocalypse is 21 December, the last major Bradley turn is 22 December. The last full moon of the year is 28 December and the fiscal cliff deadline is the end of December. Out of those five, I am not convinced of the first three, but it does no harm to maintain awareness.

The finely poised position in key assets extends to commodities and Euro-USD. The broad CCI commodities index is at downsloping resistance in a potential bullish head and shoulders formation. Ditto the Euro-USD.

4dec20121

Source: Bloomberg4dec20122

Combining stocks, commodities and Euro-USD, we have two clear paths forward: one, pro-risk breaks out (the correction in October / November was a correction in an ongoing cyclical bull), and two, pro-risk is repelled here and resumes downward (the rally in the second half of November was a relief rally in a new downtrend). As is usual when the markets are finely poised, some confusing and teasing action could occur this week, with both bulls and bears prematurely claiming victory before true resolution comes to pass.

Besides the reasons above, one other key reason why I favour a bullish year end for pro-risk, is the improvement in global leading indicators. Markit released many individual country PMI reports yesterday, including fresh growth in China (whether looking at official or HSBC data). Below is the combined global picture, and the theme is fairly clear: a distinct up-tick. This is echoed in Conference Board global leading indicators. The general improvement is not in doubt, the question is whether this is just a temporary relief rally in a continued downtrend, or whether leading indicators have bottomed out.

4dec20126Source: Markit

And here we get to the real key issue. By solar cycles, a growthflationary finale should occur into next year’s solar peak. By stock market history, cyclical stocks bulls end with excessive inflation and overtightening of rates. A cyclical stocks bear here and a tipping into global recession at this point into 2013 would mark an anomaly in both those historic indicators. It would be evidence that central bank actions in cutting rates and applying stimulus have been impotent in this cycle, and that too would also mark an anomaly in history, because historically interest rate cuts have had a positive impact on the economy between 9 and 24 months after cutting cycles, and Quantitative Easing has so far been shown to work its impact through in the two years following asset purchases. The two charts below show the renewed easing and stimulating efforts over the last 18 months – not as dramatic as in 2008-9 but nonetheless a fresh round of pro-action and intervention.

4dec20127

4dec20128Source: Action Forex

If the mechanism is not broken, and such action is not impotent, then we ought to see economic improvement occurring now and into next year. I believe this is the case, as currently global leading indicators are improving, PMIs are improving, and growth in narrow money suggests global industrial output will increase ahead. It is possible that we therefore do see that growthlationary finale next year and we do get normal cyclical stocks bull termination under conditions of excessive frothiness and an upswing in market rates. But one step at at time – first we need to see a couple of months of continued improvement in leading indicators to be confident that this is a new up trend and a normal positive impact lag to central bank actions together with normal buying/speculating/risk-taking behaviour into the solar maximum. If this does not occur and instead we topple over again in terms of leading indicators and key assets, then either (i) the triple historic anomaly would have indeed come to pass (‘it’s different this time’) or (ii) yet further central bank action and unorthodox policy tools are deployed soon ahead before we finally do get that growthflationary finale not too far from the solar peak.

Until evidence points otherwise, I side with it not being different this time and that we will see normal behaviour into the solar maximum, aided by lagged impacts from central bank actions, and normal conditions to come to pass for a cyclical stocks bull end. I believe the current technical action in risk assets is supportive of this, in that we see certain key stock indices pushing to break out, an absence of normal cyclical stocks bull topping indicators (such as breadth divergence and defensives outperforming) and gold in a renewed up trend back above its 200MA following an 11 month consolidation.

Commodities Peaks And Solar Peaks

Today’s exercise is to look  back in history at the previous secular commodity peaks of 1917, 1947 and 1980, that correlate with the solar peaks of August 1917, May 1947 and December 1979, and see how close to the solar peaks individual commodities peaked. This can then assist in expectations for commodities into and around 2013’s solar peak, which I suggest will again be the scene of a secular commodities peak. The data available is spotty, so I have to make do with a selection of four differing commodities for each of the 3 periods in history, but it is nonetheless a useful guide.

Firstly, 1917. Copper, corn and wheat all peaked between 5 months before and on the actual official solar peak. Whilst silver did not peak until 2 years later, its acceleration began around 12 months before the solar peak.

Source: St Louis Fed

Secondly, 1947. Oats, corn and wheat all peaked around 6 months after the solar peak. Whilst copper did not top out until 15 months after the solar peak, the bulk of its gains occurred in the run up into the solar peak.

Source: St Louis Fed

Thirdly, 1980. Copper and gold peaked with the sun, with oil and sugar peaking 4 months and 9 months after the solar peak respectively.

Source: St Louis Fed

Source: Speculative Investor

On current forecasts, a solar peak should occur sometime between Q2 2013 and Q4 2013, with SIDC projecting nearer the former and NASA and Jan (of Sibet) closer to the latter. Based on the historical examples above, we might therefore look out for commodities making final parabolic tops as of the start of 2013, right through to 2014. The bias from history is more towards commodity price peaks later than the official solar peak, so we might rather look to the second half of 2013 or even early 2014, subject to solar progress. To add to this, another look at the charts above shows that most of the commodities made a big acceleration of around a year’s duration before reaching their tops (or the solar tops). Right now, the CCI commodities index (a broad measure of commodity momentum) is some way beneath its 2011 high and not yet in a major acceleration. By Gann, that acceleration should just have begun, in late November. I believe Gann methodology to some degree reflects solar methodology, in that it draws together mirrors from history to predict the future – only by my reckoning, it is the influence of the sun that makes for these repetitions in time. Nevertheless, it’s a cross reference.

One further conclusion from the above charts is that there was broad commodities participation in each period, so we might also expect the majority of, or even all, commodities to participate in a final ascent (though perhaps with a lag between individual peaks) this time round. If we consider our current period as a K-winter, similar to 1947, where gold is the lead asset, then nevertheless we can see back in 1947 a range of commodities also participated in parabolic ascents into and around the peak. Therefore, exposure to a range of commodities ought to serve well this time around, without the need to specifically cherry pick.

To repeat, 2013 is a major test for my solar theorising. I consider I have a true sample of 3 from history (three secular commodities / solar peak correlations), which by any statistician’s measure is a fairly meagre sample, and a 4th would add substantial weight. However, when we draw in my historical correlations between solar peaks and secular stocks peaks, and solar minimums with crashes, panics and bottoms, the relations through history between secular asset cycles and solar cycles are more compelling and the sample significantly larger. I also look on it another way, in that commodities secular peaks occur only every 30 years or so, and it has been amazing how close to solar maximums these secular commodities peaks have all fallen (including several exact hits shown above), given that huge window in time. The validity of this current cycle is already partially formed in that commodities again broke into a secular bull market in the decade leading up to the solar peak and the secular commodities peak occurred at the earliest 2011 (until that CCI high is taken out), which is again close to the solar maximum, in the context of a 30 year cycle. But I maintain 2011 was not the high, and that the secular peak will be closer to the solar peak, and that the final parabolic ascent is right ahead. If commodities rather continue to rise for some years following the solar peak, rather than topping out with the sun, then that would of course reduce the validity. As fossil fuel exhaustion and natural resource scarcity are real threats, that could be caused by a paradigm shift whereby commodities are permanently repriced higher. However, by my previous analysis, I do not expect that scenario in this secular cycle, but rather in the next secular commodities cycle of mid-century.

I maintain a broad long commodities exposure, with the largest exposure in precious metals, but significant positions in energy and agriculture too.

Malaysia

Tomorrow I leave Malaysia for Thailand, starting with 4 nights in Phuket. My Malaysian journey has been limited to Peninsular Malaysia (rather than Malaysian Borneo), taking in Melaka, Kuala Lumpur, Penang and Langkawi, and my overwhelming impression is the friendliness and peacefulness of the people. I found this most striking in Kuala Lumpur: a capital city where people are warm and respectful to one another is a curious and wonderful anomaly in my experience of capital cities. Now you are aware that I am accompanied by a family and that might influence the way people react and behave around me, so here is supportive evidence from a couple of studies.

Firstly, the annual Forbes friendliest countries rankings puts Malaysia in 10th spot globally:

1. Cayman Islands

2. Australia

3. United Kingdom

4. Canada

5. New Zealand

6. Spain

7. United States

8. Bermuda

9. South Africa

10. Malaysia

Secondly, the Global Peace Index by the Institue for Economics and Peace, which measures safety, security and conflict, ranks Malaysia in 20th spot globally:

1. Iceland

2. Denmark

3. New Zealand

4. Canada

5. Japan

6. Austria

7. Ireland

8. Slovenia

9. Finland

10. Switzerland

11. Belgim

12. Qatar

13. Czech

14. Sweden

15. Germany

16. Portugal

17. Hungary

18. Norway

19. Bhutan

20. Malaysia

Malaysia also was rated the second happiest nation in South East Asia after Singapore, in the UN World Happiness Report (measured between 2005 and 2011).

When I asked Malaysians why there was such apparent harmony and friendliness, the response was that this is a country of several peoples and cultures living together as one: out of the diversity has come unity (it is around 50% Malay, 24% Chinese, 11% indigenous, 7% Indian and 7% various others).

Clearly, in other countries disparate groups living together has led to conflict and unhappiness, so whether it be cultural, religious, political or social influences at work, it is what is, and the Malaysian people made it a real pleasure to be in their country – so we have been in no hurry to leave. Even in the rawer parts of Kuala Lumpur, I found the atmosphere remained safe and respectful.

Similar to Singapore, for an Englishman like myself, there is a nice blend of the familiar and the exotic. The legacy of British Empire rule is English language everywhere, driving on the left, UK plug sockets and the colonial-styled luxury of the Shangri-La in KL. Yet, the influence of Islam, the multi-cultural cuisine reflecting the multi-cultural society, the 30 degree heat, the tropical storms, the palm plantations, the rain forests, the monkeys and lizards, and the marine life on the reef all made for a terrific novel exotic experience. The icing on the cake was a cost of living that I found to be overall about half that of the UK – our accommodation, transport and dining. In an odd twist, eating out worked out cheaper than self-catering from the supermarket. How is that reverse premium possible?

One contributing factor to the lower cost of living is Malaysia’s oil production and associated energy subsidies (several oil-producing country governments subsidise fuel, to benefit their economies). Malaysia also has a rich natural resource heritage – it is a leading global producer and exporter or rubber and palm oil, and also wood and wood products. But it has also become a diversified economy, including becoming the world’s leading Islamic finance and banking centre, and operating one of the world’s only six 5-star airlines. In short, it is an economic success story since becoming independent half a century ago, and is the 28th largest economy in the world. GDP has grown at an average 6.5% per annum in that time, charted below:

Source: World Bank

The Asian Banking Crisis of 1997 made for the biggest dip in economic development, but it fairly swiftly recovered to trend. Debt to GDP is around 50%, a manageable level.

The housing market has been the 9th hottest real estate market in the world over the last 5 years, but property prices remain very reasonable relative to other hot property markets such as Switzerland and Singapore. The stock market (the KLCI) has also performed well, as shown below, but is currently valued at at p/e of 15 and a CAPE of 20, so does not represent an interesting opportunity at the moment.

Source: Bloomberg

There is also a government scheme to encourage foreigners to live in Malaysia on rolling 10 year passes, with fairly low entry criteria compared to most other countries. Details here.

Like anywhere, there are negatives, and the following are my such perceptions. Whilst the infrastructure and public transport is generally of a high standard, the common taxis are largely decrepit. Whilst the area of Kuala Lumpur around the Petronas Towers is very nice – there are large chunks of the capital city which are, to be blunt, an eyesore. Whilst Penang is a cosmopolitan island with some plush developments, there is also a fairly large contrast there between the poor and the rich. The open drainage system throughout the country causes some bad odours, and capital punishment and certain particularly harsh laws may not appeal to everyone.

As this is a country that can be currently considered in transition from a developing country to a developed country, it is easy to imagine some of these issues being resolved with continued growth. There is a lot of new build development occurring in Johor, Melaka and Penang – a lot of ambitious investment. I can contrast that with large parts of the UK where building has slowed to a standstill and high streets remain partially empty since the 2008 recession. All in all, Malaysia’s people, natural resources, sustained economic growth and investment, and geographic position in the world for this century (expecting Asia to lead global growth) make it an exciting and appealing country. I really can’t praise it enough.

Some pics. The Petronas Towers in KL – the tallest ‘twin-towers’ in the world. Chinese clans still living on stilts in the sea on Penang. The rainforest island of Langkawi. And monkeys everywhere…

In Charts

The CB leading indicators for Germany came in at +0.1 (previous month flat), and for USA +0.2 (previous month +0.5). The summary table is below and shows the overall positive global picture.

Source: Conference Board

Next are the Markit PMIs released this week for the Eurozone, USA and China. The Eurozone remains weak in this leading indicator, but USA and China both show pick up and positive readings.

Source all: Markit

I maintain the opinion that leading indicators globally are overall showing renewed positivity, and that should bode well for risk assets into year end. Presidential seasonality and Gann are also supportive.

Source: Bespoke / Moneygame / my update

To counter that, we have down pressure into next week’s full moon. Today, the Friday after Thanksgiving, has a positive historical seasonality, but not Monday. Given the v-bounce in US stocks, I believe there are several reasons why the market may pull back next week, and the question is whether this produces a dynamic ‘W’ base from which to then rally into year end, or whether the market drops lower than the mid-November low and makes a positive divergence (or even lack of positive divergence).

Below is the SP500. The overall wedge shape is bearish, but the market met twin support (shown) at the mid-November lows, together with bottoming indicators such as Nymo and capitulative breadth. A drop back to the lower support or just below, before advancing, or a move up to the top of the wedge for a slightly higher high (with potential negative divergences, if this were a topping process), would both be possible outcomes here. However, the swift reclaim of the 200MA this week could provide additional support for the market holding up here rather than dropping down to the lower boundary again.

Next is the Nasdaq, which has been the neatest index technically since the cyclical bull began. Here again we can see the market reached rising support at the mid-November low. A lower low would therefore spell trouble, and, given the improving global picture ahead, and the normal topping process (push back up to the highs with negative divergences) if this index is already topping, then a higher low or continued uptrend seems more likely, in my opinion.

Looking wider, I noted a few days ago that the Hang Seng was backtesting the breakout of its long term triangle, and it has since advanced again, suggesting a successful backtest. It’s still tentative at this stage, but looks promising.

The Morgan Stanley China A shares ETF shows a tentative breakout from a declining wedge on positive RSI divergence.

The UK FTSE is still within its long term triangle, but is again pushing back up towards the declining resistance. By solar secular history, a breakout would be normal, followed by a pullback towards the triangle nose, before secular bull momentum begins – all taking place over the next 18 months or so.

The German Dax remains technically bullish. Various supports and resistances are shown, with the Dax flirting with breakout of the longer term resistance also.

Looking at other assets, gold is looking technically positive to eventually make new secular highs. A breakout upwards out of the 11 month consolidation (shown), and a bounce above the 200MA again, which has largely supported the secular bull to date, are evidence for this. We are in a positive seasonal period of the year for precious metals also.

10 year treasury yields are still toying with a potential bottom. A positive RSI divergence on the longer term view:

Source: Yahoo

And a similar scenario in the nearer term view, as well as a potential higher low in November than in July. That the mid-year low will hold here is unproven, but I have previously outlined reasons why I believe it will do so, and that it could mark the secular low for bond yields.

Source: Stockcharts

Next I show coffee and sugar, both at extreme low levels of sentiment/oversold. I suggest both are ripe for a bounce here, but whether they can muster new uptrends at this point is unclear. The parabolic moves in both are recent, and therefore more time may be needed. However, if my predictions for secular finales in commodities and inflation come good, then I would expect most commodities to be dragged upwards again.

Source: TradingCharts

The following chart is an ETF for grains, which were the best performing commodities of mid-2012, due to adverse weather conditions. They have now made a 50% retrace of that upmove and on positive RSI divergence. By Gann, commodities should begin a large upmove as of now, so this could be a suitable point at which to resume an uptrend.

In short, in the near term next week, I predict some degree of correction or consolidation in stocks, which could imply pro-risk in general. Thereafter I expect a push upwards into year end, supported by improving leading indicators, positive technical setups, and Gann and seasonals. What would change my mind? Other leading indicators foretelling contrasting global weakness, greater evidence of cyclical stocks topping indicators, or a technical breakdown in key assets, such as a breakdown from the Nasdaq channel.

Global Macro and Leading Indicators

Let me recap on my overall position. I am long commodities for a parabolic finale into a secular peak in 2013, with my biggest exposure in precious metals. I am long stock indices, largely opened in Q2 2012, looking for a cyclical bull top in the current window stretching into 2013. I have recently added long certain stock indices looking for a longer term hold, where I believe secular bear value has been reached, namely China, Russia, Japan and Austria. And lastly, I am short treasuries, with less exposure than stocks and commodities, also looking longer term for a new secular treasuries bear market.

The recent draw down in equities has reduced my open profits – but judge me on my trades once they are closed. A cyclical stocks top is a process, with common characteristics. Large sideways volatility with alternate up down moves as the market gradually rolls over in a period of months, and a double top or higher high where we see negative divergences in internals, such as breadth. As the topping process unfolds, we should see more and more issues at new lows as participation thins, and we should see defensives outperforming cyclicals. Right now, we continue to see cyclicals outperforming defensives despite the falls, we have not seen the trademark congregation of new lows leading into this, and if this is a top, we have yet to see the push back up the highs, accompanied by the telltale weakening internals. I have not blindly held on to long equity positions, but am awaiting the coming together of topping indicators to sell out. Patience, as always, is the key.

If a topping process in equities has not begun, then we should need to see improvement in global macro and leading indicator data to support bull continuation following this correction. If a broad commodities acceleration is to take place, then even more reason to need improvement in such data. In another twist, we now see signs that data may indeed be improving again.

Here are the latest Conference Board leading indicator releases:

UK +0.2 (same +0.2 previous month)

Japan -0.4 (up from -0.5 previous month)

Spain +0.3 (up from -0.1 previous month)

Korea +1.2 (up from -0.6 previous month)

So improvement across the board again, and a big leap in Korea in particular.

Next is a chart showing the drop in industrial output globally that has been recently taken place (aggregated for the G7 and leading emerging 7 nations). However, the leading indicator here shows an upturn ahead. This leading indicator is global real narrow money expansion and precedes economic activity by around 6 months. Global real narrow money supply has been growing since a bottom in April/May, so industrial production should now start to increase again.

China’s recent improvement in economic data could therefore be part of a wider pick up in growth globally ahead.

For the US, there continues to be mixed data, but the overall picture is represented here by ISI’s diffusion index, which subtracts the bad data from the good, and it can be seen this is currently positive and rising, not the picture of an economy rolling over.

Source: Advisoranalyst / Factset / ISI

The Economic Surprise Index for the US also maintains a positive picture:

Source: Advisoranalyst / Factset / ISI

Overlaying this economic surprise index on US stock market performance reveals a current disconnect – either economic data should now rapidly start to disappoint or stocks should reverse upwards – or some combination of the two.

So let’s see, but maybe tipping into global recession is premature. It could be that the mid year series of rate cuts, renewed QE and other stimulus measures needed time to have an impact. By solar-secular history, a growthflationary finale should be the theme into next year’s solar peak. A cyclical stocks bull top should also be accompanied by rising bond yields, which would be more likely under growthflationary conditions. The relationship between 5 and 10 year inflation expectations and real CPI reveals that inflation should pick up as we enter 2013. If global deflation is setting in then that would be difficult to achieve.

Lastly, here is the updated Hang Seng chart for interest (click for full size). It recently broke out of its long term triangle and is now backtesting the breakout. Will it hold and push on? Failure here would be particularly bearish, as a return into the triangle would suggest a fake out had occurred, with the possibility of a subsequent breakdown the other way.