
The CB leading indicators for Germany came in at +0.1 (previous month flat), and for USA +0.2 (previous month +0.5). The summary table is below and shows the overall positive global picture.
 Source: Conference Board
Next are the Markit PMIs released this week for the Eurozone, USA and China. The Eurozone remains weak in this leading indicator, but USA and China both show pick up and positive readings.


 Source all: Markit
I maintain the opinion that leading indicators globally are overall showing renewed positivity, and that should bode well for risk assets into year end. Presidential seasonality and Gann are also supportive.

Source: Bespoke / Moneygame / my update
To counter that, we have down pressure into next week’s full moon. Today, the Friday after Thanksgiving, has a positive historical seasonality, but not Monday. Given the v-bounce in US stocks, I believe there are several reasons why the market may pull back next week, and the question is whether this produces a dynamic ‘W’ base from which to then rally into year end, or whether the market drops lower than the mid-November low and makes a positive divergence (or even lack of positive divergence).
Below is the SP500. The overall wedge shape is bearish, but the market met twin support (shown) at the mid-November lows, together with bottoming indicators such as Nymo and capitulative breadth. A drop back to the lower support or just below, before advancing, or a move up to the top of the wedge for a slightly higher high (with potential negative divergences, if this were a topping process), would both be possible outcomes here. However, the swift reclaim of the 200MA this week could provide additional support for the market holding up here rather than dropping down to the lower boundary again.

Next is the Nasdaq, which has been the neatest index technically since the cyclical bull began. Here again we can see the market reached rising support at the mid-November low. A lower low would therefore spell trouble, and, given the improving global picture ahead, and the normal topping process (push back up to the highs with negative divergences) if this index is already topping, then a higher low or continued uptrend seems more likely, in my opinion.

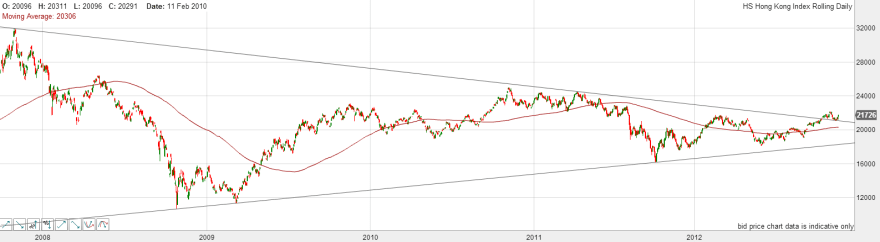
Looking wider, I noted a few days ago that the Hang Seng was backtesting the breakout of its long term triangle, and it has since advanced again, suggesting a successful backtest. It’s still tentative at this stage, but looks promising.

The Morgan Stanley China A shares ETF shows a tentative breakout from a declining wedge on positive RSI divergence.

The UK FTSE is still within its long term triangle, but is again pushing back up towards the declining resistance. By solar secular history, a breakout would be normal, followed by a pullback towards the triangle nose, before secular bull momentum begins – all taking place over the next 18 months or so.

The German Dax remains technically bullish. Various supports and resistances are shown, with the Dax flirting with breakout of the longer term resistance also.

Looking at other assets, gold is looking technically positive to eventually make new secular highs. A breakout upwards out of the 11 month consolidation (shown), and a bounce above the 200MA again, which has largely supported the secular bull to date, are evidence for this. We are in a positive seasonal period of the year for precious metals also.

10 year treasury yields are still toying with a potential bottom. A positive RSI divergence on the longer term view:

Source: Yahoo
And a similar scenario in the nearer term view, as well as a potential higher low in November than in July. That the mid-year low will hold here is unproven, but I have previously outlined reasons why I believe it will do so, and that it could mark the secular low for bond yields.

Source: Stockcharts
Next I show coffee and sugar, both at extreme low levels of sentiment/oversold. I suggest both are ripe for a bounce here, but whether they can muster new uptrends at this point is unclear. The parabolic moves in both are recent, and therefore more time may be needed. However, if my predictions for secular finales in commodities and inflation come good, then I would expect most commodities to be dragged upwards again.


Source: TradingCharts
The following chart is an ETF for grains, which were the best performing commodities of mid-2012, due to adverse weather conditions. They have now made a 50% retrace of that upmove and on positive RSI divergence. By Gann, commodities should begin a large upmove as of now, so this could be a suitable point at which to resume an uptrend.

In short, in the near term next week, I predict some degree of correction or consolidation in stocks, which could imply pro-risk in general. Thereafter I expect a push upwards into year end, supported by improving leading indicators, positive technical setups, and Gann and seasonals. What would change my mind? Other leading indicators foretelling contrasting global weakness, greater evidence of cyclical stocks topping indicators, or a technical breakdown in key assets, such as a breakdown from the Nasdaq channel.

Still, target for DOW, next days/weeks> 11.700-12.000. After, a big rebound.
Regards, John.
Great analysis. I share the view but always keeping long as short. Long term we are fooled by randomness. Look out for those Peutz dates and then up we may go. Good luck and stay safe to everyone!
Took some SPX profit at resistance. . Market very strong but perhaps short term unsustainable as Slow Stoch (5,1) reached 97.64 when I was selling while $VIX is printing a hollow candlestick.
TLT is telling bulls to sit down. This leg up is exhausting and a pause to refresh as bulls accomplished a Fib. 50% retracement. There is no rush to add any long positions.
I think War is coming in Middle East. Historically very inflationary. Buying puts as protection.
Russian warships ‘sail to Gaza for possible evacuation of citizens’
A group of warships from Russia’s Black Sea fleet is headed to the Gaza Strip, a Navy source told RIA Novosti news agency. The ships will evacuate Russian citizens from the troubled region should the Israel-Gaza conflict escalate.
John,
Market may pull back next week as you stated, but it appears that corporate insiders are buying now in anticipation that bottom may have been reached. Article states that according to one indicator, insiders are more than four times more optimistic about their companies’ shares now than two months ago which may be a good sign.
http://www.marketwatch.com/story/insider-behavior-points-to-imminent-rally-2012-11-21
Don’t think CEO’s of companies can predict their earnings better than the rest ;). Price is price – price and the sun are real. Earnings is a funnymental.
While I do follow the Sun I also follow the historical odds. According to the article, last Friday the sell-to-buy ratio was 1.58 to 1. Since the March 2009 low, the sell-to-buy ratio has dropped below 2 to 1 only three times and each time there was a significant market low within a few weeks. I find this oddly comforting at least for the short term.
$NYADV AT 2,425=very overbought as this past week resigetered unseen high # since July. This leg up may go even higher after a reaction.
The June rally retraced 50% before moving higher….so we may see SPX 1,375 again for a chance to reload….but watch out if it dips below 1,370.
$OEXA200R (weekly) powerful reversal candlestick pattern. Bulls stole the ball from the bears and make a run to the board.
Thank you guys