Here are some of the all-time records delivered in 2014:
1. Highest ever Wilshire 5000 market cap to GDP valuation for equities
2. Highest ever margin debt to GDP ratio and lowest ever net investor credit
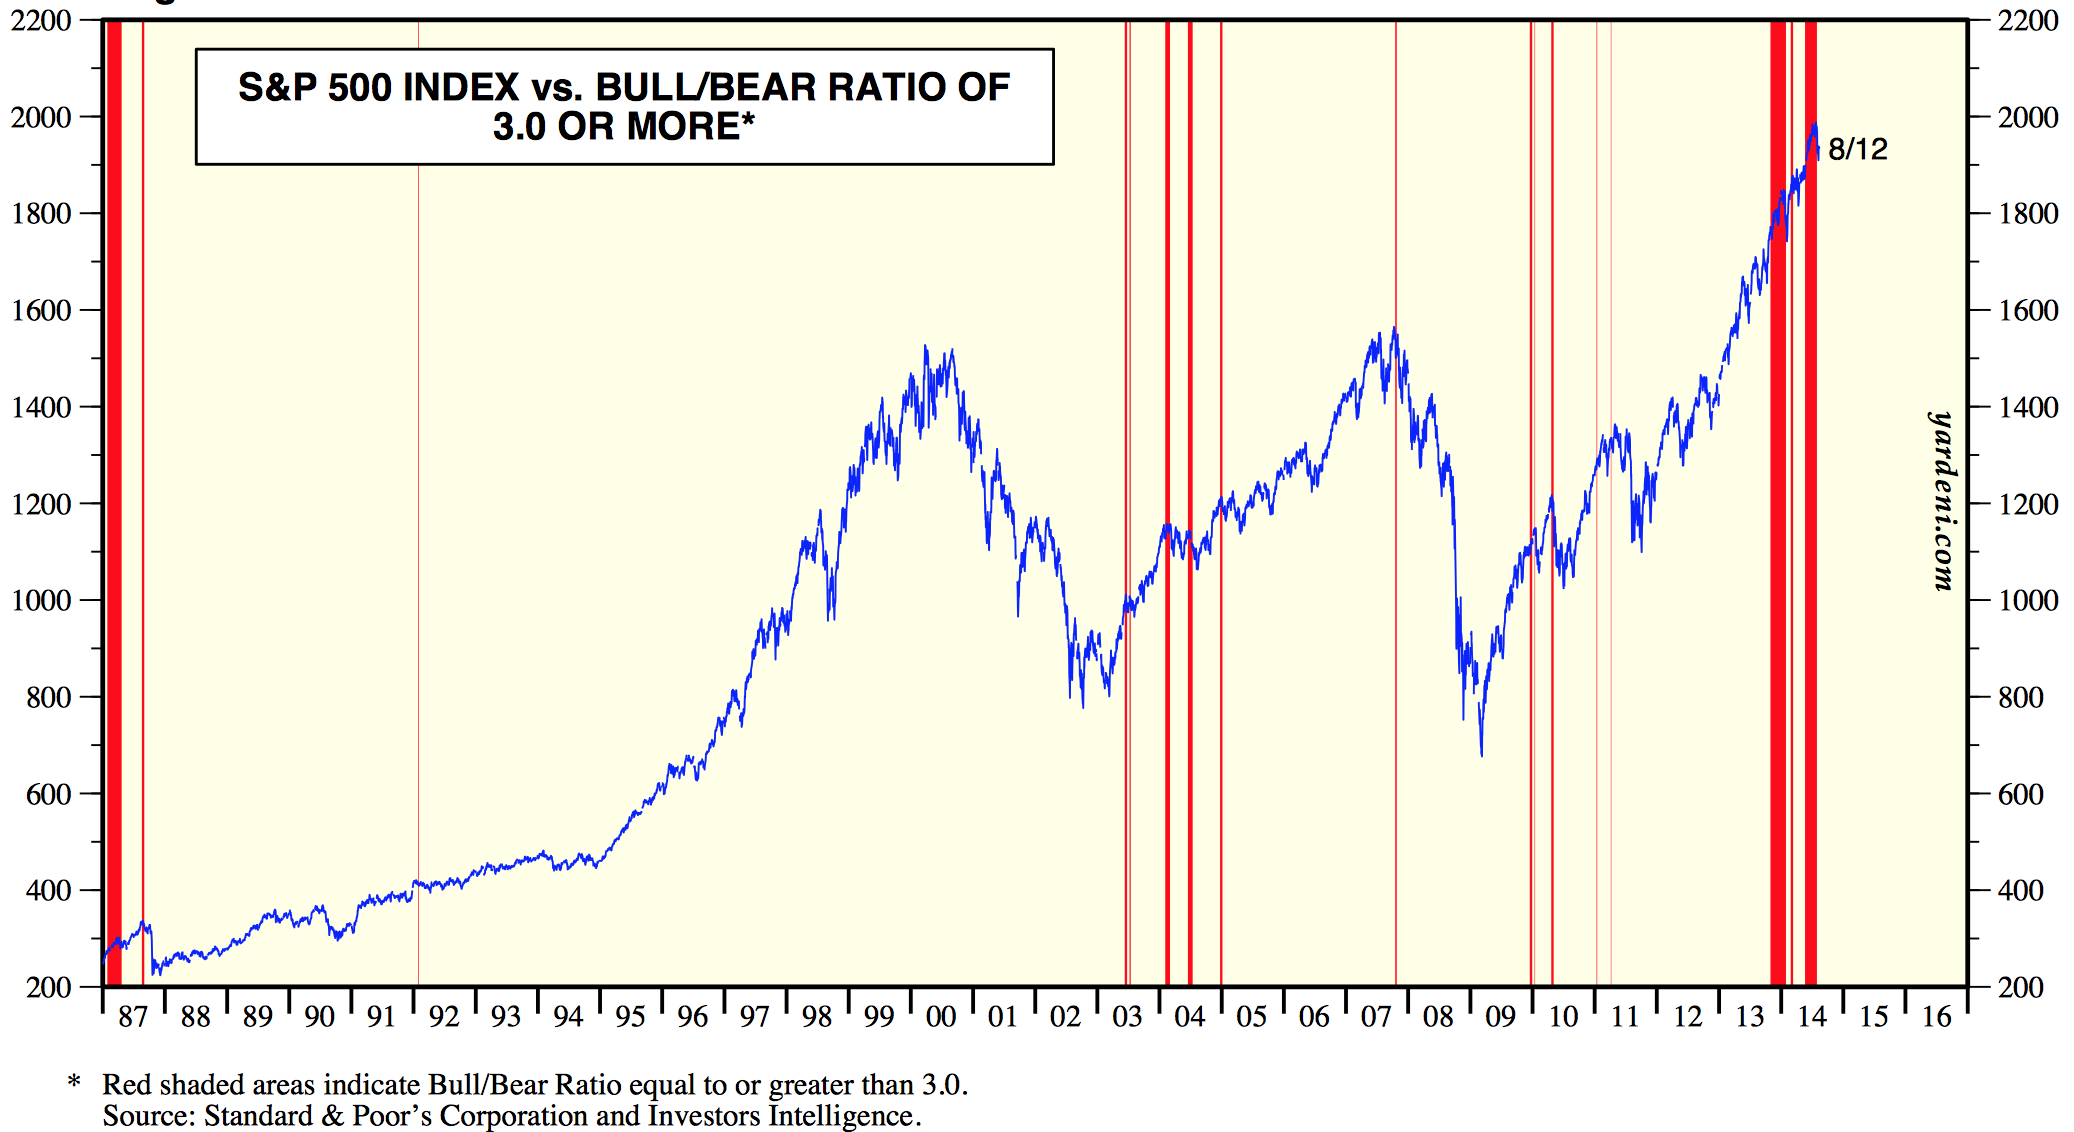
3. Record extreme INVI bullish sentiment for equities
4. Record extreme bull-bear Rydex equity fund allocation
5. All-time low in junk bond yields
6. All-time low in the VXO volatility index (the original Vix)
7. Highest ever cluster of extreme Skew (tail-risk) readings in July
8. Highest ever Russell 2000 valuation by trailing p/e
9. Lowest ever Spanish bond yields
10. Lowest ever US quarterly GDP print that did not fall within a recession
And this week:
11. Lowest HSBC China services PMI since records began
12. Lowest ISE equity put/call ratio since records began
What I have been pondering is, what are the chances that we see not just a market crash but an all-time record market crash, given the elastic band is more stretched than ever?
Here are the biggest crashes in history, covering US, UK and Japan stock indices:
2011 August world indices
2010 May flash crash US
2008 Sep-Nov world indices
2001 Sep FTSE
2000 Mar-May Nasdaq
1990 Feb-Apr and Jul-Sep Nikkei
1987 October world indices
1929 Sep-Nov Dow
1907 Feb-Mar, Aug-Oct Dow
Draw them together and all the crashes happened in two windows in the year: Feb-May and July-November, with the latter period being the most dominant. This fits with the seasonal model of the stock markets, where geomagnetism influences collective optimism and pessimism. The two red dotted lines show the scenes of the crashes, both running from peak optimism to greatest pessimism.
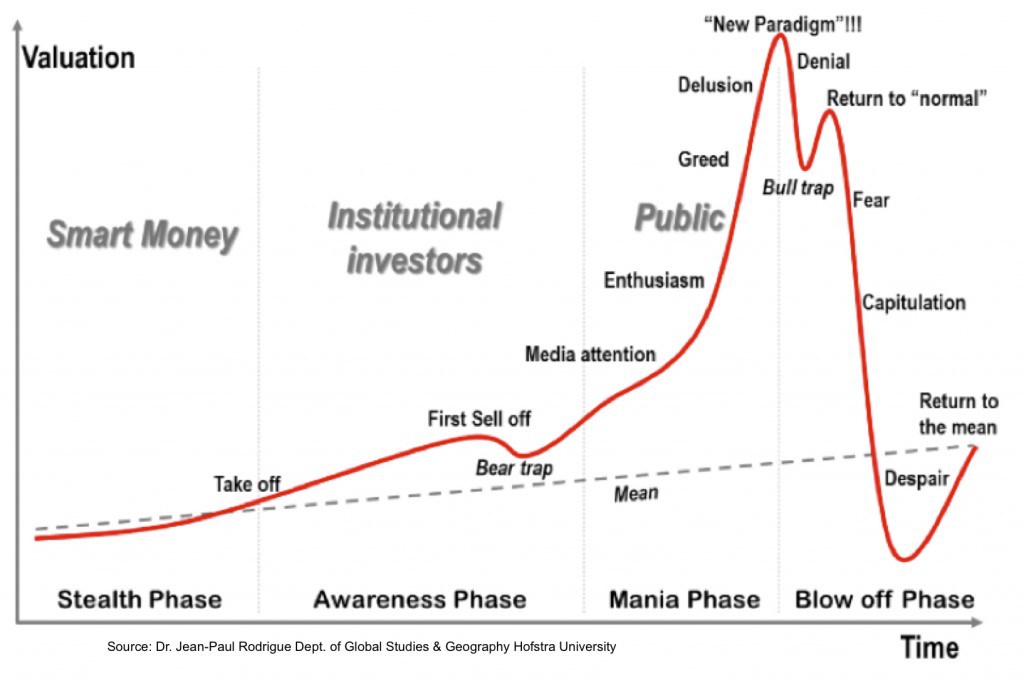
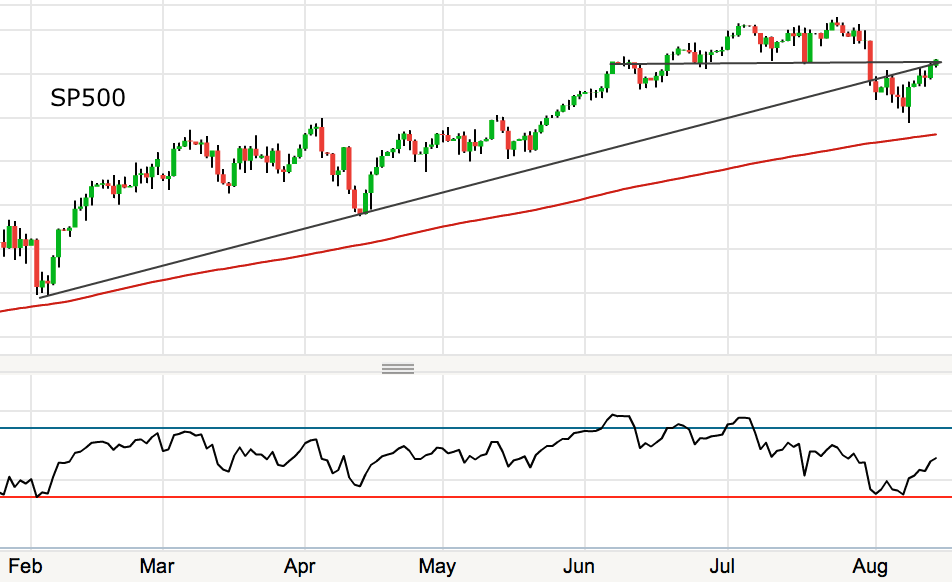
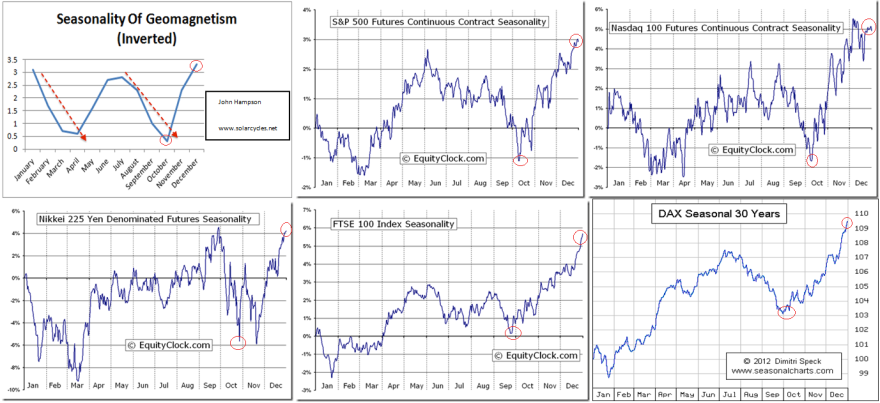 What also unites those historic market crashes is the preceding extremes in valuations, sentiment, leverage, allocations and complacency. The current US stock market set-up is a mirror in all those regards and global stock indices appear to have finally rolled over in July as we entered the most common window for market crashes. So it is fairly clear that we have a crash ‘set-up’ if not a crash.
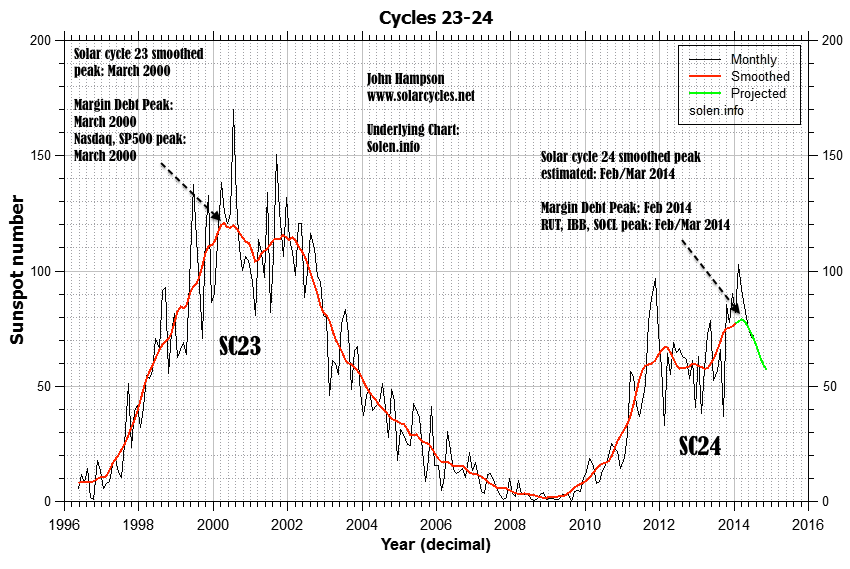
Additionally, those crashes of 1907, 1929, 1990 and 2000/1 took place in the waning of the solar maximum, with the sun first driving the speculative mania to achieve the extremes and then pulling the rug from underneath. Based on the latest solar data, we appear to be a similar position now, i.e. through the smoothed solar maximum.
To realise the biggest crash in history we would need to see the market halve in value in this window between now and November, which would mean the SP500 dropping to 1000 to August 2009 levels, i.e. the majority of the 5 year bull wiped out in a couple of months. That sounds utterly crazy, yes, but at the heart of a market crash is panic selling, whereby the selling reaches sufficient momentum to bring about a critical mass of forced redemptions and rapidly unwinds all the leverage. Sell levels trigger further sell levels and the process becomes unstoppable and out of control until exhausted. Given we are in many measures at the extreme of extremes, that process of exhaustion may cut deeper.
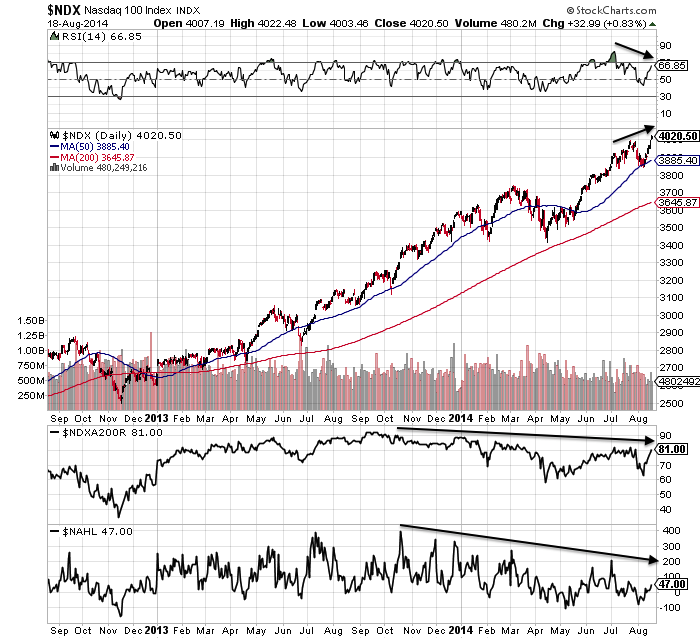
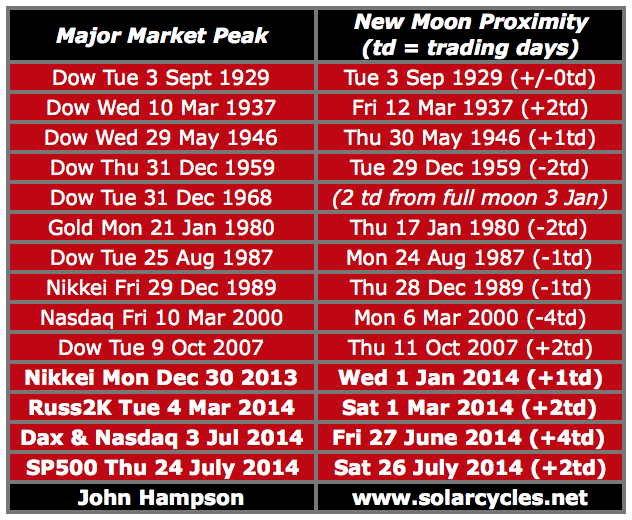
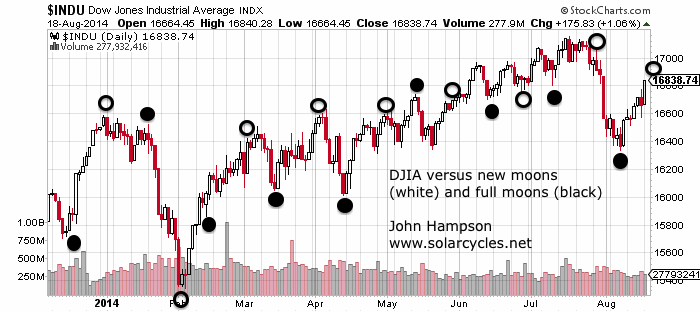
Amongst the historic crashes we see a cluster of big down days occurring on Mondays and Tuesdays (after weekend worrying) and close to new moons and full moons (at sentiment extremes). Also the waterfall selling typically erupted with the breaking of a notable technical support level following the passing through of a second chance peak (a failure high). I have argued that we have passed through the second chance peak as evidenced on RUT, IBB and SOCL and behind-the-scenes indicators for large caps. If I am wrong about that and large caps need to yet rally up again to a lower failure high then it would delay the initiation of the panic-selling. If however I am correct then the panic selling should be close at hand and we might then look to these possible dates for initiation, based on those historic patterns:
Mon 11 Aug, 1 day after full moon
Mon 25 Aug, new moon
To sum up, IF we were to experience the worst market devastation ever, then the set-up that we have would be pretty ideal for it, namely all-time extremes in valuation, sentiment, leverage, complacency, cross-asset valuation and allocations, the waning of the solar maximum, and the period of the year July-November. Initiation for waterfall selling could potentially trigger around one those August dates.
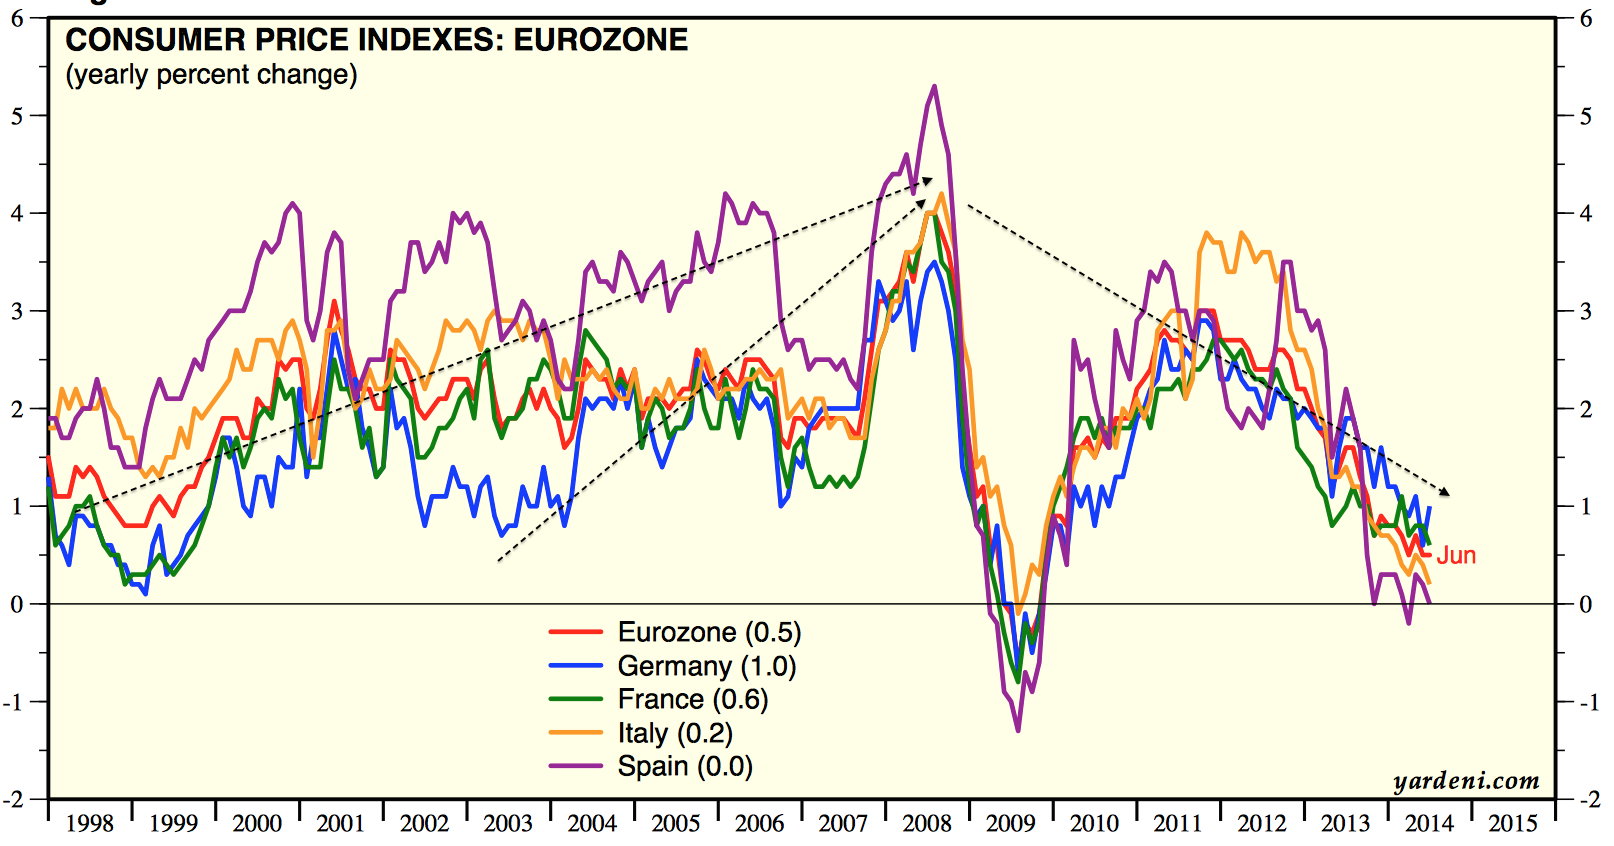
I am not peddling fear, I am just drawing together the common themes of historic crashes and pointing out how we fit in. We fit in well, so we need to consider the range of potential results. I am not predicting the worst crash in history, but I am predicting there will be a period of waterfall selling at some point to wash out the leverage and I see no compelling case for that episode to be mild and anomalous compared to the others. We are flirting with deflation and nominal values are therefore at greater risk. Therefore, considering the possibility of the worst ever crash does not seem inappropriate.
Would central bank reactive measures nip a crash in the bud more easily now? These crashes all happened quickly: between 1 day and 8 weeks. That doesn’t allow them to do much. Would circuit breakers and exchange closures alter things now? They may cap the devastation on any one day, but spread it out to the following days or weeks. Might any crash be restricted to the hot targets of RUT, IBB and SOCL? It could be worst there, but unwinding leverage should affect all assets. Could any crash and unwinding of leverage be postponed until 2015? I can’t rule it out, but it doesn’t fit with the patterns in those historical mirrors. We could look to the end of October 2014 as a marker for that: if hard falls have not erupted by then, the likelihood would transfer to such steep declines not occurring until the Feb-May 2015 window.
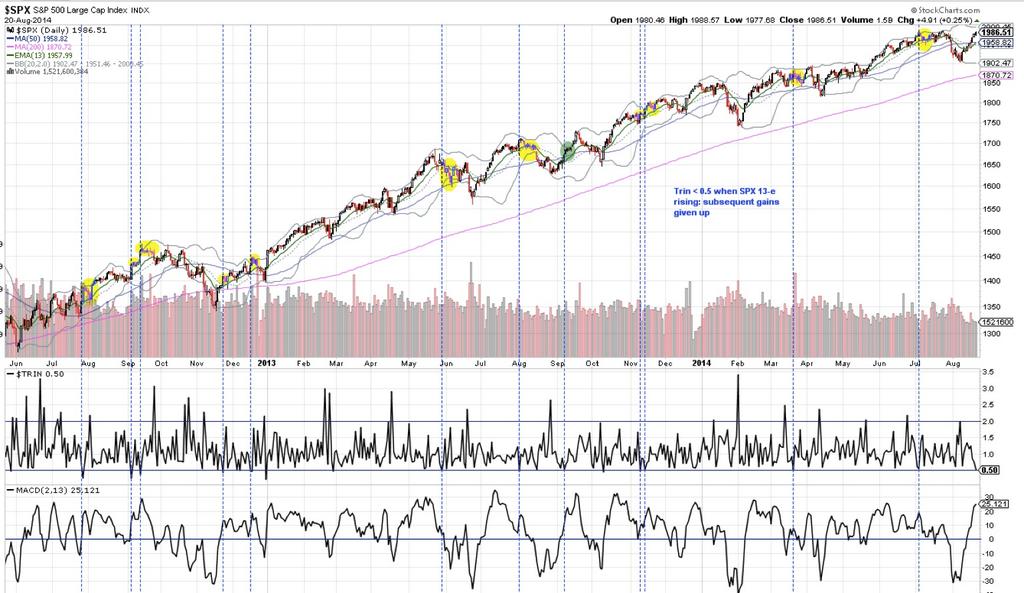
Turning to the near term, yesterday’s bounce was in line with indicators, and sufficiently contained to be no real threat to the bear case so far. I have no expectations for today but want to see the markets turn down again into the coming weekend’s full moon. If I am correct about our positioning post-second-chance then essentially we should see bears resume control quickly. Another two day’s rallying from here, clawing back much of the 31 July falls, would not be in keeping with that.


 Source: Financial Crisis Observatory
 Source: @Market_Time
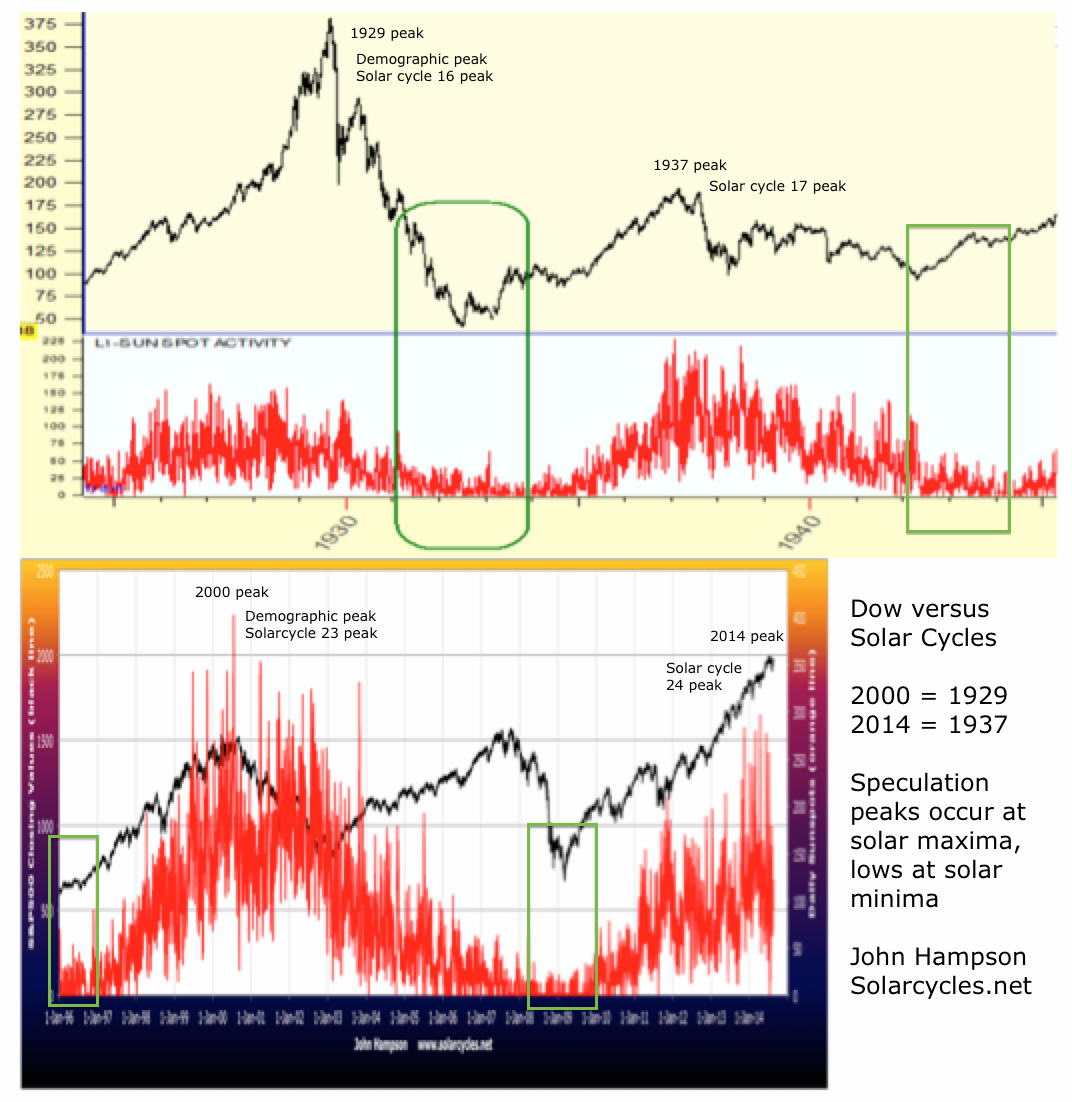


