
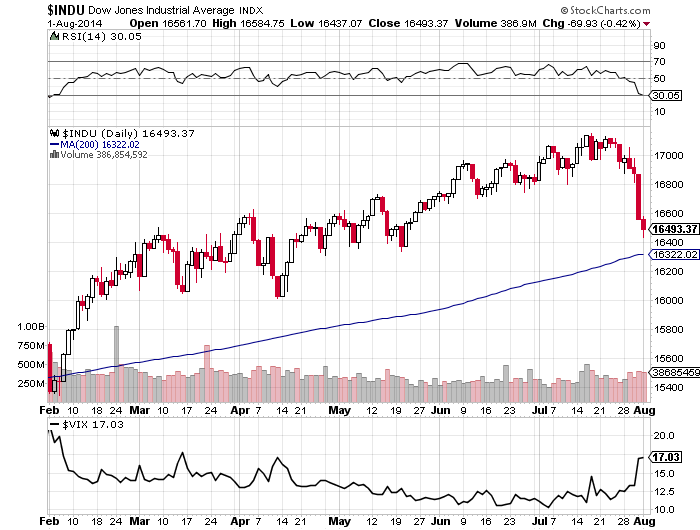
1. Dow within reach of 200MA:
 Source: Stockcharts
2. Nymo and Vix:Vxv both still calling for a bounce:

Source: Stockcharts Source: CobrasMarketView
3. Put call ratios leapt up on Friday, also suggestive of a bounce imminent:
 Source: UKarlewitz
4. Capitulative Breadth (CBI) hit 10. This has been a fairly reliable indicator in the past of a low being in within 3 days. See the table below which shows incidences up until 2012. Also note some drawdown before the bounce was fairly typical.

Source: QuantifiableEdges
5. Thursday was a major distribution day, a typical signal around market peaks. The chart below shows there have been 4 major distribution days (red>9) and no major accumulation days (green>9) so far in 2014:
 Source: Cobra
To sum up, Friday’s action further cemented the change of trend, and does set up the potential I referred to for a big down day on Monday (end of week selling, weekend worrying, Monday panic). However, there are several indicators shown above calling for a bounce or a low. If we look at the orange bars on the put-call chart and the common drawdown on the CBI table, maybe we could see some significant selling on Monday followed by either a recovery later in the day or a recovery Tuesday/Wednesday. If instead the market bounces strongly from the outset on Monday then I would be looking for some kind of retest of the breakdown that eventually fails and a chance to add further short during the course of next week.

I expect a low on Monday, a high on Friday 8 and then a major low on august 12. I’ll give more detail tomorrow.
Andre,
That looks ok. We must not forget alibaba – largest IPO till date is pending. Any major crash may happen only post/around IPO, NOT before that.
That IPO will be in September. And I wasn’t talking about a crash, but on a major low on the 12th. After that I see some recovery. And I see continued weakness in to the first week of October. The 3 month cycle has only just turned down. So deeper lows later on will certainly be possible.
But august 12 is the low of a shorter cycle and after that some recovery. Tomorrow a more extended overview.
Reblogged this on thedarklordblog and commented:
Selling to continue on Monday favoured, based on the Friday close.
Hi John
Great work again. You note above, a strong upside open on Monday then likely retrace to breakout, could we not go down Monday & then do a full retrace to the breakout?
RSI on the Dow daily only just getting into oversold territory. Seems likely that we go for the 200dma, likely overshoot, say 1% ish, before a bounce.
If this is the case, given the indicators you have highlighted, is this not a second chance scenario?
Thanks again for sharing your thinking with us.
Thanks Tim. My analysis says we’re likely through the second chance peak, and if so, no strong retrace should occur. But I can’t rule out the other scenarios that you refer to. Just sticking with my probability.
Thanks John. Just wanted to understand if you were sticking with the 2nd chance peak has passed.
Hi John
Great call in your post about today (Monday).
I guess a minor retrace during the week before further declines.
If this is the case, Dow 17150 seems to be the high and perhaps the EW count of SoulJester comes into play as per his comment below.
Any thoughts on this?
Thanks
https://solarcycles.net/2014/06/14/cross-referencing/#comment-22502
Just to clarify, you do note that we could go down Monday but in that instance I inferred from your note that a strong retrace would not be on the cards.
Reblogged this on inflationproofinvestor and commented:
Fantastic opportunity for next week!!
Inflation, what opportunity? Up or down
I think we go back upto 1948 then down or even new highs
Opportunity to go long on Monday for a swing bounce (for few days only). From around 1910-1900 level S&P, and 9050 level DAX. And liquidate into Wed/Thursday. Planetary alignment on Thursday 08/07 (Mars parallel Saturn) is a very bearish sign and should give the opportunity to re-short.
Monday will be down all day, So technically we could see the low on Tuesday at the open. But in early trading the reversal will be there. And I have my high on Friday but that may be intraday.
A lot of guessing what will happen next week:) I will try my chance too

Here is what I see – classical extended impulse. Count 9 waves from the top you will now when we have short term bottom.
Karni, who is guessing?
Ok, we all have a plan:)
Karni, was just kidding. Watch tomorrow for what I will post; I’ll give you the road map for the whole of August, with all the turns. And you will be able to see that this is planning indeed.
Touche, Andre!
🙂
Great work John! You might want to add this indicator to your arsenal. It enhances the CAPE index by merging Moody’s Baa yield into the calculation. I found the results very interesting.
http://www.mcoscillator.com/learning_center/weekly_chart/a_scary_valuation_indicator/
Thanks
The one fly in the ointment to the bear case, in my opinion, has been the lack of confirmation from credit markets. That appears to be changing, but we still have a ways to go:
http://charts.stocktwits.net/production/original_25255886.jpg?1406827863
http://www.marketwatch.com/story/3-market-warning-signs-predict-20-stock-tumble-2014-08-01?dist=afterbell
Wow, all I’m reading now all over the web is massive declines, correction, sell off ,collapse, waterfalls. so a rally is imminent. That’s the way it goes.
John,
Here’s a great conundrum. The china market still in a bear market and has been falling all the time the rest are rising, and now that the rest are falling china is rising!!
Noted, but as it’s a closed market it’s a different game.
Week 31 Newsletter – https://db.tt/wZlvDkH5
Thanks for the update Dan, it’s appreciated.
You’re welcome Peter
Sunday… forecasting time!
Lets start with a little overview. I developed a new Gann timing technique that has nothing to do with tides. And that is good.
For reference I chose 4 significant and confirmed highs and lows : Sept 2000, March 2003, July 2007 and March 2009. Those dates give possible turns for 2014. Then we look at months that have the most hits, assuming they are the strongest turn months. With only 4 reference points I get 4 months in 2014 with 3! hits. They are March, July, September and November. Next, I look within the month to see if I have clustered days.
For march I get 9,13,16. Remember March 13 was the start for the run up?
For July I get 6,15,22. July 3 was a High as was 22-ish. So all the dates seem to work. For September I get 4,15,17. And for November 21,25,26. Please notice the youngest reference point is over 5 years in the past.
By the way, the next major Bradley date is …….20/21 November. July also gave a major Bradley date.
This tells me :
March was a low, July was a high, September will bring a low and November a high very clustered around 25th. So far this year it works. If you want to join me in this analysis, I found a free master timing tool on http://www.tradingfives.com. You have to register but I can send the tool to John for downloading from this site.
Anyway, I am excited about this tool as it is totally and utterly independent from tides. So if my tides give dates that match with Gann timing, it becomes special. And you just have to be impressed by the fact that 4 reference points between 5 and 14 years old can be so accurate. And it fits my philosophy that combining independent techniques adds quality.
The tides. In August I see 2 significant dates : August 12 for a low, and August 20 for a high.
Aug 4/5 low (in the night, so monday end of the day or Tuesday at the open.
Aug 8 High. I expect end of the day as the next monday the decline will accelerate.
Aug 12 low. This is a bit significant as I expect it to be the low for the first half of August.
Aug 15 high
Aug 18 Low
Aug 20 High. Second significant turn of the month.
Aug 22 minor low
Aug 25 minor high
Aug 26 Low.
Aug 29 High
With the tides I am in a R&A process (review and adjust). Please don’t mock me as I am improving my tools. I know this tidal forecast is the best I have made so far. I’d like to invite you to add yet other techniques that can confirm or refute my analysis. The more techniques we combine the more solid our forecast becomes. As far as I can see I’m confirming John’s analysis.
Have a nice Sunday!
André
Thanks Andre, I agree downward cycle pressure into Aug 11-12th.
P.s.
A friend of mine created a Solunarmodel (he is also into tides). Every 19 years the lunar calender is the same. Those years give – according to this technique – the same trend. His analysis goes back 6*19 years for DOW and S&P,
Anyway, this Solunar analysis of DJ30 gives: a low around 10 (I say 12), then a high on 20 (match) and a low on 26 (match).
Just to show you the number of different techniques is vast, and to inspire you to look for still other tools.
I realize that at any moment there is just one reality. So every technique that has some value should produce the same result. But I really enjoy seeing this confirmation.
Andre’
I appreciate your work, and how it fits in with the more macro approach of John. Both of you have encouraged me to take a solar/lunar/geo approach to timing.
I have been using attempting an approach that looks at sidereal and topical lunar cycles. I am not as far along as your method, and lack the confidence to call them out as H & L (inversion issues), but I did get decent results in July. Interestingly, many of my dates closely align with yours, despite being independently arrived at by a completely different method:
August 5
August 23 (Saturday, so either Friday 22, or Monday 25)
August 30 (Saturday, so either Friday 29, or Tuesday 9/2)
September 4
September 15,16
I also have August 16,17 (Sat/Sunday) &/or August 18,19 (Mon/Tuesday), which is confusing to me and clearly needs to be reviewed and adjusted, or ignored.
Anyway, I do appreciate your effort (and of course John’s) to provide direction and understanding of your approach. Thanks to all.
Steve
Steve,
Inversions are a tough issue. I think I have solved this but it illustrates that tidal analysis is not so easy. And thank God, because if it was so easy there wouldn’t be a market anymore.
Tides are directly impacted by lunar cycles, so no so sure your techniques are fundamentally different from mine. 16/17 august I would ignore, but 20 is a regular high – no inversions, no insertions. But 18/19 the tides start turning and august 18th we have a helio high (Bradley). So I expect some high and lows shortly after each other before the final high is set on the 20th. And I have a low September 2nd (with inversion).
I promised John to produce a graph to show correlation between gravity and market behavior, but I can’t do it. Reason : inversions. Without inversions its easy : when my indicator makes a high the market makes a low. But when I have an inversion the high becomes a low etc. And now my sequence of high/low/high/low is disrupted because I now suddenly have 2 lows in a row. So now I have to insert a high to restore the sequence. This is not a random process and I know how to insert the restoring highs and lows. But is shows it’s rather complicated. And without the inversions I wouldn’t be able to spot the missing turns.
Gravity works and correlates with the market perfectly. But tides are a long way from gravity. Lets see what august does and how well my forecast does. I appreciate your interest in the matter.
Andre’
Thanks, your comments helped clarify a few issues that have muddied my thoughts.
When I think about Inversions I end up going in circles. I wonder if at times we have the wrong underlying intellectual model. Perhaps inversions are not related to Highs or Lows, but to fear and greed. If fear and greed are opposite sides of same coin, then the solar/lunar/gravitational or any other aspect of emotional impacts could produce a high or low depending on where everyone was standing emotionally. So if everyone is bullish, and nervous, then exogenous changes in emotions would produce a high, and the opposite if everyone is bearish. The impact is the same, both are pivots, but in opposite directions. At this point, I have no idea where this takes me, but given how inversions seem to plague every ones analysis, I can’t help but wonder if we need to look at it differently. Of course, Inversions may be their own separate cycle.
Steve,
I don’t think changes in mood can be exogenous; I think mood is a direct result of the impact of gravity (and electricity and geomagnetism) on the lizard brain. I have been struggling with inversions for a long time and it was frustrating. Did an inversion mean gravity didn’t work some of the time?
By now I am convinced inversions are not so much about gravity, but about tides. My forecast comes 100% mechanically from tides. 100%. So the tides reflect the inversions and thus it is a gravitational impact. Basically, the word inversion is wrong. Gravity doesn’t invert. An inversion is really an adjustment in your tidal calculations.
I have said before gravity does not have an on/off switch; it is a natural process that takes many different shapes. Once a month I see all tides showing extremes within just 2 days. But sometimes it takes 5 days. and at the end of august/begin September I have two long turn periods with just 2 days in between. Gravity is not a smooth cyclical phenomenon. And the tides reflect that. So there is no magic; it’s just the know how you need to translate tides – or lunar cycles or whatever – into gravity. Once you have gravity it’s clear : gravity stronger means markets down. Always. No exceptions. Never.
very good analysis in sync with some of my seasonals .for early Aug. watch tsla ,aapl for the bounce .
Andre.. We admire your enthusiasm and tenacity. More power to you. May Fortune bless you.
Also John for hosting this very educational site. All the contributions are appreciated. John, you have also been very tenacious. Appreciated.
With Thursday & Friday brutal down day, i expect follow up with a lower low in mid / late Aug and rally to Sep alibaba ipo.
I am expecting a strong bounce on Monday to Wed / Thu as John’s chart point 3 put call ratios leapt up on last Friday, suggestive of a bounce imminent, from there should be a good rewards ratio to short again.
One thing i would like to bring your attention was it seems DAX have hit its low and ready for a bounce (double high / or lower high) when you compare recent down swing (7/3-8/1) to previous downswing (1/21-3/14)
My roadmap 8/4 bounce 8/7 or 8/8 high, low 8/15 or 8/18 then correction done and rally to Sep.
The low I see in September comes just before the scheduled Alibaba ipo date. Who knows will Alibaba spark the rally.
apple just a word of advice about getting too cute.
There are times when even the best indicators don’t work ie. put/call ratios.
I suugest people check the DAX. It has been in freefall for 2 days and sliced through all support level and indicators. This is indicative of a market acellerating into crash mode.
I am not saying a crash is a given, but I wouldn’t be buying anything here. The DAX has been leading.
p.s. thanks for sharing your forecast. August will be an interesting month. Let’s just see how things develop and what timing comes closest.
Good job. Thanks again for sharing!
I am still somewhat bothered by the top in the SPX however. It was made with a series of 3 leggers. That pattern could have been a crazy dia. triangle, which would mean the top is finally in, but it might also be a “B” or “X” wave which means the SP will challenge the high at least one more time ( with a wave 5) before selling off in earnest. This is a caution flag raised by the pattern that remains a possibility until 1890ish spx comes out.
Basically, from a pattern perspective, it says to keep short trades moderate ( with stops in place) until the 1890 support is violated, OR, unless our next bounce is a 3 legger ( abc) affair.
A real problem is how European and US markets deviate. Europe was down in july, S&P mostly flat until the last 2 days.
My tides are about timing but I can’t forecast pricelevels this way. I see a high on august 20. Could very well be the S&P will approach ATH’s again while Europe will give lower highs (very likely).
I have done my gann analysis twice now; on a European index and on S&P. This gives interesting insights. It could be that with real tops/bottoms, markets must converge and synchronize. In November I see this convergence in Gann timing. This combined with the major Bradley date could very well mean that S&P is now in a W4 and starts W5 up in September to set new record highs in November. But I can’t see European markets do that. One reason could be the impact of the FED on US markets. The ECB has a different policy.
p.s.
I see now that in 2014 only July and November converge in Gann timing. All the months before there were deviations. The timing worked great on both indices separately, but they were different. Untill July world markets were in an uptrend, so Gann timing had little impact. Hence the deviations. But July is a significant month. Could it be Europe set the top of W5 and S&P in W3?
Thanks John for this weekend update: I’m with you, a pullback is likely, after that, a selloff.
Hi André. First, thanks for sharing your work. You say “Every 19 years the lunar calender is the same”. Please, can you explain more about that? why 19 years?
On the other hand, I would be happy if you contact with me. This is my mail jordi_gell@yahoo.es
A lunar month is only 29,5 days. So a lunar year is shorter than a calendar year. I guess it has to do with that. But it is not my tool, I just look at it and have confidence in the person that created it. And you have to admit the confluence is remarkable.
For every year (western calendar) we got 228 months (19 years x 12) while lunar year (moon takes 29.54 days for 1 revolution around earth) (chinese calendar) 1 month got 29.54 days, for 19 years in western calendar equal to 19 x 365.24 /29.54 =235 months in chinese calendar
In other words, the position of the moon 19 years before was the same as 19 years before from the earth viewpoint.
http://www.mythicalireland.com/astronomy/moonmovements/metoniccycle.html
I’ll have to do more research on this but it still comes down to a fundamental eclectic. The alignment of the Metonic cycle would have an impact on the interplanetary electromagnetic field and the angular excitement of the photons (light) absorbed into the molecular structures. Given we are all made of the same stuff, it’s only natural that our cellular / molecular structures would be impacted by the change in the spin of photons that compromise the electromagnetic fields, the sunlight, and the gravity of the solar system which drives sunspot and magnetic field changes in the sun. Metonic cycle is likely just yet another old fashioned way to spot these cyclicals without explaining what output produces the observable effects.
I needed to credit ‘peterslane’ for bringing this concept to the attention of the group.
https://solarcycles.net/2014/06/03/fuel-spent/
And here’s some further comments on the Metonic Cycle.
https://en.wikipedia.org/wiki/Metonic_cycle
Cheers.
Guess there’s more to this 19 years than meets the eyes 😉
Anyways, I will keep including this solunar analysis in my weekly update.
The gann timing analysis is new and I’m in a steep learning curve. The more I think about it the more I’m convinced : Dec 1013 was the 3 of 3 for S&P. 15 jan 2014 was the 5 of 3 for Europe. Then w4 down in europe and 4 of 3 in S&p. This july S&p was in in an extended 5 of three, what can be very flat / low volume/low volatility.
This is what MTU says:
Stocks
This past week’s strong sell-off in stocks offers the possibility of a larger pullback or a larger trend reversal. However, the asynchronous tops among benchmark indexes (which should be more common in consolidations than major reversals) present a challenge to the bearish interpretation at the moment. A drop below the low of a yet to be completed five wave decline confirms, while a failure to confirm suggests a short term buying opportunity.
http://market-timing-update.blogspot.nl/
Mchugh says that there is still one leg up to go. He calls it wave E (in an ED).
This is basically what I conclude from the gann timing. So the crash is indeed not yet here. Europe is definitely in a down trend, but will show a w2 retracement (w2 can retrace deeply!) as S&P is in a w5 (or E) up. No crash before the end of November.
Picture this: with 8 different reference points in europe and S&P; all longer than 5 years in the past this is what Gann timing gives for november : 21,25,26 in europe and 1,27,28 in s&p. The one is an outlier. But the other dates are scaringly close.
We’ll see what happens.
To me, Thursday-Friday was indication of rising fear but not yet capitulation. At the same time, the market breath is really weak and getting weaker. If the market pulls back up, it should happen soon before any more damage to the breath.
SoulJester, are you still reading this blog?
You had a rather scary count I recall if the Dow hit 17151 as a high.
Tried finding your blog but thought it worth asking if you could post a link to it again.
I’d greatly appreciate it.
Thanks
channells and patterns.com
Hi guys,
SoulJester’s blogg is called Red Line Scenario; Channels and Patterns is written by Richard Chappell aka Springheel Jack.
cheers
Thr1965
Seems I need a google a/ct to access red line which I don’t have.
Are you able to post a link to SJs last blog entry?
Thanks
Tim,
Sorry, I can’t access his blog now – apparently, one needs an invitation.
whats his target, I cant find the post
http://www.seeitmarket.com/bradley-timing-model-indicates-july-2014-turning-point-13666/
fantastic
Yes, I also subconsciously had a Dow 17150 target !
I must have read it here.
VIX is back at its 200 week moving average. That has been the VIX sell, buy equity move during the last 5 spikes in vol since 2011– Mar 2012, Dec 2012, June 2013, Oct 2013, and Feb 2014. Many indicators are suggesting a bounce as John has gracefully pointed out…
The DOW trannies says it’s a dead cat
Been a bit hyper active yesterday. This week this will be John’s site again. Next weekend some more on Gann timing. Till then I’ll keep quiet 😦 . Sorry, John.
Ian Thigm contributed on http://www.safehaven.com that a 360 trading day flash cycle low is due mid to late Aug. Typically, bear markets open up especially on Mondays and other days and then sell off. Opposite for bull markets. The market and Pavlovian training. Over five years of a bull markets trains one to take short profits early as they go away quickly. So the previous bull market makes it hard to make big money in the ensuing bear. So, just as over bought was actually a bull confirmation on the way up ( not a sell signal) oversold is actually a comfirmation if we are indeed in a bear market.
Hi Andre,
Interesting posts on moon and tides. You may be interested in this longer term lunar perigee cycle that impacts tides on a 4.425 year cycle.
“Periods of high astronomically generated tides contribute to the occurrence of extreme sea levels. Over interannual time scales, two precessions associated with the orbit of the Moon cause systematic variation of high tides. A global assessment of when these tidal modulations occur allows for the prediction of periods when the enhanced risk of coastal flooding is likely in different parts of the world. This paper uses modeled tides to assess the influence of the 18.61 year lunar nodal cycle and the 8.85 year cycle of lunar perigee (which affects high tidal levels as a quasi 4.4 year cycle) on high tidal levels on a global scale. Tidal constituents from the TPXO7.2 global tidal model are used, with satellite modulation corrections based on equilibrium tide expectations, to predict multidecadal hourly time series of tides on a one-quarter degree global grid. These time series are used to determine the amplitude and phase of tidal modulations using harmonic analysis fitted to 18.61, 9.305, 8.85, and 4.425 year sinusoidal signals. The spatial variations in the range and phase of the tidal modulations are related to the global distribution of the main tidal constituents and tidal characteristics (diurnal or semidiurnal and tidal range). Results indicate that the 18.61 year nodal cycle has the greatest influence in diurnal regions with tidal ranges of >4 m and that the 4.4 year cycle is largest in semidiurnal regions where the tidal range is >6 m. The phase of the interannual tidal modulations is shown to relate to the form of the tide”
Semidurnal regions are the eastern coast of North America and Europe’s Atlantic coast. So the main financial centres are semi-durnal and impacted by the 4.4 year cycle (half of 8.85 year perigee (or apsides) cycle). Twice the 8.85 year cycle is my 17.6 year stock market cycle.
From: http://onlinelibrary.wiley.com/doi/10.1029/2010JC006645/full
Regards,
Kerry
Thanks,
André
nice squeeze
John,
Based on the action today, it sounds like you believe we now have another chance to short later this week. Seems like many day traders are here trying to give advice on a daily/weekly basis that basically is a coin toss anyway. Real money is made through long-term trend changes and your site is the best.
Thanks again.
Thank you again John for your thorough and multi-faceted analysis. It helps me a lot with my strategy, especially the short term Your call for the bounce is also well proved today.
There are so many so called “stock gurus” out there, currently either calling a Dow imminent crash or a strong bounce back to set up higher highers. Most of them rely heavily on “technical indicators” but completely ignore the human sentiment factor.
Love your analysis with solar and lunar cycles as a strong base. And your consistency in presenting your case from multiple angles. It looks like your great effort will be soon paid off. And us as followers will also benefit handsomely from staying short.
Hi All
Found SoulJesters comment on link below (I hope) where one scenario of several, includes a Dow 17150 target.
Guess you might need to scroll down comments to find it. Interesting longer term view on what might be happening
https://solarcycles.net/2014/06/14/cross-referencing/#comment-22502
Thanks guys