Weekend Roundup

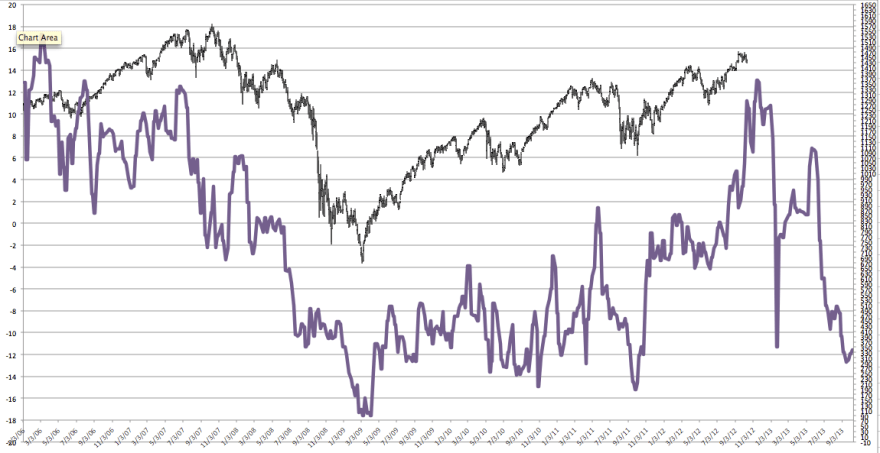
Mixed fortunes within asset classes heading into the weekend, but a summary chart below showing MSCI world equities and the CCI equally weighted commodities index reveals a general pullback began at the turn of February, which could mean the January swing top predicted by the 5 models in alignment could still be validated.
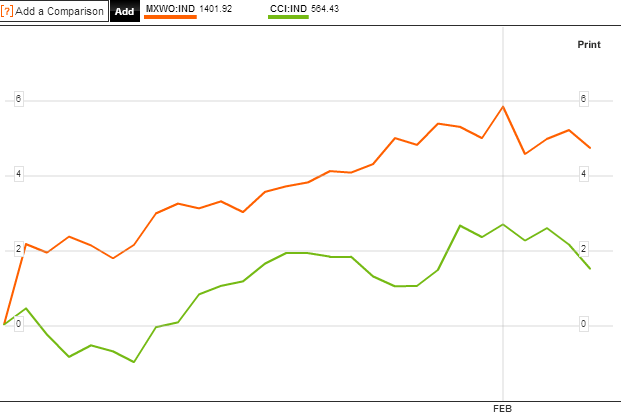
9feb20134Source: Bloomberg

Treasury yields also peaked at the same time, the turn of February, adding to the case.

If we look solely at US stock indices, however, it would appear that they just broke upwards out of a range on Friday, which is normally technically bullish. However, the Dax made a similar range breakout in late January only to then reversed it, and there are some clues that the same could occur here, such as the Vix divergence below:

9feb20135Source: Cobra / Stockcharts

US earnings, so far coming in at a 64% beat rate coupled with a 63% revenue beat rate, have been providing a tailwind. However, economic surprises have been weakening, and also suggest a pullback should occur:

9feb20136Note how surprises have turned negative, and that the last two times that occurred, equities made a swing top.

We also see some frothiness extremes in certain sentiment readings for US equities and also in equity fund flows. In short, I see more reasons for US equities to turn down here and pullback, rather than fulfill their breakout, and so join other pro-risk in consolidation or correction. I maintain that any pullback will be followed by a return to the highs and likely a higher high, which will mark a cyclical top if accompanied by negative divergences in breadth, leading indicators and so on, likely by mid-year 2013.

In terms of leading indicators, the global picture is still fairly healthy. Here is the latest combined global PMI (manufacturing and services) reading:

9feb20137
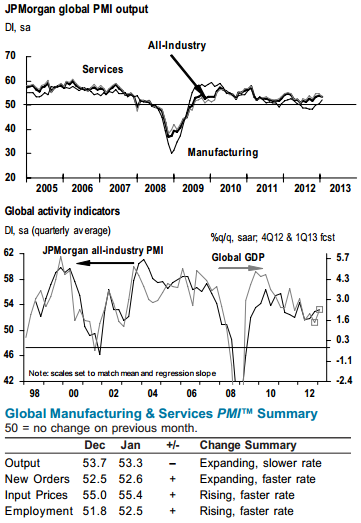
Source: Markit / JP Morgan

To add to that, ECRI’s leading indicators for the US also show strength:

9feb20138Source: Dshort / ECRI

Copper, which is generally a bellweather for the global economy, may have broken out:

9feb20131Source: Kitco

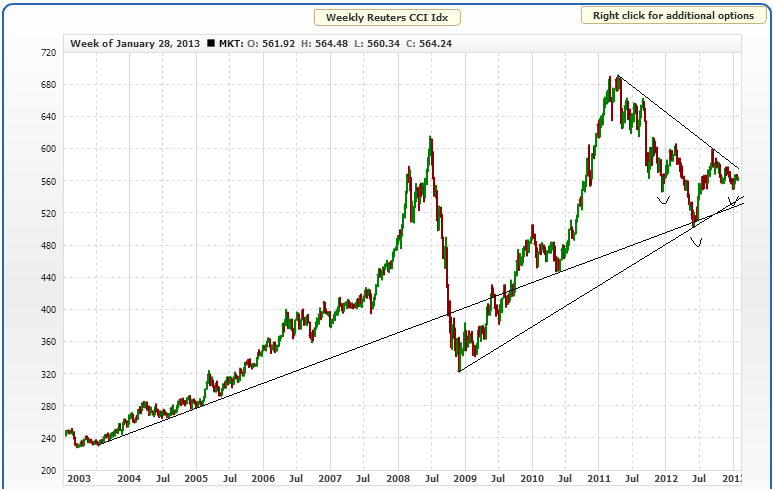
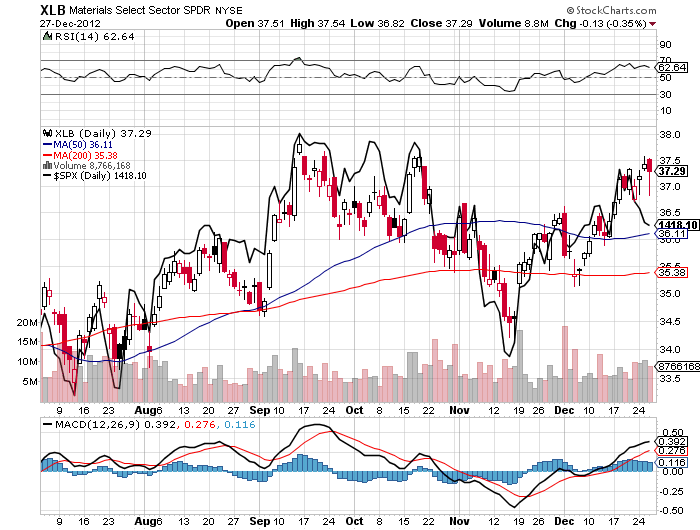
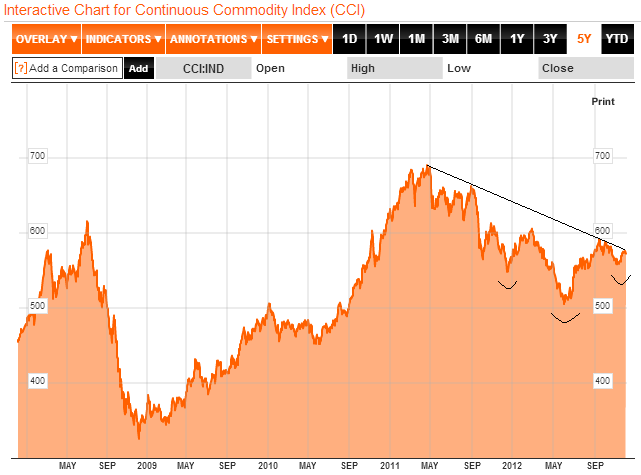
Which brings me to a chart provided by Rob Bowden showing many commodities may be poised for such upward thrust out of large triangles, with equities largely having broken out.
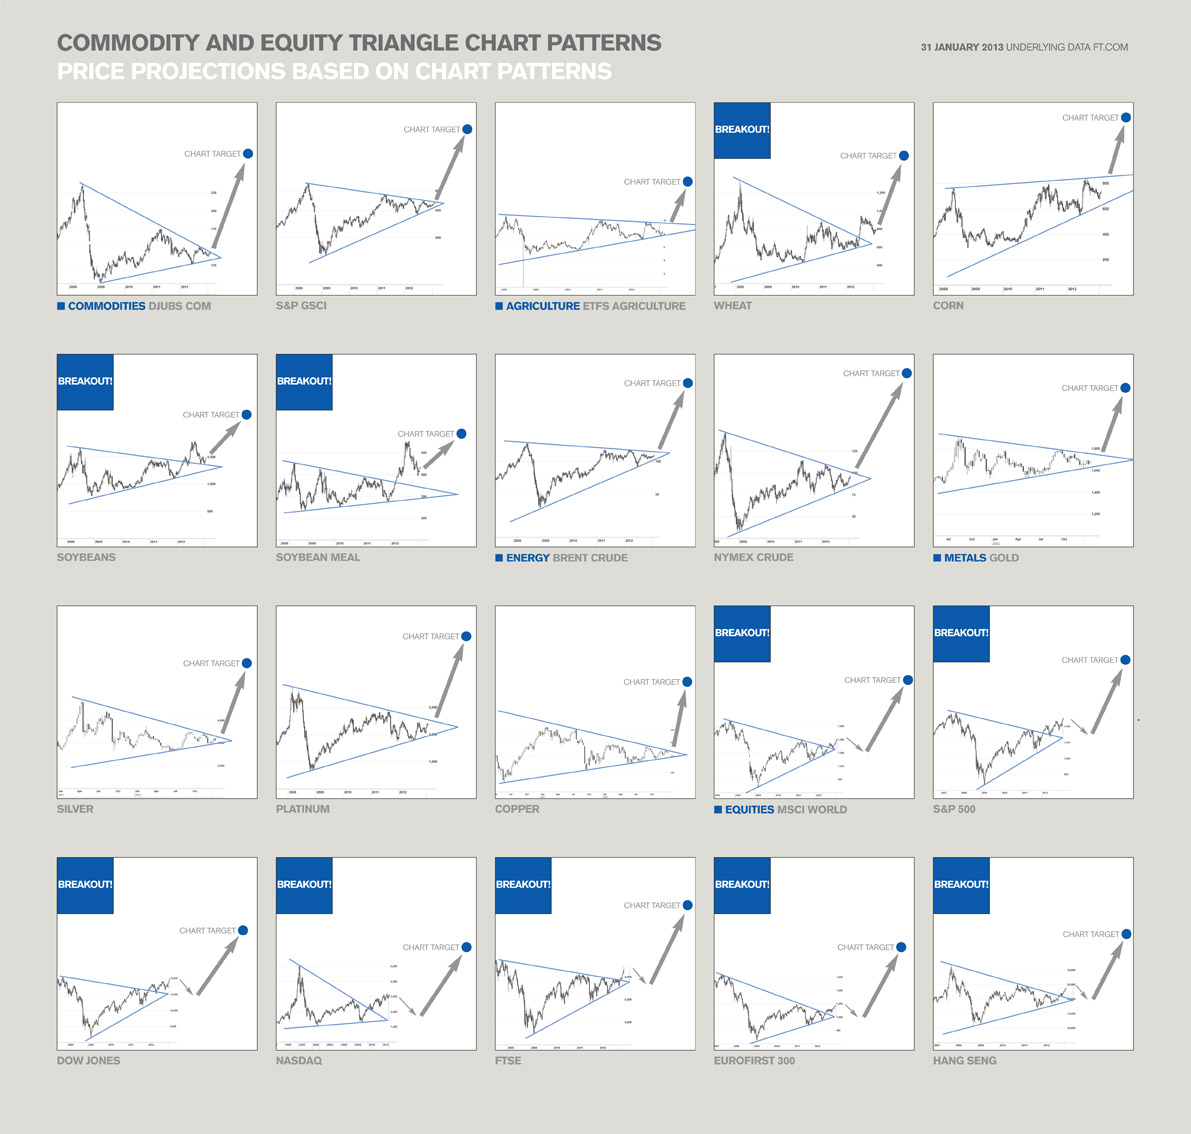
9feb20133

Source: Rob Bowden

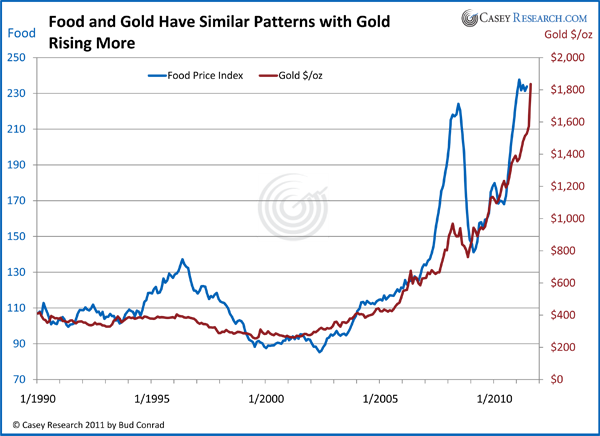
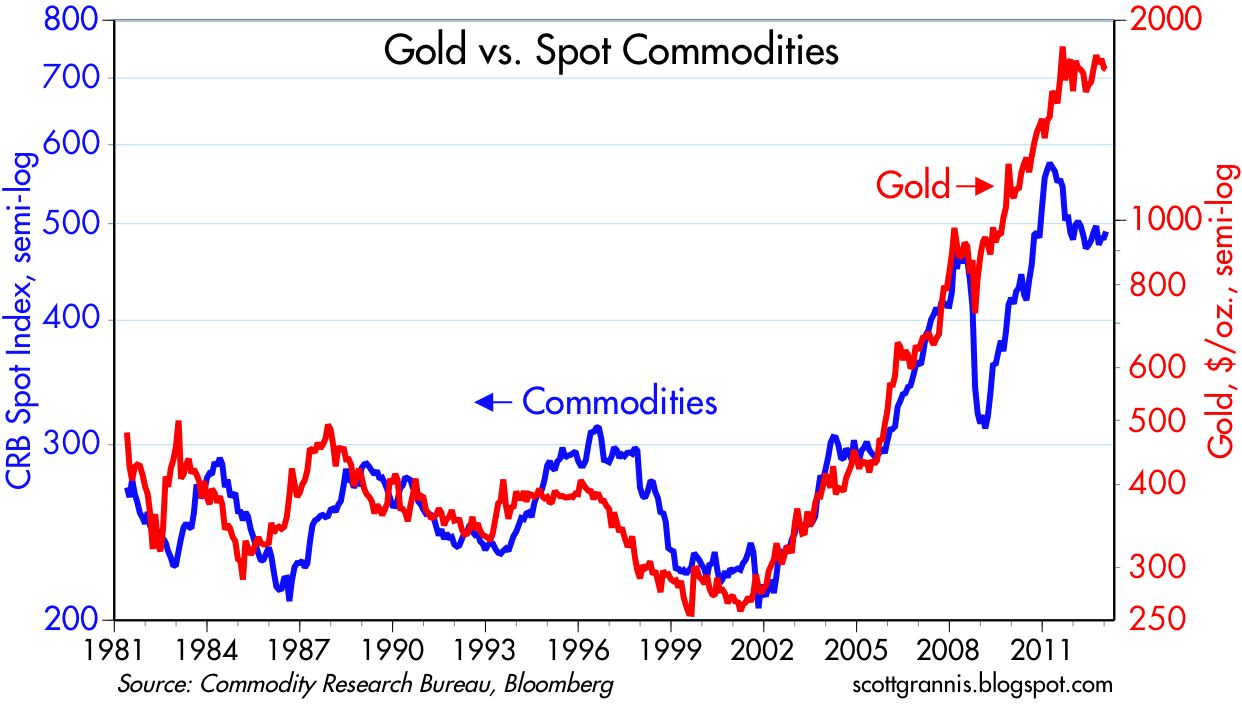
There are no guarantees commodities can break out here but the scenarios shown would largely reflect my own views – equities pull back to the nose in a final shallow cyclical bear, and commodities make a secular finale acceleration up and out.

The caveat would be if my primary scenario is incorrect (secular commodities peak and solar peak ahead), and the alternative scenario is correct (secular commodities peak and solar peak passed). NASA’s updated forecast this month continues to point to a solar peak circa September 2013, and I maintain that the probability lies with the primary scenario for now. One or the other is likely to be validated soon by action in gold, which remains tantalisingly undecided, shown here:

9feb20132

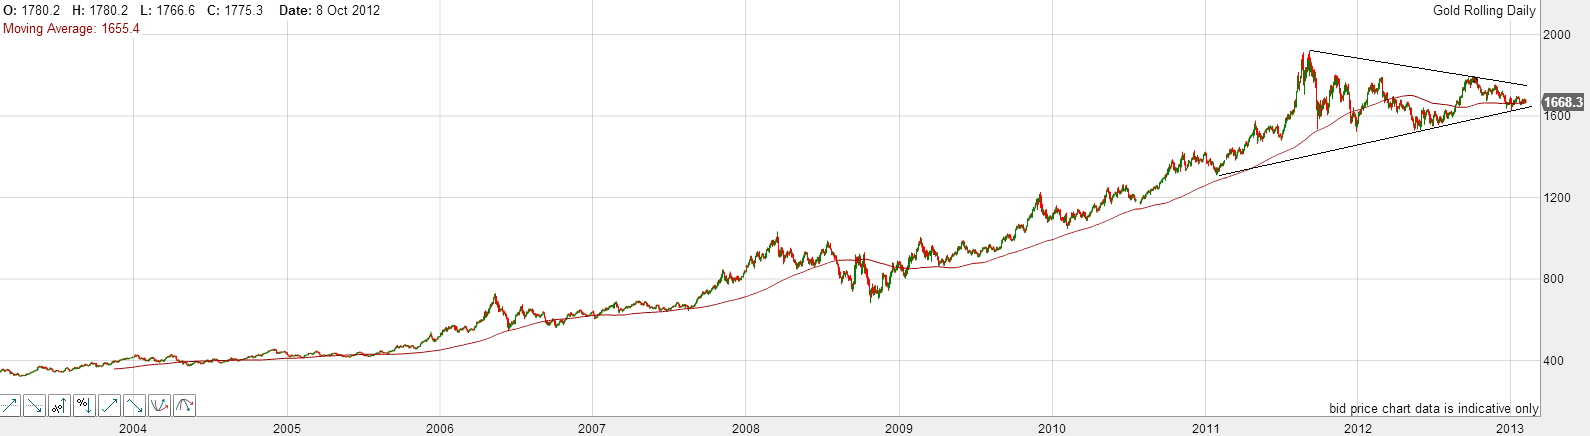
Into the nose of the triangle, it remains above the 200MA, which has largely supported the secular bull, but it remains perilously close to dropping out of the triangle and beneath that key MA. Sentiment is fairly depressed for both gold and gold miners which should be fuel for an up-move. But I do wonder whether we might see a lunge to the downside to flush out weak hands before an upwards break. We’ll see.

Lastly, here is a summary of global house prices. It’s a busy graphic but the overall theme is that in late 2011 and early 2012 we saw what appears to be a turning point for global real estate, with a pick up since then in markets such as Hong Kong, US, Switzerland, South Africa, New Zealand and Canada. Various European countries remain in downtrends but may turn out to be the laggards in a change in trend.

9feb20139
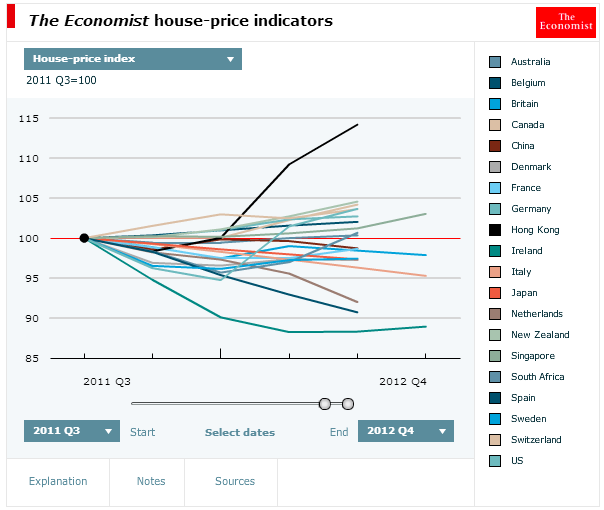
This would fit with an overall transition from K-winter to K-spring. A bottoming out in real estate and a new secular equities bull emerging in due course. One last push in commodities, before money begins a secular move out of treasury bonds and commodities and into equities and real estate.

The Alternative Scenario

What if commodities already made their secular peak in 2011, as potentially shown by the equally weighted commodities index?

30jan20136Source: MRCI

If they did, then what should lay ahead (by solar/secular history) is an ‘echo’ bounce, whereby commodities rise again but fail to make a higher high. Barry Bannister modelled it so:

31jan20131Source: Barry Bannister

If this is a K-winter and the leading commodity class is precious metals, then silver fulfilled its remit to deliver a secular parabolic finale with a subsequent collapse down the other side in 2011:

31jan20132Source: Trading Charts

By solar cycles, this could be an acceptable scenario if sunspots already peaked, as per the ‘SM predictions’ alternative shown by SIDC below:

31jan20137

Source: SIDC

It would mean a solar peak occurred at the turn of 2011 into 2012, and that would make a 2011 secular commodities peak within a historically normal close time range.

The Dow-gold ratio has not hit the extreme of the last secular commodities peak (circa 1980), but could be considered to have reached low enough for a secular conclusion: out of the green band below. The low to date was reached in 2011, which fits the scenario I am outlining.

31jan20134Source: Sharelynx

If commodities already made their secular peak back in 2011, then we should be in a new secular stocks bull. So what if the final cyclical bear (with the secular bear) and secular p/e low valuations already occurred and is not ahead?

A couple of charts from October last year showing how that could be so. What if the secular bear pentagon for the Dax needs redrawing as per the red line – that the market broke out in 2011 then retested the nose level of the pentagon later that year (in a final cyclical bear at that time), reaching a final single digit p/e valuation of 9?

31jan20135

Ditto for the Hang Seng here, ending with a p/e of 8:

31jan20136Clearly p/es of 8 and 9 fit the remit for a secular bear single digit p/e cheapness conclusion. But what about the SP500? It only reached a p/e of 13 at that point. Well, at the end of the last secular stocks bear (circa 1980), although multiple country stock indices reached single digit p/es, not all did. The Nikkei bottomed at a p/e of 20.

Furthermore, if we widen to consider CAPE valuations, Greece hit the lowest ever seen of around 2 last year, i.e. a secular cheapness extreme never before reached (Thailand held the record with 3 during the Asian financial crisis). If we consider price to book valuations, Japan reached below 1 and Russia also. So again, if we are looking for evidence that the secular bear washed out equities sufficiently, then we can make a case.

If  the sharp falls in equities in 2011 represented the last cyclical bear of the secular stocks bear, then there should be some telltale pointers. For it to be a cyclical bear, it should take at least 20% off prices. For multiple indices this was so, with both the Dax and the Hang Seng dropping 30%. That cyclical bear should precede a recession, and such a recession occurred in Europe and Japan, amongst others, in 2012 (in a ‘double dip’). That cyclical stocks bear should have begun from a situation of excessive rising rates and inflation. We saw both sharply rising European yields in 2011 and a rise in inflation because of commodity prices.

If this alternative scenario is correct, then the implications would be significant. It would mean that the point at which to load up on equities already occurred in late 2011, and that what we are seeing currently is new secular bull momentum. It would mean that commodities, as a whole, should now make a lower high in a last chance to sell out of them before they are mired in a secular bear. It would imply that the current pick up in global growth is the real deal, and that growth will now sustain going forward, with central banks unwinding their support.

So what are the problems with this alternative scenario?

1. The consensus between Nasa, Sibet and SIDC (CM) is for a solar peak ahead later in 2013, so I rate a peak in the past as lower probability.

2. Although silver achieved the parabolic and the collapse in 2011, gold appears to have coiled near the highs in a more measured fashion which does not look like a secular top.

3. In the post-gold-standard world, a lower secular finale dow-gold ratio than 7 might be expected.

4. There has perhaps not been wide enough falls into secular cheap CAPE and p/e valuations, not enough country indices outside of Europe. Ditto the Q-ratio valuation for the US market.

5. Although we did see rates and inflation up in 2011, bond yields outside of Europe were conversely ultra low, and inflation did not exceed the 2008 peak.

There are a couple of ways we can judge the validity of this alternative scenario going forward. If sunspots suddenly make a sustained rally to a new high then we are likely still rising to a peak. Conversely, if stocks continue to outperform commodities and we don’t see a reversal in leadership then we are more likely in a new secular stocks bull, which would be confirmed if commodities top out at a lower high.

Kent raised a version of this scenario 12 months ago, and Barry Bannister clearly has also considered it. It is frustrating that 12 months later both this scenario and my primary scenario (solar peak and secular commodities peak ahead) are both still in play, with no clear winner, but therefore important to stay cautious. For my positioning – which is long equities but significantly longer commodities – it makes me a little nervous about the latter. If the primary scenario turns out correct then that ample commodities exposure should produce bumper profits, but if the alternative scenario is correct, the key is to identify the top of the ‘echo bounce’ or lower high in commodities, and not get stuck with tumbling positions that are unlikely to recover for a long time.

Would be interested in your input on this. If you have additional evidence for one scenario or the other, I’m all ears.

Secular Commodities Finale

The rally in equities persists. The momentum continues but the warning flags are increasing, in a fine balance. When we eventually pull back, I maintain this should then be followed by a further higher high, but with divergences and weaker internals, to make a topping process. UBS have echoed this in their chart here:

30jan20131Source: UBS

I have predicted a scenario ahead this year similar to 2007-8, marked by the box below. When stocks made a topping process in late 2007, similar to the distribution patterns shown above, commodities only made their parabolic acceleration once the equities topping process was underway.

30jan20132Both energy and basic materials are late stage cyclicals, which mean they are typically amongst the last sectors to rise and top out, and are reflective of commodities gaining momentum usually later than equities.

I am suggesting that there is a possibility therefore that we need first to see equities entering their multi-month topping pattern before commodities truly accelerate. Once stocks pull back, after this current rise, I believe that process will have begun. The question is how far and how long equities can rise in the mean time, and it’s a difficult one to call. If the pullback were to begin today I could point to a handful of indicators supporting that. Yet, as noted in the last post, both overbought and overbullish readings can persist for a little while before a pullback. So I watch and wait.

But back to commodities. Oil is the outstanding performer of the moment, most other commodities are lacking momentum. I previously studied commodities peaks and solar peaks in detail (here), which revealed that commodities should typically begin an acceleration around 12 months before the solar peak, which is currently forecast for around September of this year, but that commodities typically make their parabolic peak after the solar peak. Drawing that analysis together with the above, I would suggest that commodities, as a class, are overdue a momentum move, but could need equities to lose momentum and begin their topping pattern before commodities take over.

There is historically a close correlation between commodities. Below are shown food and oil. If oil can maintain its recent strength, food should follow (oil is a key input in the agri process).

30jan20134

Source: MD Briefing

Food and gold prices also have a close historic relationship, as shown in this previously posted chart:

22mar6

Source: Casey Research

Yet there has been a disconnect in the last 18 months between gold and general commodities, shown here:

30jan20133Source: Scott Grannis

This helps to explain why gold in particular is struggling to advance, as other commodities need to catch up (or gold pull back). So let’s see if oil is taking a role as the leader here, and that foodstuffs will join in the rally, and then precious metals.

Gold miners made what looked like a high volume capitulation at the end of last week, which together with very negative sentiment puts them in a good position to reverse trend here. But a reversal in gold itself is of more importance, and aside relations with other commodities, we can also look to the US Dollar and central bank balance sheets as a driver. Here is Euro-USD and Fed balance sheet modelled together versus gold:

30jan20135Source: Nordea / Bloomberg

In 2013 the Fed balance sheet is forecasted to expand significantly, based on its QE plan, and currently the Euro is technically bullish versus the dollar. So here is a potential catalyst for gold.

Real interest rates are also important for gold. With treasury yields rising currently but inflation fairly tame, the real interest rate trend is going the wrong way (even though real interest rates remain negative). However, a rising oil price has the potential to push on inflation and turn that trend back. Rising agricultural commodity prices would also push on inflation, and this brings us back to the feedback looping between commodities. Essentially, we need oil to maintain momentum, or, say, agri commodities to join in the momentum, for the whole complex to begin the feedback looping which should result in a parabolic finale.

A reminder of other factors. The solar maximum later this year should inspire more speculation into commodities, but also protest and war. Rising food prices typically play into the latter. The NOAA climate chart that I displayed last week showed a trend that, if still in tact, could produce a record hot year this year. If so, that would be a big push on agri commodities. And by history, the secular commodities bull should end in a parabolic mania of some degree. Below is the equally weighted commodities index – did we see that mania into the start of 2011, or is it still ahead?

30jan20136Source: MCRI

I have marked on the chart an inverse head and shoulders pattern, formed throughout 2012, that could potentially catapult commodities upwards and out of the triangle to give much greater weight to the ‘peak ahead’ camp. Alternatively, a break beneath the secular support line would make the ‘peak was 2011’  view the convincing one.

I believe the conditions are still right for the secular commodities finale to occur in 2013, potentially making a final top by as late as H1 2014. Economic data, leading indicators and US dollar fortunes all need monitoring in order to nurse those conditions forward, but it really comes down to whether commodities can now gain momentum  in that relatively supportive environment and then build to a speculative climax. I am itching for that collective momentum, but as outlined above, we may need to be patient a little longer whilst equities ease out of their momentum and into a topping process, handing the batton over to commodities and the late cyclicals.

Update

There is downward pressure into this coming weekend’s full moon, and we see what look like topping formations on the Dax and Nikkei. However the US indices (bar the Nasdaq) have broken out on good internals, and the environment for stocks continues to be supportive, so I don’t believe we see a cyclical top here, but still believe this could be the start of such a process that lasts the whole of H1 2013. Treasury yields have pulled back a little and their trend is unclear. Commodities as a whole remain on the cusp of a breakout but equally this would be a suitable point to pull back.

More leading indicator updates came in from CB and the current picture is this:

23jan20131

Source: Conference Board

In short, weak global growth ahead, nothing too impressive, but no threat to pro-risk currently. To add to that, in the wider environment we do not yet see frothy inflation, overheating commodity prices or particular tightening of yields. They would all usually mark cyclical tops.

Economic surprises for the US have tumbled however and have just slipped negative. When a trend reversal occurred in this indicator in the past, the market made a swing top either imminently or within a few months.

23jan20132Source: Ed Yardeni

Sentiment has also moved up into the top quarter on both II and AAII surveys. Historically this has often been both a sign of strength but of a top ahead, i.e. not a major top right away but perhaps a pullback then a push up again, before topping. That would fit the June final top I have referred to, if so. Here is the bullish percent over call/put sentiment measure:

23jan20133Source: Stockcharts

Note how this measure oscillated in the high zone before previous notable tops in this cyclical bull market, suggesting we might be at the start of that process rather than at the end – particularly as I am expecting a cyclical bull top rather than a swing high.

Sentiment on many commodities has much further to run currently, so it is set up for commodities to outperform stocks for a period. But this remains theory until it occurs. A critical test will be how commodities perform if stocks do now pull back for a time. Supporting such a pullback in equities, a Demark buy exhaustion count has been reached this week. Plus there should be typical weakness around the full moon. However the geomagnetism forecast remains tame for the next 3 weeks, which could provide more positive pressure for pro-risk once we are through the full moon period. You can see this and all other updated models on my regular pages.

Equities Cyclical Top?

There has been some consolidation in pro-risk over the last few sessions, which is normal into today’s full moon. The correction overall has been minor, and the next two week period into the new moon is one of low-forecast geomagnetism. I believe therefore that subject to some last minute resolution or postponement of the fiscal cliff issue, pro-risk can now rally again. But how near are we to a cyclical bull market top in equities? In the last few weeks we have seen technical breakouts in the FTSE, Dax and Nikkei, to add to the recent Hang Seng breakout. Plus we have seen a compelling bottoming formation in the Shanghai Composite. None of that looks like a top. If there is a cyclical bull topping process occurring anywhere then the most likely would be the US markets, as they have pulled back from their highs and remain someway beneath, with tech (usually a leader) underperforming. It is possible that US markets could top first, leading the rest, so let’s take a look under the hood of the US markets.

NAAIM sentiment is into the bullish extreme. That’s a caution, but note how we saw a congregation of such extremes in 2007 prior to the peak, i.e. we could be at the start of such a process rather than the sell point.

28dec7Source: Sentimentrader

Investors Intelligence sentiment remains neutral – bullish, not into the extreme bullish zone. Bullish percent over call/put ratio remains very neutral:

28dec2Source: Stockcharts

There is as yet no negative divergence in breadth as measured by advance-declines, shown below compared to 2007:

28dec8

Source: Cobra / Stockcharts

Cyclical sectors continue to perform well overall, with the exception of technology. Below are four cyclical sectors versus the SP500. Note that in 2007, around half a year before the final peak, cyclical sectors started to underperform the index and defensives outperform. This is not what we see, bar tech.

28dec9 28dec10 28dec11 28dec12

Source: Stockcharts

Economic surprises for the US remain in an uptrend, and ECRI leading indicators are positive and have been ticking up again the last 2 weeks. Global leading indicators remain mixed. Two PMI readings for Japan and Russia disappointed this week, with Russia falling to 5o (the dividing line between growth and contraction) and Japan languishing further negative.

Now take a look at this. Eurodollar COT 1 year in advance as a predictor of US equities, which I’ve referenced before. Whilst it has not been a perfect predictor, it is fairly compelling and points to a clear sharp downturn for equities as of the turn of the year.

28dec13

Source: Tradetrekker

And to that I will add Norwegian Jan’s chart of the Kitchin cycle, which also shows a significant fall is due.

28dec14

Source: Jan Benestad

Eurodollar COT and Kitchin cycles are not part of my usual toolkit, so I am unsure how much weighting to give. But it’s a signal for caution at the least. So what might I do? Well, if I draw in other historic signals of a stock market top and forthcoming recession, there’s a less compelling case for a top here. Treasury yields are rising but not significantly yet, inflation is not yet accelerating, leading indicators are mixed but showing weak growth ahead rather than rolling over, and we don’t yet see generally in equities the topping process of a rangebound market with reversals of reversals of reversals lasting several months whilst internals decay. If that process has begun, then I would argue that we don’t yet see anywhere where that process is mature.

On the other hand, the Nikkei has rocketed to overbought levels, whilst the yen is at bearish sentiment extremes, plus the Aussie dollar is at the bullish extreme. Potentially a reversal in these assets could be ahead which could imply a wider move anti-risk, pro-safety. But as yet we do not see such significant sentiment extremes across wider pro-risk or safety that would make this more compelling.

I continue to watch treasuries, which may have topped out, and if so outflows should find a home pro-risk. Flows into equities remain negative, as opposed to frothy, as shown by the chart below which measures flows into US equity funds. It captures the secular bull / bear cycle well.

28dec6

Source: Pragcap

Tom DeMark predicts a 50% increase in Chinese shares over the next 9 months. Solar/secular history predicts a blow off top in commodities ahead in 2013/2014 with acceleration beginning now, and this is echoed by Gann. Leading indicators of leading indicators predict improvement in Q1 2013, the lag of central bank actions this year. If equities made a cyclical bull market top here and now, I’d find it hard to square all that. I would rather expect growthflation (particularly with growth in China) brings about a surge into pro-risk and out of treasuries, with equities making an overthrow top first before commodities make their parabolic secular finale.

Back to the near term, I continue to expect some kind of satisfaction to the fiscal cliff, even if just postponement, will bring about a rally. But there are no guarantees. A failure could sink equities, as we saw in the steep cliff-nerve related put of hours falls of last week. The meeting is set for Sunday, which means one of the two scenarios on Monday.

I’m now in Central Thailand for a week near Phitsanulok. I shall mull all this over and assess whether I want to act today in any way. Any input or thoughts from you guys of course welcome.

Current State Of Play

Hi all, in a cafe with Wifi, due to storm-damaged internet access at our second hotel (neat Ubud, Bali), so will get down to it.

My trading boils down to this. I am long commodities, attempting to time the secular bull market top. I am long stocks, attempting to gauge the cyclical bull market top. And I am to a smaller extent short treasuries, believing us to have made a secular bull market top in treasuries this mid-year. Currently I believe all these still look good.

Treasuries are still ‘potentially’ making a W-bottom. By Gann they should have bottomed mid-year, and ditto by solar/secular history, which predicts yields should now rise into a stocks cyclical bull top. Still very tentative, more time is required to judge this one.

14dec20122Source: Stockcharts

Regarding the cyclical bull market in stocks (within a secular bear market), there are several ways to assess its likelihood of continuation:

1. A topping process lasting months with reversals of reversals of reversals – as the Hang Seng, Dax and now the FTSE have broken out of their long term triangles I don’t think this is happening yet, though US stocks show the most potential.

2. Overbought and overbullish extremes – we see largely neutral sentiment readings and only short term overbought readings (which I believe has produced the pullback of the last two days).

3. Breadth divergence – NYSE breadth has just made an all-time high, which is bullish.

4. New lows confluence prior to top – we haven’t seen this leading into the US Q3 highs.

5. Defensives outperforming cyclicals – again not seen, cyclicals have been strong.

6. Major distribution days near the highs – we did see these near the US Q3 highs, but since we have seen major accumulation days, which are bullish.

7. Rising inflation, tightening yields, yield curve flat or negative – we don’t yet see these macro developments

8. Rolling over of leading indicators and recession model alerts – we see evidence for growth into Q1 2013 – more below.

The latest CB global leading indicators revealed positive strong for Spain and Korea, but slightly weak for UK and Japan. The latest OECD leading indicators show weak growth but overall above long term trend for the OECD nations:

14dec20123

Source: OECD

Note the horizontal lines are the long term growth trendlines, rather than expansion/contraction divide. Drawing out the narrow money supply leading indicator, the forecast is for global industrial output to increase into Jan/Feb 2013:

14dec20124Source: Moneymovesmarkets

HSBC’s flash PMI for China today came in at 50.9 for December, a 14-month high, adding weight to an upturn in China, and Chinese stocks continue to attempt to make a bottom, with a further 3% jump today at the time of writing.

Economic Surprises have recently weakened for both the US and Asia, but both remain positive. One to watch, as a trend change in this indicator has previously led a trend change in equities.

14dec20125

Commodities have been weaker than equities this last couple of weeks, but I believe they will catch up, with support from an improving China, an improving Euro-USD, depressed sentiment in certain commodities and gold miners. We just passed through the new moon, but with very tame geomagnetism there is support for commodities to rise into year end, as shown by the new model uptrend here:

14dec20128

Finally, a look back at history reveals that the closest mirror for US equities from history is 1967, with a 90% correlation. I find this interesting, because 1968 was the secular equities top and the solar peak – around November/December 1968. In other words, equities are behaving very similarly, as we head into next year’s solar peak, which I anticipate to be a cyclical stocks peak and then secular commodities peak.

14dec20127Source: MCRI

In short, I see no current reason to change my outlook that the secular commodities bull and cyclical stocks bull will continue into the start of 2013. I continue to watch all the measures and indicators outlined above, and believe my first move will be to close of out of the bulk of equities longs, but as yet we do not see typical topping indicators nor compelling divergence in leading indicators.

Currently we are planning to spend a further week and a half in Bali. The rest of our trip is looking like this (subject to change of course, as we are booking and ‘feeling it’ as we go): Thailand, Philippines, Hong Kong, New Zealand, Fiji, Australia, Sri Lanka and maybe Maldives. There are other countries and continents we would dearly like to visit, but we have to draw the line somewhere as time is limited.

Have a great weekend all.

Final Month Of 2012

Certain key assets are finely poised as we enter December. The UK FTSE is once again attempting upside breakout from its long term triangle.

4dec20124

The German Dax is also back attacking key resistance. Yesterday it was repelled at this key level. I suggested yesterday it may need a couple of sessions’ consolidation before a breakout – and this is because it has already travelled a fair way since mid November on ‘one leg’.

4dec20123

The Nasdaq (and equally the Dow) is attempting to reclaim its 200MA (the SP500 is clear above). The Nasdaq remains in its neat cyclical bull channel, and stocks in general continue to display good breadth and cyclicals performance that are not suggestive of a top.

4dec20125

That said, a combined failure in the FTSE and Dax at upper resistance and the Nas and dow at their 200MAs would open up the possibility of a renewed leg down, and for the two US indices that would then look more like a major top had occurred.

I maintain a bullish outlook for equities into year end, due to positive seasonality (including Presidential), tame forecast geomagnetism, a lack of common cyclical bull topping indicators in the US indices, and renewed breakout attempts in the FTSE and Dax (typically resistance caves in under repeated attacks, the Hang Seng has already led the way, and by solar/secular history an upwards breakout at this point would be normal). We have a period now into and around the new moon of 13 December which should also be supportive. So let’s see if I am correct and all these indices break upwards.

Let me just list one or two other ‘important’ dates into year end. The Puetz crash window extends into the end of this week. The Mayan global transformation / apocalypse is 21 December, the last major Bradley turn is 22 December. The last full moon of the year is 28 December and the fiscal cliff deadline is the end of December. Out of those five, I am not convinced of the first three, but it does no harm to maintain awareness.

The finely poised position in key assets extends to commodities and Euro-USD. The broad CCI commodities index is at downsloping resistance in a potential bullish head and shoulders formation. Ditto the Euro-USD.

4dec20121

Source: Bloomberg4dec20122

Combining stocks, commodities and Euro-USD, we have two clear paths forward: one, pro-risk breaks out (the correction in October / November was a correction in an ongoing cyclical bull), and two, pro-risk is repelled here and resumes downward (the rally in the second half of November was a relief rally in a new downtrend). As is usual when the markets are finely poised, some confusing and teasing action could occur this week, with both bulls and bears prematurely claiming victory before true resolution comes to pass.

Besides the reasons above, one other key reason why I favour a bullish year end for pro-risk, is the improvement in global leading indicators. Markit released many individual country PMI reports yesterday, including fresh growth in China (whether looking at official or HSBC data). Below is the combined global picture, and the theme is fairly clear: a distinct up-tick. This is echoed in Conference Board global leading indicators. The general improvement is not in doubt, the question is whether this is just a temporary relief rally in a continued downtrend, or whether leading indicators have bottomed out.

4dec20126Source: Markit

And here we get to the real key issue. By solar cycles, a growthflationary finale should occur into next year’s solar peak. By stock market history, cyclical stocks bulls end with excessive inflation and overtightening of rates. A cyclical stocks bear here and a tipping into global recession at this point into 2013 would mark an anomaly in both those historic indicators. It would be evidence that central bank actions in cutting rates and applying stimulus have been impotent in this cycle, and that too would also mark an anomaly in history, because historically interest rate cuts have had a positive impact on the economy between 9 and 24 months after cutting cycles, and Quantitative Easing has so far been shown to work its impact through in the two years following asset purchases. The two charts below show the renewed easing and stimulating efforts over the last 18 months – not as dramatic as in 2008-9 but nonetheless a fresh round of pro-action and intervention.

4dec20127

4dec20128Source: Action Forex

If the mechanism is not broken, and such action is not impotent, then we ought to see economic improvement occurring now and into next year. I believe this is the case, as currently global leading indicators are improving, PMIs are improving, and growth in narrow money suggests global industrial output will increase ahead. It is possible that we therefore do see that growthlationary finale next year and we do get normal cyclical stocks bull termination under conditions of excessive frothiness and an upswing in market rates. But one step at at time – first we need to see a couple of months of continued improvement in leading indicators to be confident that this is a new up trend and a normal positive impact lag to central bank actions together with normal buying/speculating/risk-taking behaviour into the solar maximum. If this does not occur and instead we topple over again in terms of leading indicators and key assets, then either (i) the triple historic anomaly would have indeed come to pass (‘it’s different this time’) or (ii) yet further central bank action and unorthodox policy tools are deployed soon ahead before we finally do get that growthflationary finale not too far from the solar peak.

Until evidence points otherwise, I side with it not being different this time and that we will see normal behaviour into the solar maximum, aided by lagged impacts from central bank actions, and normal conditions to come to pass for a cyclical stocks bull end. I believe the current technical action in risk assets is supportive of this, in that we see certain key stock indices pushing to break out, an absence of normal cyclical stocks bull topping indicators (such as breadth divergence and defensives outperforming) and gold in a renewed up trend back above its 200MA following an 11 month consolidation.

Malaysia

Tomorrow I leave Malaysia for Thailand, starting with 4 nights in Phuket. My Malaysian journey has been limited to Peninsular Malaysia (rather than Malaysian Borneo), taking in Melaka, Kuala Lumpur, Penang and Langkawi, and my overwhelming impression is the friendliness and peacefulness of the people. I found this most striking in Kuala Lumpur: a capital city where people are warm and respectful to one another is a curious and wonderful anomaly in my experience of capital cities. Now you are aware that I am accompanied by a family and that might influence the way people react and behave around me, so here is supportive evidence from a couple of studies.

Firstly, the annual Forbes friendliest countries rankings puts Malaysia in 10th spot globally:

1. Cayman Islands

2. Australia

3. United Kingdom

4. Canada

5. New Zealand

6. Spain

7. United States

8. Bermuda

9. South Africa

10. Malaysia

Secondly, the Global Peace Index by the Institue for Economics and Peace, which measures safety, security and conflict, ranks Malaysia in 20th spot globally:

1. Iceland

2. Denmark

3. New Zealand

4. Canada

5. Japan

6. Austria

7. Ireland

8. Slovenia

9. Finland

10. Switzerland

11. Belgim

12. Qatar

13. Czech

14. Sweden

15. Germany

16. Portugal

17. Hungary

18. Norway

19. Bhutan

20. Malaysia

Malaysia also was rated the second happiest nation in South East Asia after Singapore, in the UN World Happiness Report (measured between 2005 and 2011).

When I asked Malaysians why there was such apparent harmony and friendliness, the response was that this is a country of several peoples and cultures living together as one: out of the diversity has come unity (it is around 50% Malay, 24% Chinese, 11% indigenous, 7% Indian and 7% various others).

Clearly, in other countries disparate groups living together has led to conflict and unhappiness, so whether it be cultural, religious, political or social influences at work, it is what is, and the Malaysian people made it a real pleasure to be in their country – so we have been in no hurry to leave. Even in the rawer parts of Kuala Lumpur, I found the atmosphere remained safe and respectful.

Similar to Singapore, for an Englishman like myself, there is a nice blend of the familiar and the exotic. The legacy of British Empire rule is English language everywhere, driving on the left, UK plug sockets and the colonial-styled luxury of the Shangri-La in KL. Yet, the influence of Islam, the multi-cultural cuisine reflecting the multi-cultural society, the 30 degree heat, the tropical storms, the palm plantations, the rain forests, the monkeys and lizards, and the marine life on the reef all made for a terrific novel exotic experience. The icing on the cake was a cost of living that I found to be overall about half that of the UK – our accommodation, transport and dining. In an odd twist, eating out worked out cheaper than self-catering from the supermarket. How is that reverse premium possible?

One contributing factor to the lower cost of living is Malaysia’s oil production and associated energy subsidies (several oil-producing country governments subsidise fuel, to benefit their economies). Malaysia also has a rich natural resource heritage – it is a leading global producer and exporter or rubber and palm oil, and also wood and wood products. But it has also become a diversified economy, including becoming the world’s leading Islamic finance and banking centre, and operating one of the world’s only six 5-star airlines. In short, it is an economic success story since becoming independent half a century ago, and is the 28th largest economy in the world. GDP has grown at an average 6.5% per annum in that time, charted below:

Source: World Bank

The Asian Banking Crisis of 1997 made for the biggest dip in economic development, but it fairly swiftly recovered to trend. Debt to GDP is around 50%, a manageable level.

The housing market has been the 9th hottest real estate market in the world over the last 5 years, but property prices remain very reasonable relative to other hot property markets such as Switzerland and Singapore. The stock market (the KLCI) has also performed well, as shown below, but is currently valued at at p/e of 15 and a CAPE of 20, so does not represent an interesting opportunity at the moment.

Source: Bloomberg

There is also a government scheme to encourage foreigners to live in Malaysia on rolling 10 year passes, with fairly low entry criteria compared to most other countries. Details here.

Like anywhere, there are negatives, and the following are my such perceptions. Whilst the infrastructure and public transport is generally of a high standard, the common taxis are largely decrepit. Whilst the area of Kuala Lumpur around the Petronas Towers is very nice – there are large chunks of the capital city which are, to be blunt, an eyesore. Whilst Penang is a cosmopolitan island with some plush developments, there is also a fairly large contrast there between the poor and the rich. The open drainage system throughout the country causes some bad odours, and capital punishment and certain particularly harsh laws may not appeal to everyone.

As this is a country that can be currently considered in transition from a developing country to a developed country, it is easy to imagine some of these issues being resolved with continued growth. There is a lot of new build development occurring in Johor, Melaka and Penang – a lot of ambitious investment. I can contrast that with large parts of the UK where building has slowed to a standstill and high streets remain partially empty since the 2008 recession. All in all, Malaysia’s people, natural resources, sustained economic growth and investment, and geographic position in the world for this century (expecting Asia to lead global growth) make it an exciting and appealing country. I really can’t praise it enough.

Some pics. The Petronas Towers in KL – the tallest ‘twin-towers’ in the world. Chinese clans still living on stilts in the sea on Penang. The rainforest island of Langkawi. And monkeys everywhere…

Global Macro and Leading Indicators

Let me recap on my overall position. I am long commodities for a parabolic finale into a secular peak in 2013, with my biggest exposure in precious metals. I am long stock indices, largely opened in Q2 2012, looking for a cyclical bull top in the current window stretching into 2013. I have recently added long certain stock indices looking for a longer term hold, where I believe secular bear value has been reached, namely China, Russia, Japan and Austria. And lastly, I am short treasuries, with less exposure than stocks and commodities, also looking longer term for a new secular treasuries bear market.

The recent draw down in equities has reduced my open profits – but judge me on my trades once they are closed. A cyclical stocks top is a process, with common characteristics. Large sideways volatility with alternate up down moves as the market gradually rolls over in a period of months, and a double top or higher high where we see negative divergences in internals, such as breadth. As the topping process unfolds, we should see more and more issues at new lows as participation thins, and we should see defensives outperforming cyclicals. Right now, we continue to see cyclicals outperforming defensives despite the falls, we have not seen the trademark congregation of new lows leading into this, and if this is a top, we have yet to see the push back up the highs, accompanied by the telltale weakening internals. I have not blindly held on to long equity positions, but am awaiting the coming together of topping indicators to sell out. Patience, as always, is the key.

If a topping process in equities has not begun, then we should need to see improvement in global macro and leading indicator data to support bull continuation following this correction. If a broad commodities acceleration is to take place, then even more reason to need improvement in such data. In another twist, we now see signs that data may indeed be improving again.

Here are the latest Conference Board leading indicator releases:

UK +0.2 (same +0.2 previous month)

Japan -0.4 (up from -0.5 previous month)

Spain +0.3 (up from -0.1 previous month)

Korea +1.2 (up from -0.6 previous month)

So improvement across the board again, and a big leap in Korea in particular.

Next is a chart showing the drop in industrial output globally that has been recently taken place (aggregated for the G7 and leading emerging 7 nations). However, the leading indicator here shows an upturn ahead. This leading indicator is global real narrow money expansion and precedes economic activity by around 6 months. Global real narrow money supply has been growing since a bottom in April/May, so industrial production should now start to increase again.

China’s recent improvement in economic data could therefore be part of a wider pick up in growth globally ahead.

For the US, there continues to be mixed data, but the overall picture is represented here by ISI’s diffusion index, which subtracts the bad data from the good, and it can be seen this is currently positive and rising, not the picture of an economy rolling over.

Source: Advisoranalyst / Factset / ISI

The Economic Surprise Index for the US also maintains a positive picture:

Source: Advisoranalyst / Factset / ISI

Overlaying this economic surprise index on US stock market performance reveals a current disconnect – either economic data should now rapidly start to disappoint or stocks should reverse upwards – or some combination of the two.

So let’s see, but maybe tipping into global recession is premature. It could be that the mid year series of rate cuts, renewed QE and other stimulus measures needed time to have an impact. By solar-secular history, a growthflationary finale should be the theme into next year’s solar peak. A cyclical stocks bull top should also be accompanied by rising bond yields, which would be more likely under growthflationary conditions. The relationship between 5 and 10 year inflation expectations and real CPI reveals that inflation should pick up as we enter 2013. If global deflation is setting in then that would be difficult to achieve.

Lastly, here is the updated Hang Seng chart for interest (click for full size). It recently broke out of its long term triangle and is now backtesting the breakout. Will it hold and push on? Failure here would be particularly bearish, as a return into the triangle would suggest a fake out had occurred, with the possibility of a subsequent breakdown the other way.