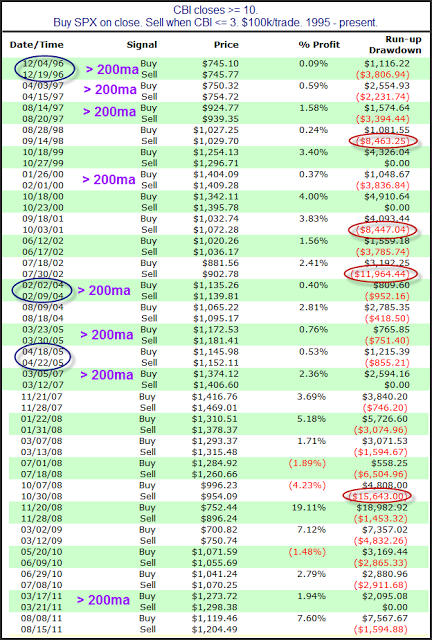
I’ll cut to the summary: there were some signs of capitulation yesterday, but that was not likely the bottom. I’ve kept all my short positions, here’s the analysis:
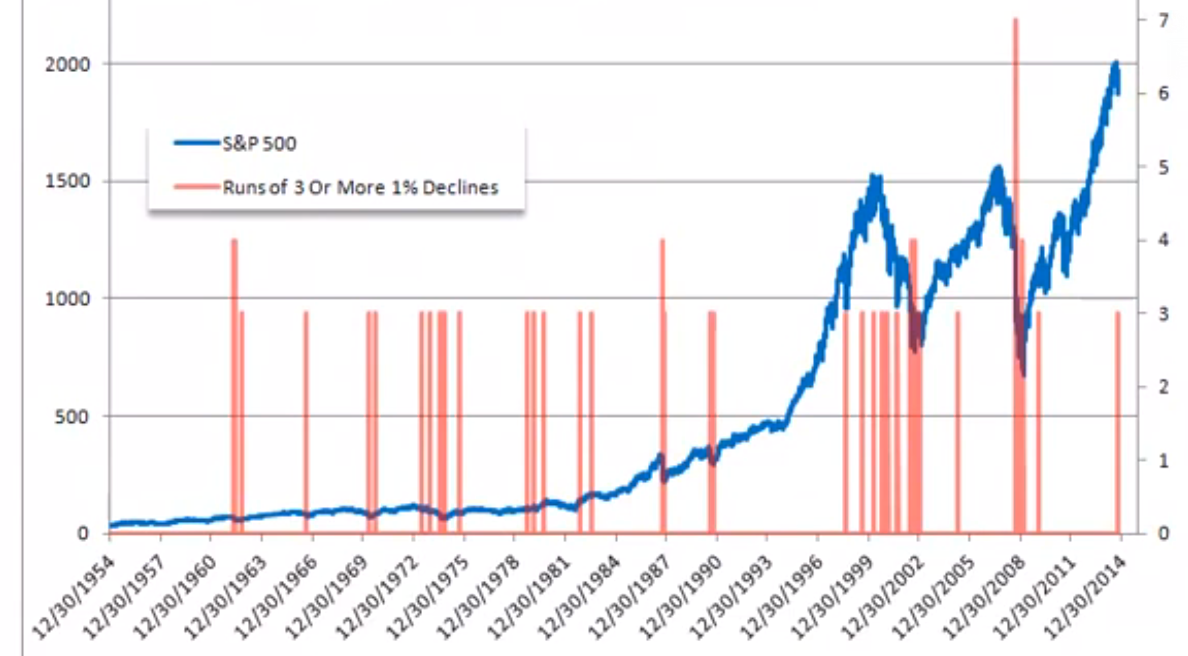
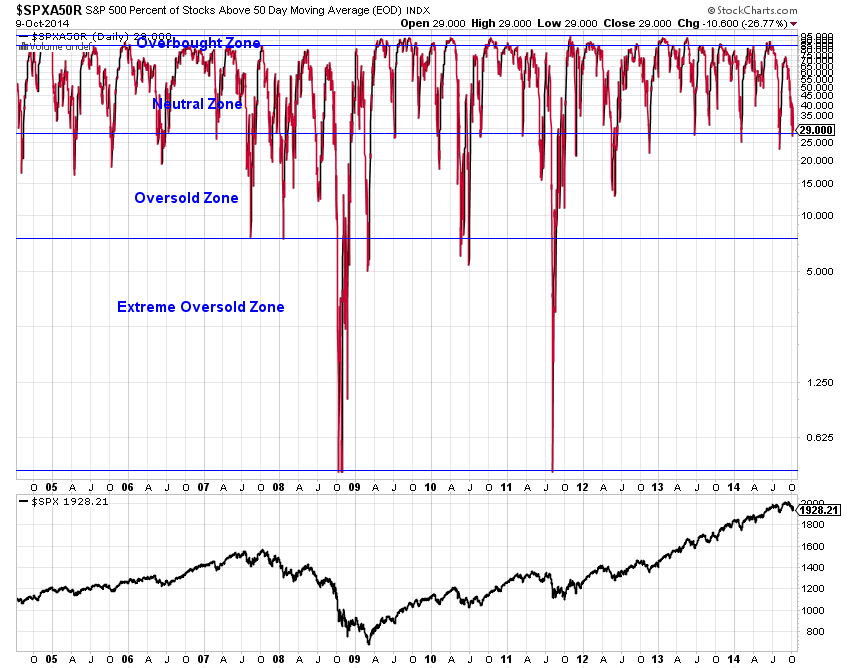
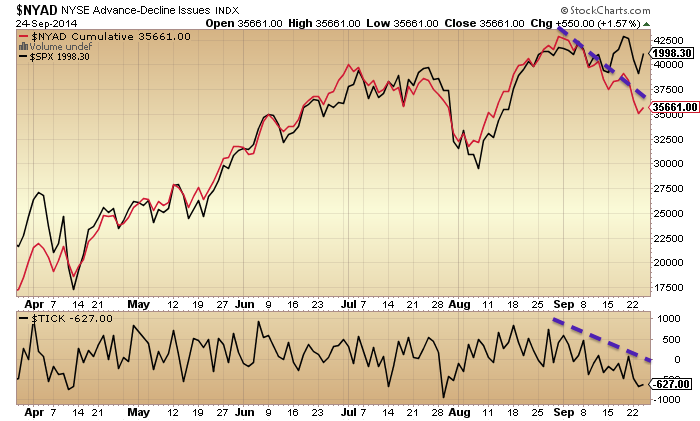
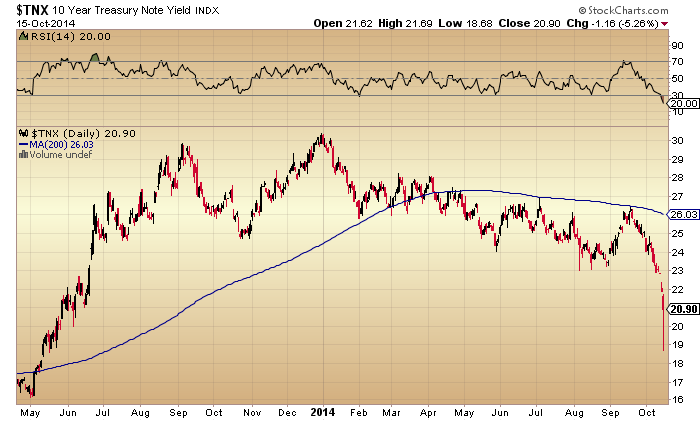
Capitulation signs: high volume, intraday reversal hammer candles on stocks and treasury yields:
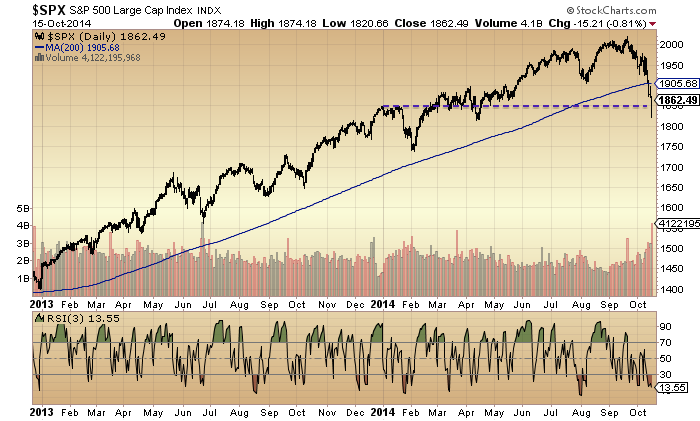
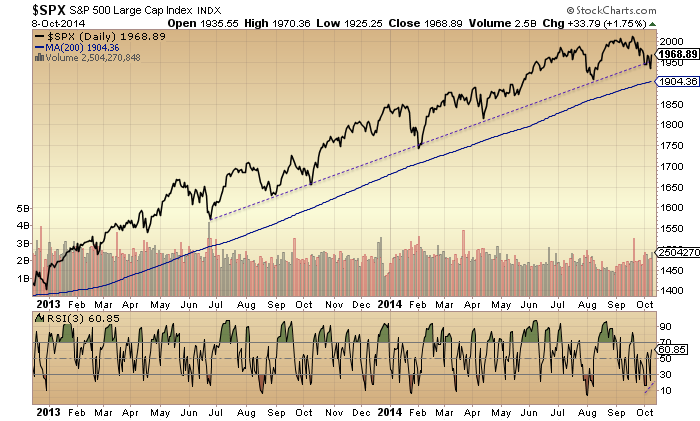
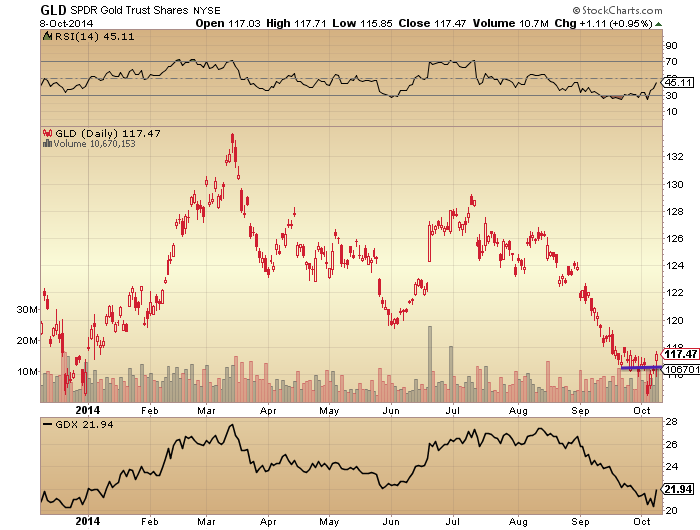
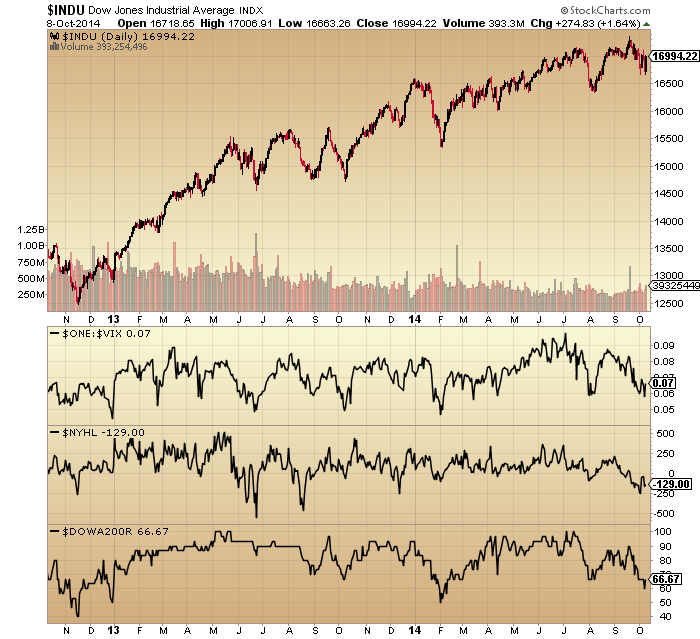
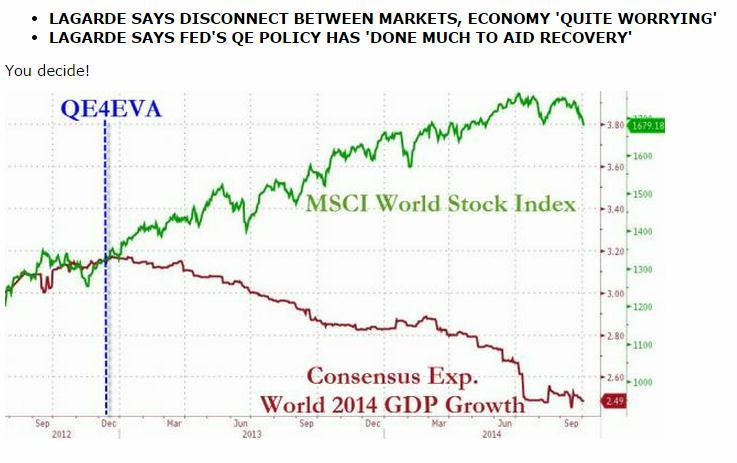
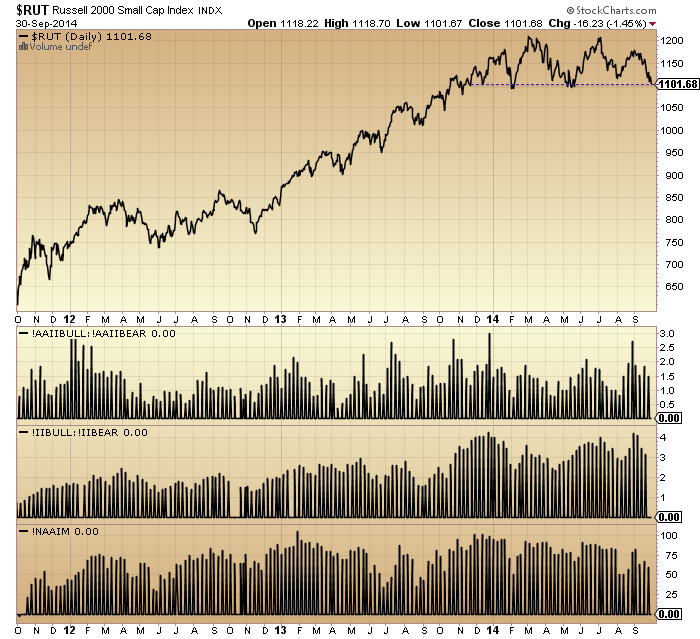
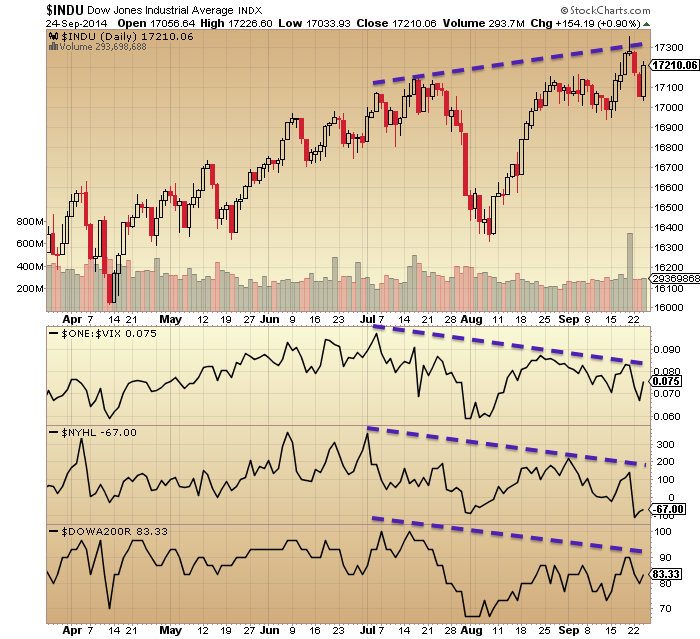
 Source: Stockcharts
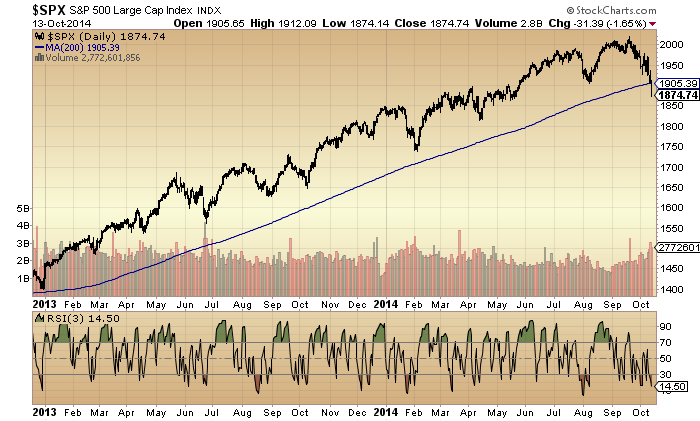
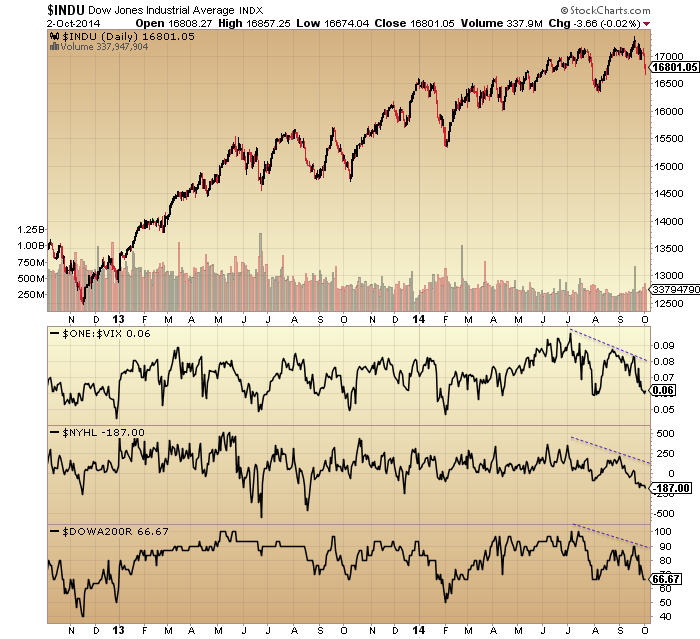
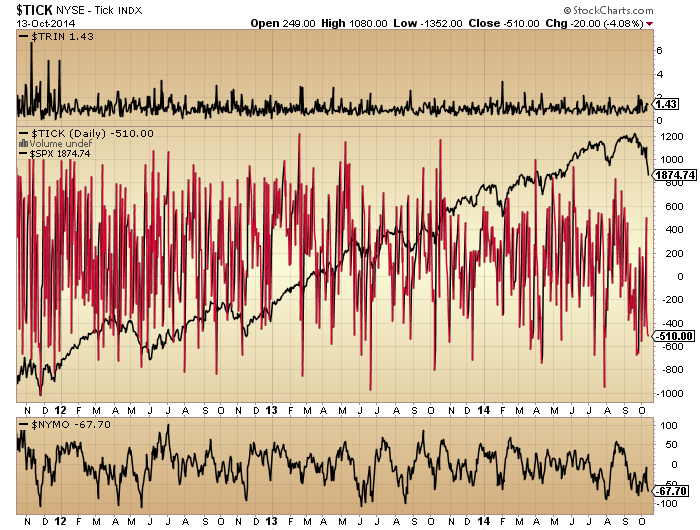
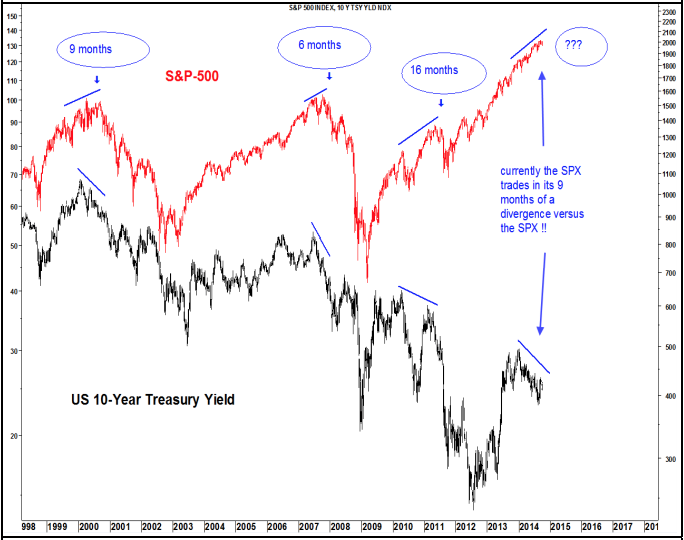
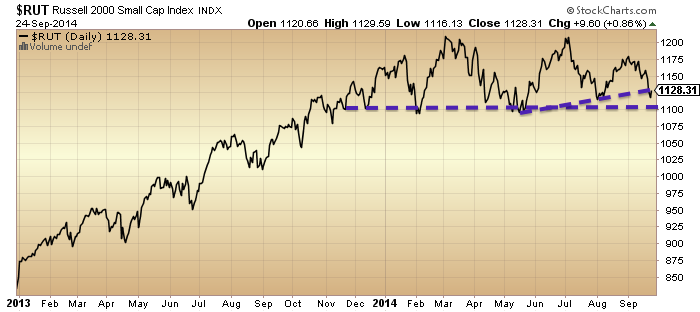
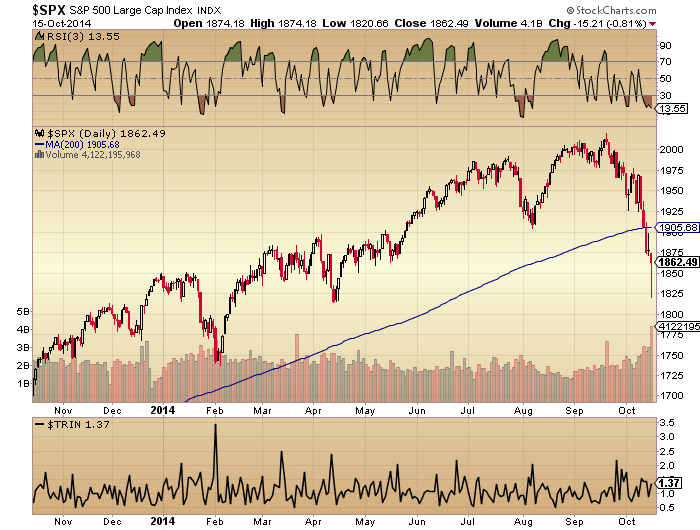
The dotted line on the top chart shows the YTD progress. The SP500 dipped negative yesterday and almost hit 10% down from the September peak, but closed at around 9%. By the range of my analogs, we should see a minimum 18% correction, so that’s not enough.
Rob Hannah’s capitulative breadth hit 19, an extreme level associated with bear market bottoms. The initial reaction to that is that it sounds like a golden opportunity to go long, but the considered reaction, IMO, is that given we are just 9% and 1 month down from all-time highs, this time is clearly different. He doesn’t reveal his formula so the analysis has to stop there, but we can look at other indicators for more clues.
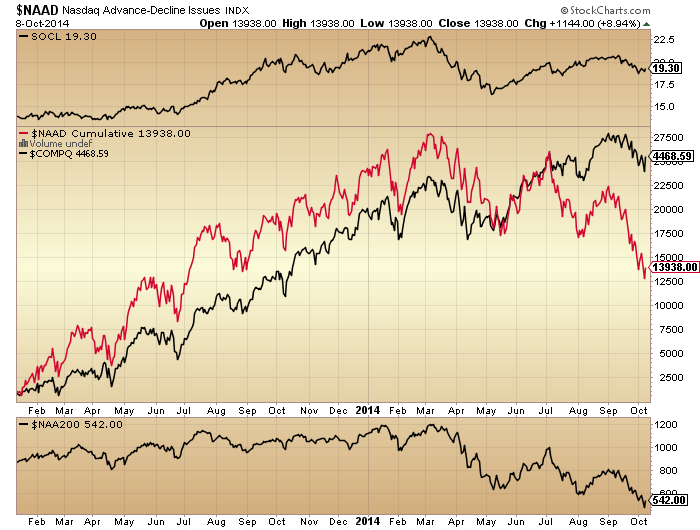
Yesterday’s selling did not appear exhaustive as small caps held up well. As the highest risk equities class, this runs counter to previous capitulative sell-off examples, such as in 2011. That suggests there should be another sell-off ahead in which small caps participate.
Drawing together 2010 and 2011, we can see that intraday hammer candles did not necessarily mark the bottoms in equities (red circles). However, if yesterday’s hammer was indeed a bottom then we should be heading for a retest and likely lower low on positive divergences as momentum wanes (purple circles).
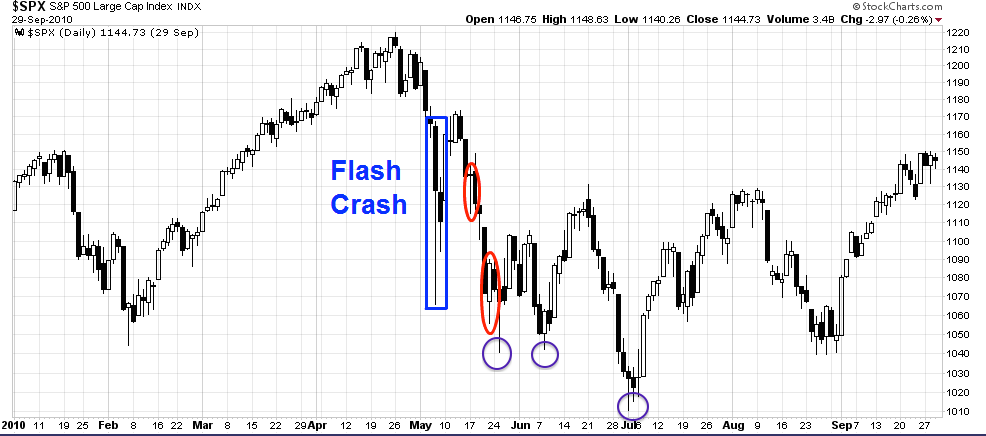
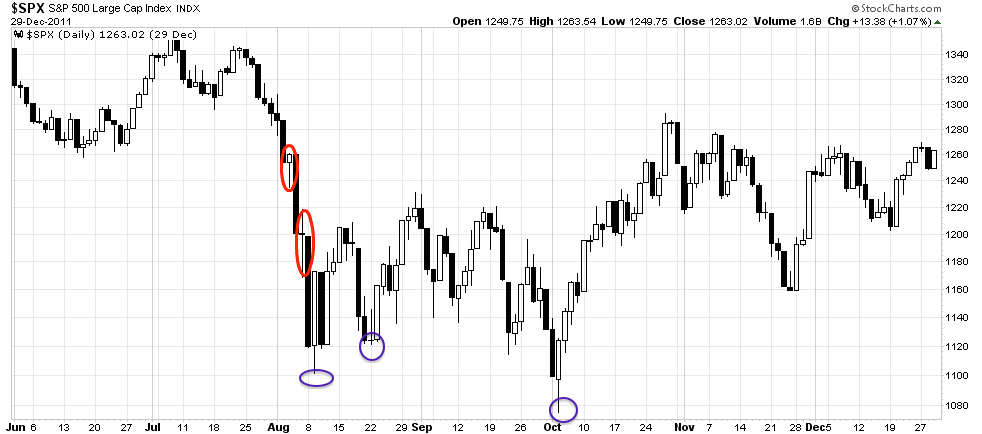
Source: Cam Hui / My purple annotations
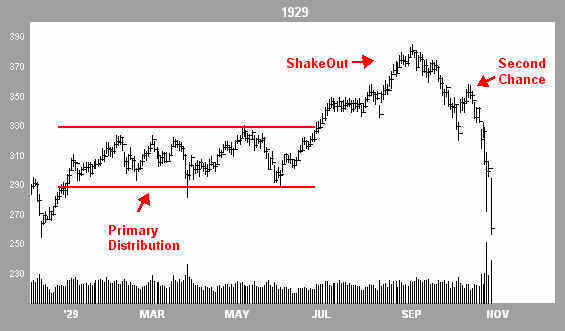
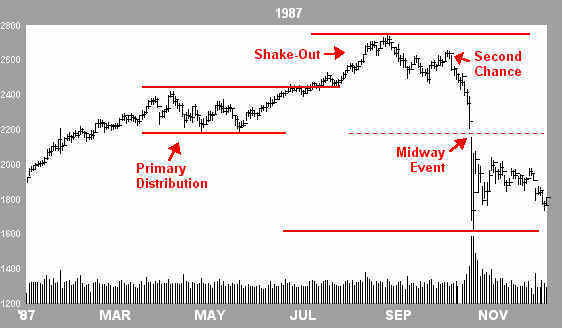
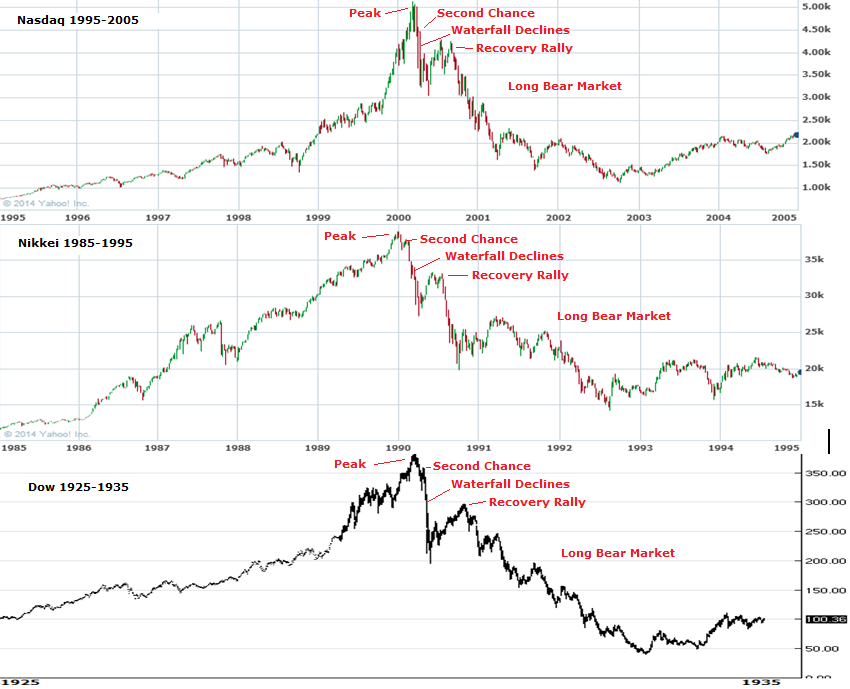
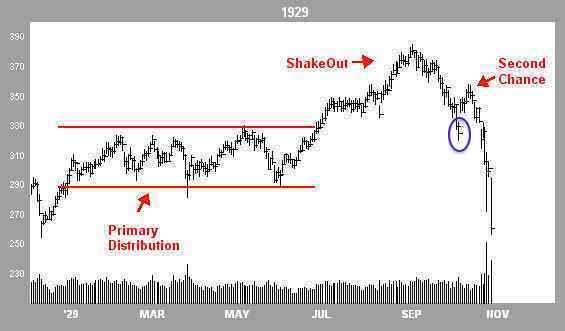
If we look at the 1929 analog and assume we are not post-second-chance but at the purple circle, then a few days’ bounce before rolling over again would mirror not only 1929 but also the action after the first purple circles in the 2010 and 2011 charts above.
 Source: Financial-Spread-Betting
Evidence, however, suggests that we should be post-second-chance, and so far, the steepening downtrend in price is supportive of that. If that is so, then yesterday’s candle should be quickly engulfed and a much bigger panic sell day should come to pass within days.
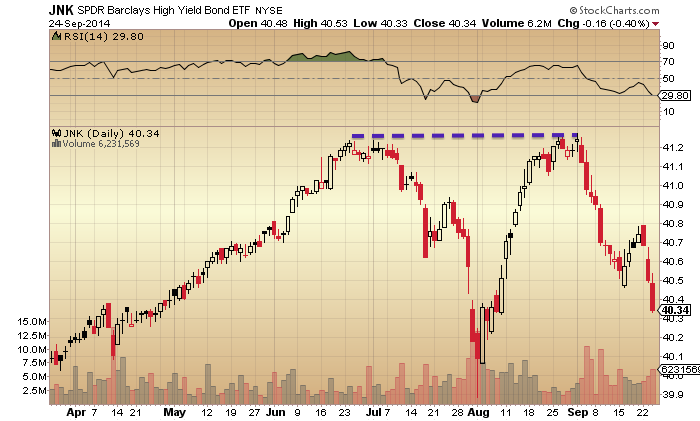
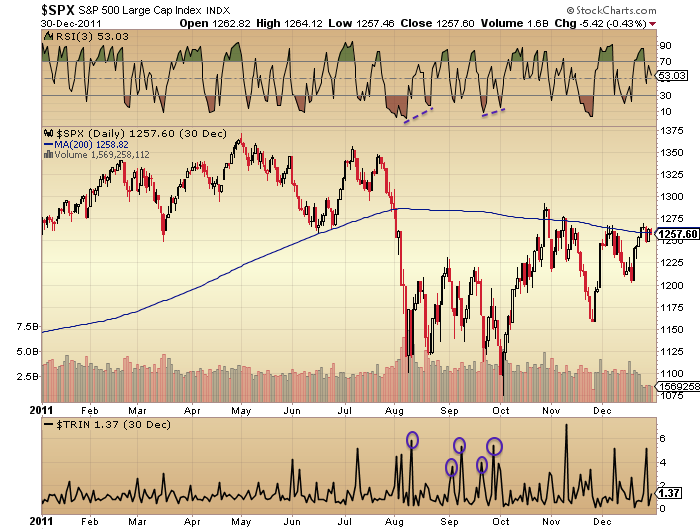
Putting that crash scenario aside, stocks typically need to stabilise and generate positive divergences after a sell-off such as the last few days. They do not v-bounce back up to the highs. For example, below we can contrast the positive RSI divergence in 2011 and the levels of Trin washout compared to now, i.e. both are missing:
So, either yesterday’s hammer candles are quickly engulfed over the next couple of days, like the red circles in the 2010/2011 charts or post-second-chance in 1929, or we rally for a few days (perhaps into the October 23rd new moon) and then turn down again to the lows, like the purple circles in 2010/2011/1929. A v-bounce back up towards the September highs would be anomalous and only have support from the CBI, which itself has produced an anomalous reading.
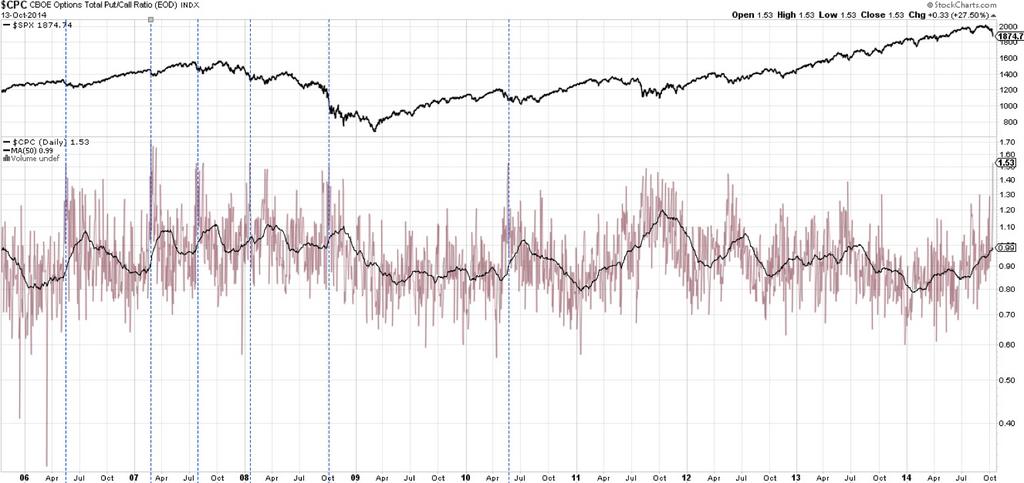
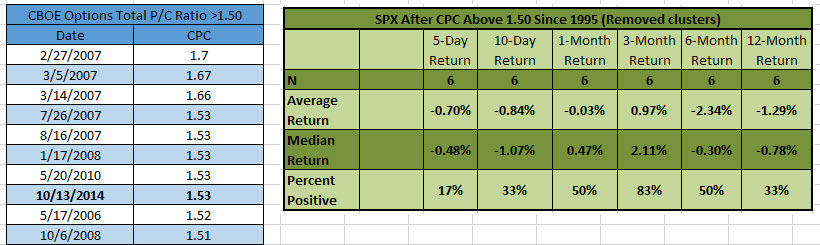
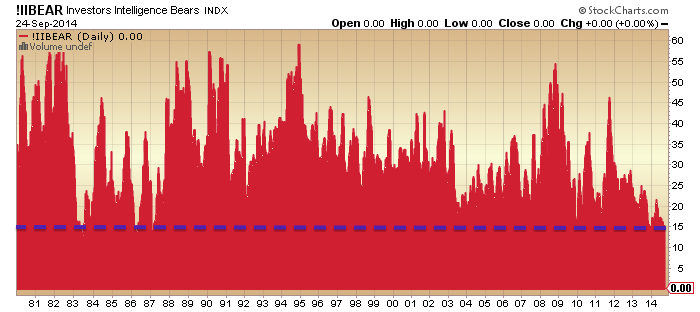
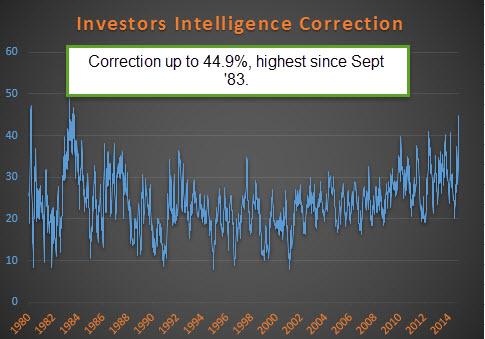
Continuing, the Investors Intelligence spread has narrowed, but still needs to neutralise some way further before we could argue for capitulation. Bears are still at just 17%. Interestingly, the percentage of respondents predicting a correction rose to an extreme level last seen in late 1983:
 Source: Ryan Detrick
We can see that reading was indeed followed by a correction, so was not contrarian:
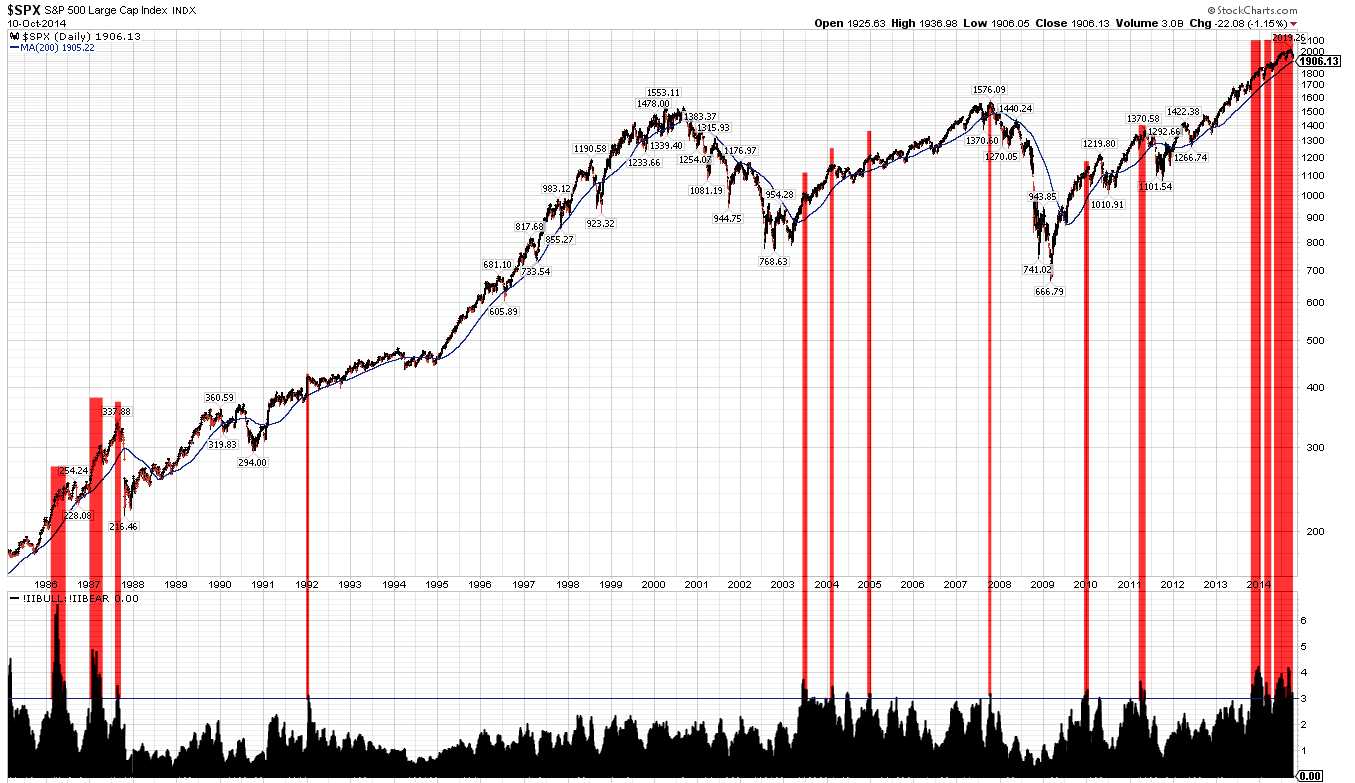
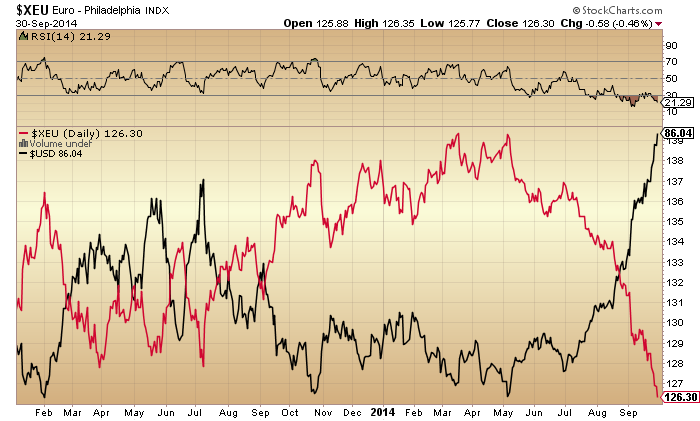
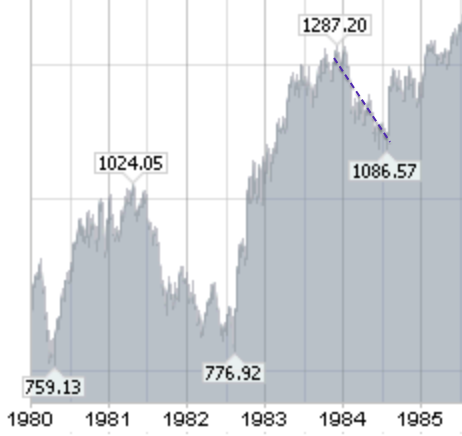 Source: Stockcharts
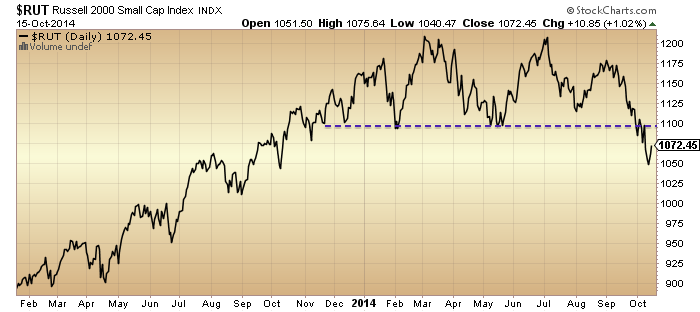
The Russell 2000 outperformed the last couple of sessions, but has broken down the most of the indices overall. It would need to quickly recapture the 1100 level to keep any consolidation hopes alive. Otherwise, the bears are in control.
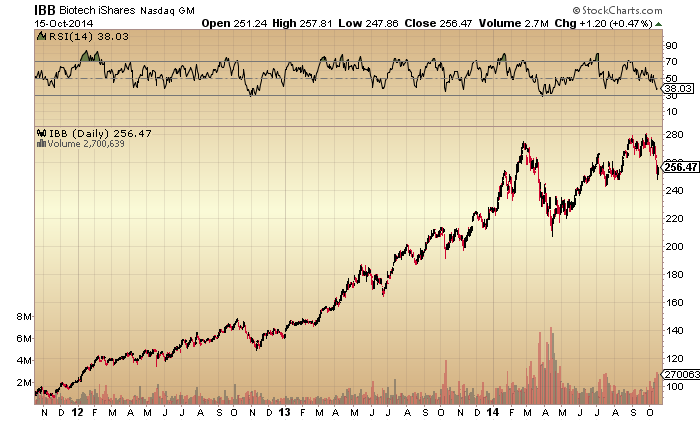
 Biotech now looks to have been turned down at a double top with February.
 Apple tentatively broke down from a 6 week trading range yesterday, but the pull up into the close keeps it tentative.
To sum up, the most bullish scenario is that we rally for a few days then retest yesterday’s lows again on positive divergences. The most bearish scenario is that yesterday’s range is swiftly engulfed by the bears over the next couple of days and a much bigger panic sell-off ensues.