
The Fed announced tapering of QE as of 2014, subject to developments of course. It will first need to taper out its QE to zero before rates can rise from ZIRP. Rates will then likely be raised slowly as in the 1950s due to high government debt. Together this means easy monetary conditions will persist until US demographics bottom out 2014-2019. I suggest that is broadly necessary to counter the demographic downtrend and could mean that we see continued low growth with more asset bubbles appearing and then popping.
What would change this course of action? If inflation became problematic and yields rose too far too fast. Currently inflation is benign as global growth remains fairly soft. History reveals that a low growth low inflation low rates environment is good for equities. It took the last 12 months for investors to really gain confidence in economic growth persisting (if soft) and with a gradual bottoming in government bond yields:

Source: Bloomberg
At those record low yields, investors were making a guaranteed real loss, yet money flows were still attracted into government bonds – with the assistance of QE in USA, UK and Japan – due to fear of greater losses in other asset classes. Recently that has changed, and it is because low economic growth has persisted long enough with some of the main worries (e.g. Euro debt, sovereign default) deflated. That does not preclude new crises emerging, but there has been a gradual process of repair since 2008, and I suspect we have seen the bottom in bond yields.
Because we are currently in demographic downtrends for the USA, China and Europe, I suggest it makes sense that only low growth is the current norm and that easy monetary conditions are likely to be maintained until a collective demographic improvement as of around 2020. Gains in real estate and equities should be capped by the demographic downtrends, but supported by the easy money conditions. Commodities have historically performed well during demographic downtrends, but could struggle to make large gains if soft growth holds down demand. Money should continue to flow out of government bonds, with any of those three classes the recipient, unless real yields rise too high for bonds to become attractive again. Yields cannot be allowed to rise too high because of high debt servicing and negative economic impacts. Combined, that makes for a fine balancing act between all four asset classes.
Japan is one economic giant that is in a demographic uptrend and I believe the recent surge in equities there is a belated catch up to that trend.
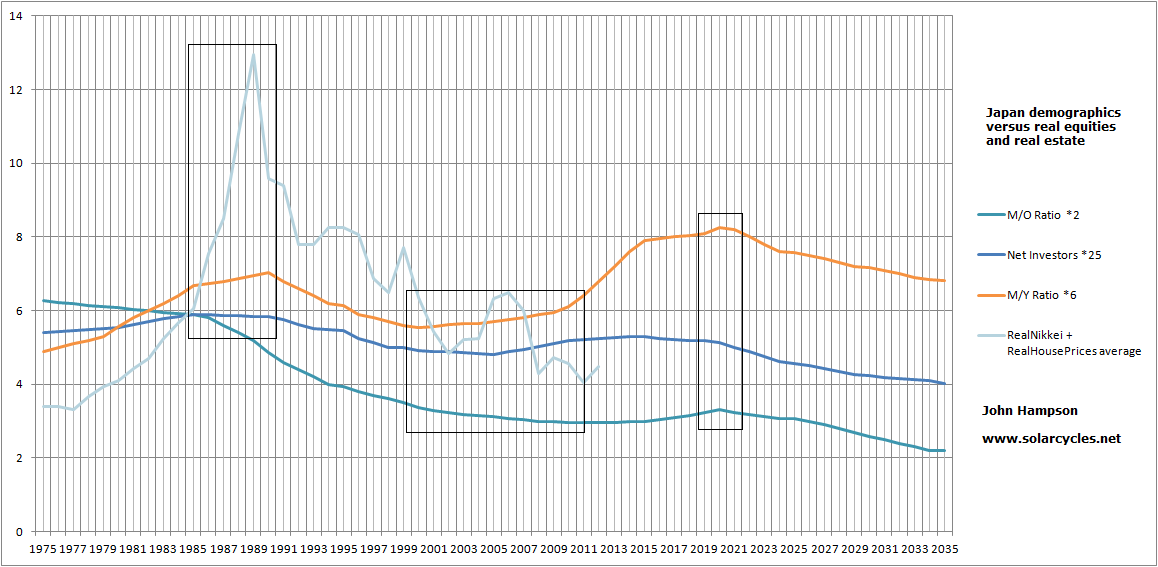
I believe Japan was ripe to bottom around 2002, along with demographics, but was then pulled back down again with the global crisis in 2007/8. The H1 2013 Nikkei rally was stopped at the long term declining resistance, but I think this time it will burst through it successfully, in due course:
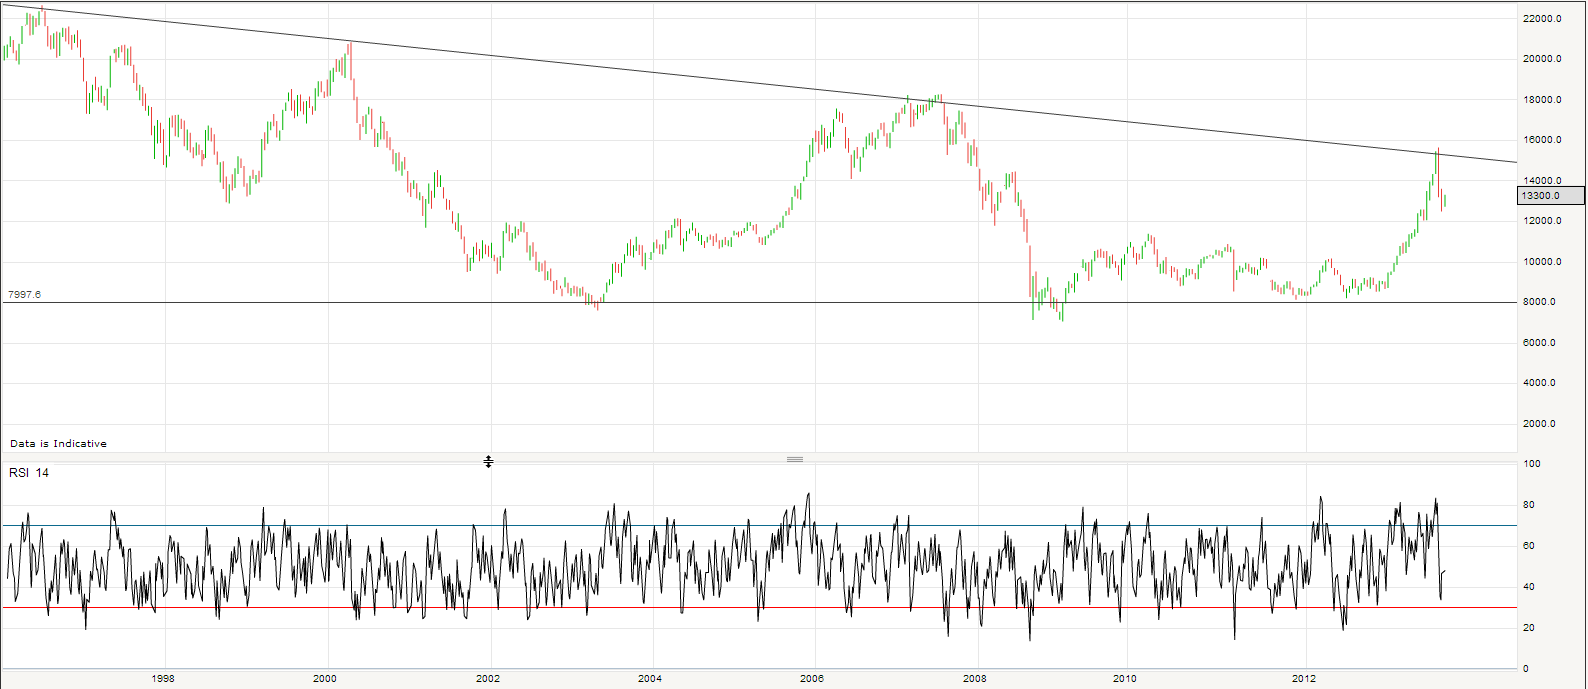
The Japanese government has declared it will do whatever it takes to re-inflate the economy and assets including buying equities. The question is how long it will take to break through. If US equities are beginning a topping process then it would seem unlikely that Japanese equities break out at this point. If emerging markets are heading into a crisis, as Russel Napier believes, then a global sell-off would likely take place again.
There are 3 possibilities here for US equities. One is that they have run up in an eiffel tower parabolic formation and will collapse now down the other side. Two is that they have begun a topping process whereby we should see an overall sideways volatile range over several months whilst negative divergences appear. Three is that they are consolidating before further gains.
Because of the sharp run up and the demographic headwinds, I have my doubts about option three. However, cyclical stocks bulls usually end with commodities and inflation rising to become problematic and helping tip the economy into recession. Inflation rises, yields rise and the higher input costs and higher rates squeeze the economy. Bonds top first, then equities, then commodities. At this point we appear to have seen a top in bonds, but do not yet see commodities or inflation rising. Therefore we don’t see the usual historic pressures to pull down equities. Low growth, low inflation, low rates: good for equities.
For option 1, a harsh collapse, some analysts are referring to a 1987 overlay, predicting a crash. I can’t rule it out, I can just refer to that current environment again – it differs significantly from 1987 where yields and rates were much higher. We know that flash crashes can happen, where automated selling begets automated selling, but I suspect we’d need a swift change of status quo to bring it about. Something like the possible emerging markets crisis.
For option 2, a topping process, we would have time. There is no rush to short until we need more technical evidence of a topping range and negative divergences in breadth and leading indicators begin to appear.
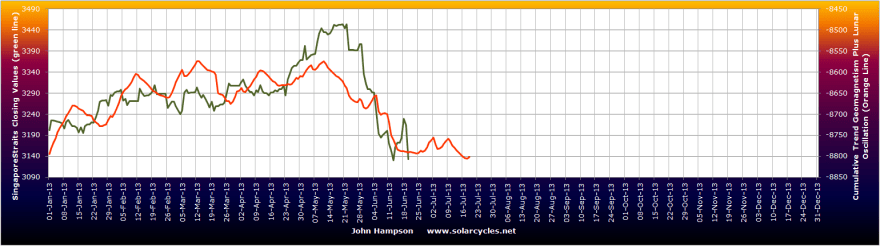
In the short term, I believe we could be reaching a point this weekend whereby equities rally up again. Passing through the full moon together with a possible bottoming out in geomagnetic disturbance – the Singapore STI shown here mapping very closely to the model:

Plus, low Nymo and bullish percent / call put readings in US equities suggest a bounce imminently.
If equities do bounce then crude oil has a chance of holding its breakout, which it is currently backtesting. If crude cannot, and falls back into the triangle, then the textbook action to follow would be a breakdown out of the bottom of the triangle, which would likely spell prolonged doom for the commodities complex.
So will commodities come again? I believe they will. Nothing goes up or down in a straight line. Mean reversions eventually occur, if not something more juicy. What could give them momentum? A top in equities or concerns about the economy functioning without QE could spur money into precious metals as safety again, with a short squeeze possible on record short interest. Geopolitical developments can affect oil prices and in turn wider commodities and protests/wars are common at solar maxima. Global warming and global wierding remain risks to agricultural commodities, with May having come in at the 3rd hottest on record globally and Jan-May the 8th hottest on record. Global temperatures have historically peaked around solar maxima.
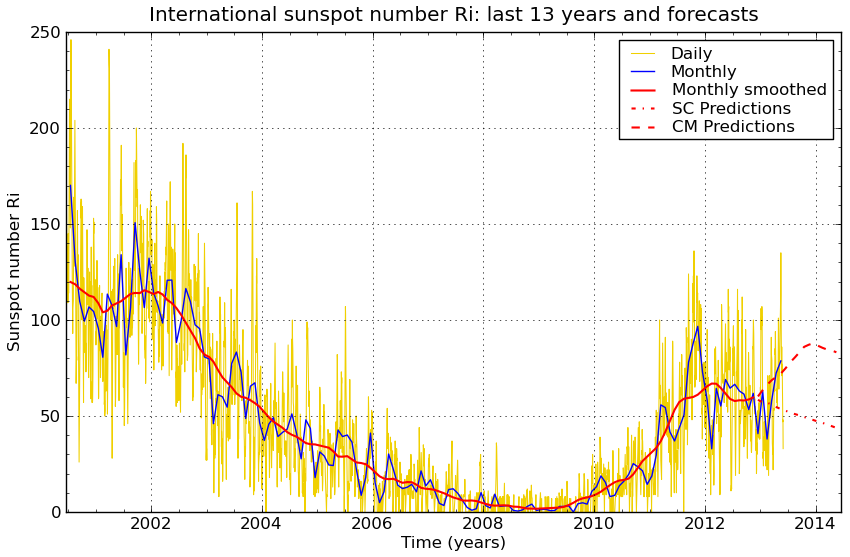
The latest on solar peak prediction is that NASA believe a summer peak in 2013 is likely, NOAA a Nov/Dec 2013 peak, and SIDC running with two options as shown:
 Source: SIDC
Averaging, we could look to a late 2013 smoothed maximum. Historically, secular asset peaks have been made close to solar maxima, along with inflation peaks. We should allow around 12 months for commodities to rise up and make a ‘secular’ peak and an associated inflationary peak if it is to happen along with this solar maximum, so it should be the theme from here into 2014 if it is to occur. With bonds having likely topped and equities having rallied hard, we are also ripe for outperformance to emerge in commodities. However, economic data out of China, increasing inventories, depressed sentiment in the class, and strength in the USD are some reasons why this is not occurring. Until this collective picture changes in some way, I have to remain open to the possibility that commodities will underperform through the solar maximum, and this could mean a different asset class is bid up to a speculative peak if the solar maximum is still ahead.
From my recent Dow-gold ratio analysis, I suggested two likely bottoms in the ratio: 2014 or 2025 (approx). Either a swift run up to a speculative peak in gold into next year, or a mid-point currently on the way to a bigger gold peak a decade away at the next solar max. From the same analysis, demographics in the main nations no longer offer clear support for either equities or gold going forward, which I suggest means we are likely to see less wild swings between the two, and alternating shorter bulls. So I remain happy to average down in gold and other commodities, particularly with my new cash injection, and await either a mean reversion rally or a possible momentum move into commodities once a trigger emerges. I also would add to long Japan equities on any further drops. I am tempted by the weakness in positive-demographic Brazil and India to build more of a long positive there, but each are currently experiencing their own economic or social problems which could yet worsen so I am going to hold off. I would look to add short equities if a topping process becomes clearer with negative divergences. I remain short treasuries.
I believe the greatest risk currently to my portfolio is some kind of sharp global sell-off, a collapse in US equities infecting all pro-risk. However, I really can’t call a winner from the three options I outlined above for US equities at the moment, so await further flags and developments. If pushed, I still place greatest likelihood by a historically normal unfolding of events, namely that bonds have topped and we will see equities top as commodities outperform, with commodities topping last, helping tip the world into recession and end the equities bull; that the solar maximum will inspire speculative peak and that peak will be in commodities (or precious metals at least) due to the collective demographic downtrends aside Japan. However, I am nowadays ultimately of the view that there is complex interaction between demographics, solar cycles, fundamentals, government intervention and more, that make it a difficult calculation. I believe anomalies can occur if several of these factors conspire together to produce one, which is why there is no holy grail. However, I expect clearer ‘probabilities’ to emerge from here, one step and development at a time.

Gold at double fib here:
http://blog.afraidtotrade.com/a-quick-monthly-chart-fibonacci-confluence-support-level-update-for-gold/
I am close to get signal of a major top in Norway. What kind of major top I dont know yet, but if confirmed it will suggest weakness the rest of 2013, and at best sideways to summer 2014 (with a possible higher high in the winter).
At worst we just had the bullmarked top…
OR… I dont get signal of a major top yet, and we rally at least to Aug-Sept 🙂
Thanks Jan. The first would fit the Bradley model. The second would fit a topping process with the second high ahead of the geomagnetic/seasonal weakness of Sep-Oct.
btw I consider the sunspotcycle to be dead. No more attempts to make a maximum, only lower highs and trendning down.
Around the world I see signs of risk-off. This bullmarket is driven by the “story” of FED and QE. I dont think they have any significant effect, other than making a “story” that draws in speculators. This “pyramide scheme” will go on until it stops, and right now it may look like its about to finish… unless we are quickly saved by another QE 🙂
Agree on sunspot cycle….dead.
But,
Lets take commodities out of the equation, because QE has changed the market, created artificial data,and destroyed past performance.
US QE4 to follow at lower values.
Japan QE1 still to take full effect.
Euro QE2 still to be introduced .
Where does that leave us?………more upside.
bob
Sung to the tune of “Wishing and hoping”
could be… but… something is going on right now
alot of selling in bonds… all crashing below 200MAs… like MUB, JNK, PHK, DJCB, TLT. And commodities as well. And all international markets, expect US, DAX and a couple more, are really really weak. Forex is wild and volatile.
And the sunspot cycle seems to be dying.
This smells like dwindling of the “QE bull market”…
There has never been this much money in the world… and there has never been this much leverage in the world.
And the ~80-year cycle says depressions are to be expected in these decades.
I smell one coming soon 🙂 The Bloomberg-mantra all year… “the strong recovery in US”. SPX breakout to all time highs. Looks ripe to me 🙂 Not much left at least…
I wouldn’t be too quick to write off the current solar cycle. Weak cycles have a tendency to peak rather late. They usually have a 4 year plateau type peak, with occasional monthly spikes. Solar cycle 16 was a typical example, and has a lot of similarity with the current one: http://www.solen.info/solar/cycl16.html
If we have the same now, then look for ssn to hover around 50-60 with some monthly spikes to 90-100 until ~6 years after the start, which would mean until the end of 2015 in this case
My scenarios are:
Referring 1909-16-19 top pattern, after 1919 crest, we could see a plunge about 40-50%, +-0,76 fib, 8.000-9.000 levels Dow Jones, 85-1000 s&p, even marginal lows around 7.000, the prior bottom.
In this scenario, could see a new high, but befor a limited correction, typical in Dow top patterns, about 10%, and finally the parabolic mov/ marginal hihgs.
Referring to the 1980 S&P top pattern, top process underway, with small corrections, before the drop, about 30-35%>10.000-11.000 Dow Jones and 1.100-1.200 S&P reaching the mma200.
Regards, John.
OK, thanks Antonio
An option un 1980 scenario is instead nov´13, feb´13; in this case, the drop w´ be about 23-23%.
Always, in both cases looking for the 200 month ma, to close shorts positions in s&p/ Dow Jones.
Prior that, see a bottom in the 200dma.
850-1.000 s&p, sorry.
@apanalis
John,
Your post states that you have to remain open to the possibility that commodities will underperform through the solar maximum, and this could mean a different asset class is bid up to a speculative peak if the solar maximum is still ahead. Which asset class?
Maybe Japanese equities.
Also, it’s interesting that on June 1 Charles Nenner predicted that gold would bottom at 1285 around the middle of June. I think gold bottomed at 1269 on June 20 and ended the day at 1291. His gold prediction is at about 20:00 minutes at this audio website.
http://www.financialsense.com/financial-sense-newshour/2013/06/01/charles-nenner/short-term-cycles-are-topping
Thanks Jack
I know this may sound a little outlandish but we could be looking at a flash crash ala a Black Monday type of scenario on Monday (not to the extent of ’87 but maybe 5-8+%). I base this primarily on the absolute throttling of the credit mkts this week (especially the municipal mkts up and to including today as well as the high yield mkt undercutting the Nov lows today). In addition there’s been an accumulation of VIX calls (July opex) in the 40 to even 60 range this week. Would be nice to see a pop first for the next leg down but I have a feeling fear will build over the weekend and we’ll see a significant downdraft in futures Sunday night and a waterfall on the open. Yes it’s a stretch but a possibility from what I’m seeing (and feeling). GL all.
Good case Nate. I would add the full moon this weekend and some geomagnetic disturbance currently could assist in that. If it were to occur it would be telling to see whether gold catches a bid as a safe haven.
This moon is also a perigee or supermoon, bigger, brighter, and closest to earth till Aug 2014. http://www.spaceweather.com/
according to my ~6month cycle, we are now in the crash-interval (like 2008 and 2011). This cycle is a bit less than 6 months, so the interval is a bit earlier each year.
Normally, to have a crash setup, we need a shoulder just ahead of the crash interval, and SPX made such a shoulder, in a short-term setup similar to 1987.
So the window stays open for about 2 weeks (but if we start to crash, it will last longer).
A missing piece is another geomagnetic storm to create panic. But it is perhaps not needed. There were so many storms recently, “making holes in the Titanic”… that it may sink without any more storms.
I see tendences to panic around in many markets, but it has not yet gotten really bad. So next ~2 weeks we´ll see whether it happens or not.
Such crashes dont happen often, but I would say it is a hightened probability right now 🙂
also, chk out the monthly DAX John…. http://stocktwits.com/message/14241770
this is Norwegian NOKUSD. Visually a good correlation, and support-line broken recent days

And Norwegian index vulnerable for a ~10% drop

Parking myself in Dell and going to the beach =)