In total I spent 4 weeks in Thailand in 4 different places: Phitsanulok, Bangkok, Hua Hin and Phuket. There were some common threads to my experience in all 4 regions, which, backed up by reading and research, have formed the impression I outline below.
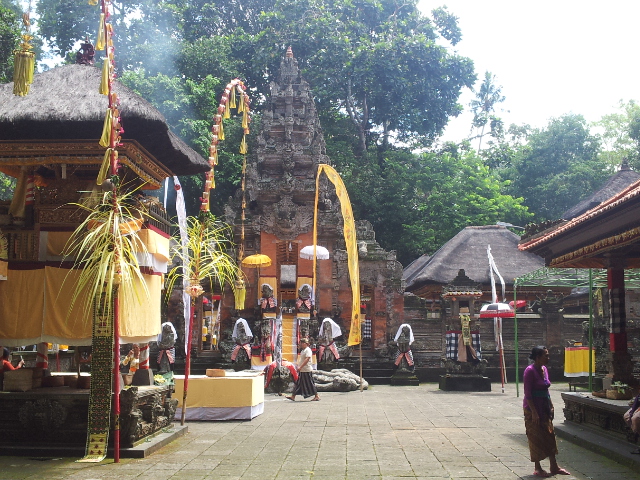
There are two notable pillars in Thai society: the Buddha and the King. 95% of Thais are Buddhist, and the King is also revered. Wherever you go, there are Buddha statues and portraits of the Thai King.
There are draconian laws against being outwardly critical of the King, but the majority of Thais have a true love and respect for the King, who is often talked of in demi-god terms. Understand that the Thai King is the longest serving living monarch in the world, and has been a constant in Thais’ lives throughout a politically unstable environment of 15 coups and 27 prime ministers, as well as a major economic transformation from an agricultural to an industrialised country in the last half century. The King has occasionally intervened in the political sphere, so he is not a neutral bystander, but he has largely overseen some impressive economic growth, as well as a few crises.
Thai buddhist monks are a common sight wherever you go, because they survive solely on what is given to them by the people. Their day largely consists of meditation, then going out barefoot begging for breakfast from the local community, a few domestic chores, more meditation, the remains of the food for lunch then no food allowed until the following breakfast, some schooling in the afternoon and more meditation in the evening. What is impressive is that the majority of Thai men (and some women) become Thai monks for a period (normally from 3 months to a year as young adults), much like military service in other countries. It is not compulsory but it is considered important to have served time as a monk when it comes to marriage and positions of authority. Some Thais go on to remain monks all their lives, but for the majority it is a rite of passage as a young adult. Perhaps because is it so widely pursued, it is not without issues. It has been reported that almost half Thai monks are overweight, because the community provide them with rich food (with good intentions of course) and the monks’ day is largely one of inactivity. Plus it is not uncommon to see them now with mobile phones or Ipads, despite the ideology of no possessions and a simple life. Nonetheless, in my simplistic view, it would appear to be a fruitful experience to go through such a humble, conditioning process as a young adult.
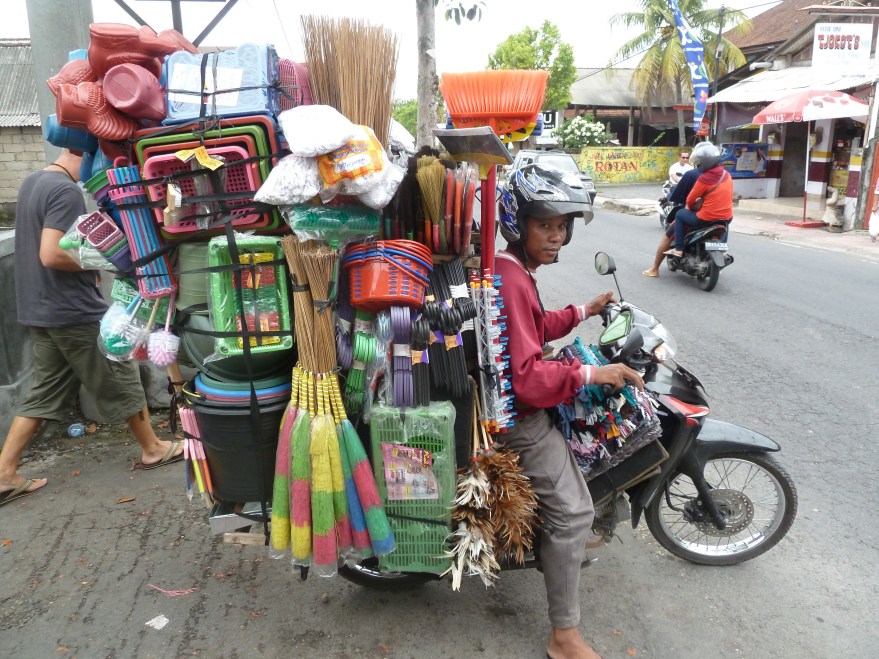
Thailand stands out in this part of Asia because it was not colonised like the other neighbouring countries. The result is a culture that is less diluted, with one notable barrier to entry being the unique language and script. In Phitsanulok, the least tourist-trodden of our destinations, we generally had to get by on gestures and signs, as zero English was spoken. Thais embrace ‘fun’ living and this has been a key factor in drawing in tourists, extending to an ‘encouraged’ sex industry (for revenues) and some of the party capitals of Asia having grown here. Massage is also everywhere and the cost of living cheap. Unsurprisingly therefore, it has become a favourite backpacker destination. So how about for a ‘flashpacker’ with family in tow?
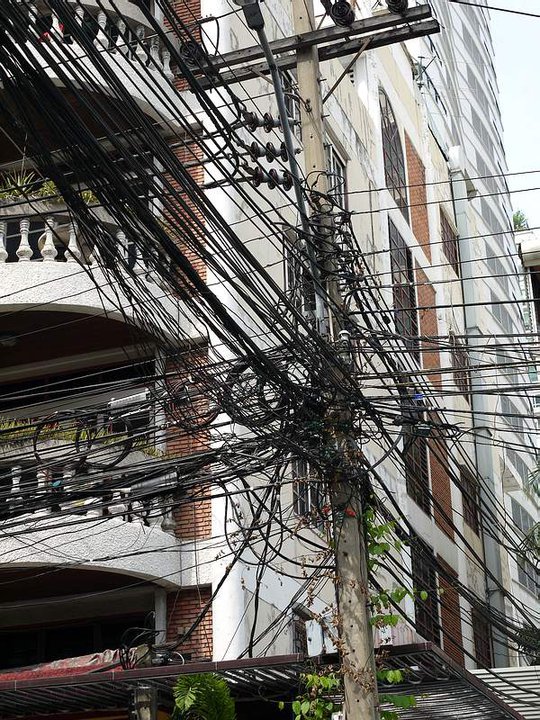
Well, Thailand didn’t measure up to Singapore, Malaysia and Bali. In Kuala Lumpur I was amazed at how friendly and laid back people were for a capital city, Bangkok was all round more ‘edgey’. In Bali journeys around the island were a sensory overload of both interest and beauty, whereas land travel through Thailand was more underwhelming. Overall, I found Thailand to be more scruffy than the other countries on my route so far (accepting it is a developing nation), and this would apply to both the natural and the man-made. Thailand was one of the fastest growing countries in the world in the 1980s and 90s but there have been some growing pains with such a rapid transformation. There is more of a crime issue than in the other countries I have so far visited and, to my eye, aesthetics have been rather overlooked in the country’s rapid development. One image that will remain in my mind is the jungle of telephone wires everywhere we went (see images below). A lot of these cables are put up illegally at night, until there are so many that some of the telephone poles start to lean over. I can only imagine that the spaghetti wiring is not considered an eyesore in Thailand, and maybe it isn’t to other travellers. But travel is a personal thing, and I found this to be a dominant ‘blot on the landscape’.
I enjoyed the food, the cheap living and the glorious weather, and we met some very friendly Thais. But overall there was more effort required to gauge people and their motivations than in Singapore, Bali and Malaysia, and in Bangkok we certainly came across a few unpleasant types. Honestly, I wouldn’t have expected otherwise, but having been spoiled with collective warmth and friendliness in those other countries, Thailand didn’t quite measure up.
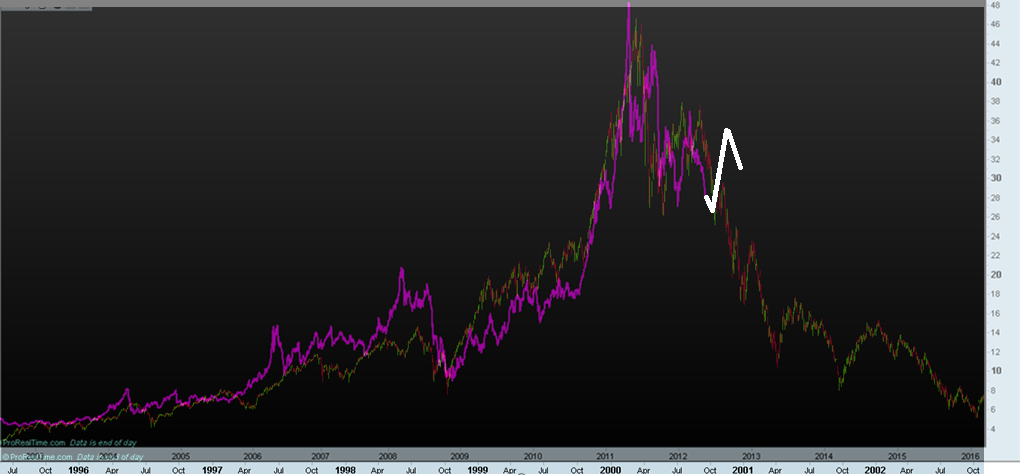
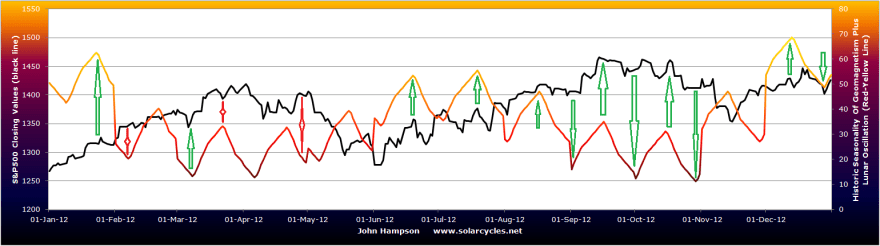
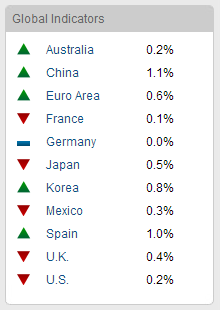
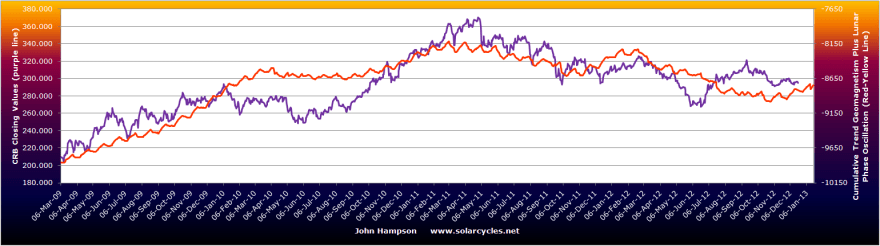
The Thai SET stock index was one of the best performers of 2012: the 5th best returner in the world. However it is now one of the more expensive in terms of p/e valuation at around 18. Thailand reached one of the cheapest ever valuations in the wake of the Asian financial crisis of the late 1990s, reaching a p/e of just 3, shown here:

Source: Cnx Translation
This has since been beaten by Greece in the recent Euro crisis, which got to p/e sub 2. The Thai SET history shows that a brave purchase at such a cheap level would have been rewarded handsomely with time, and I believe Greece prove similar for those who took the plunge at the extreme (not I). At current p/e 18, I don’t want a holiday souvenir of a stake in the Thai SET. Instead I’ll settle for a few pictures below.
Long live…

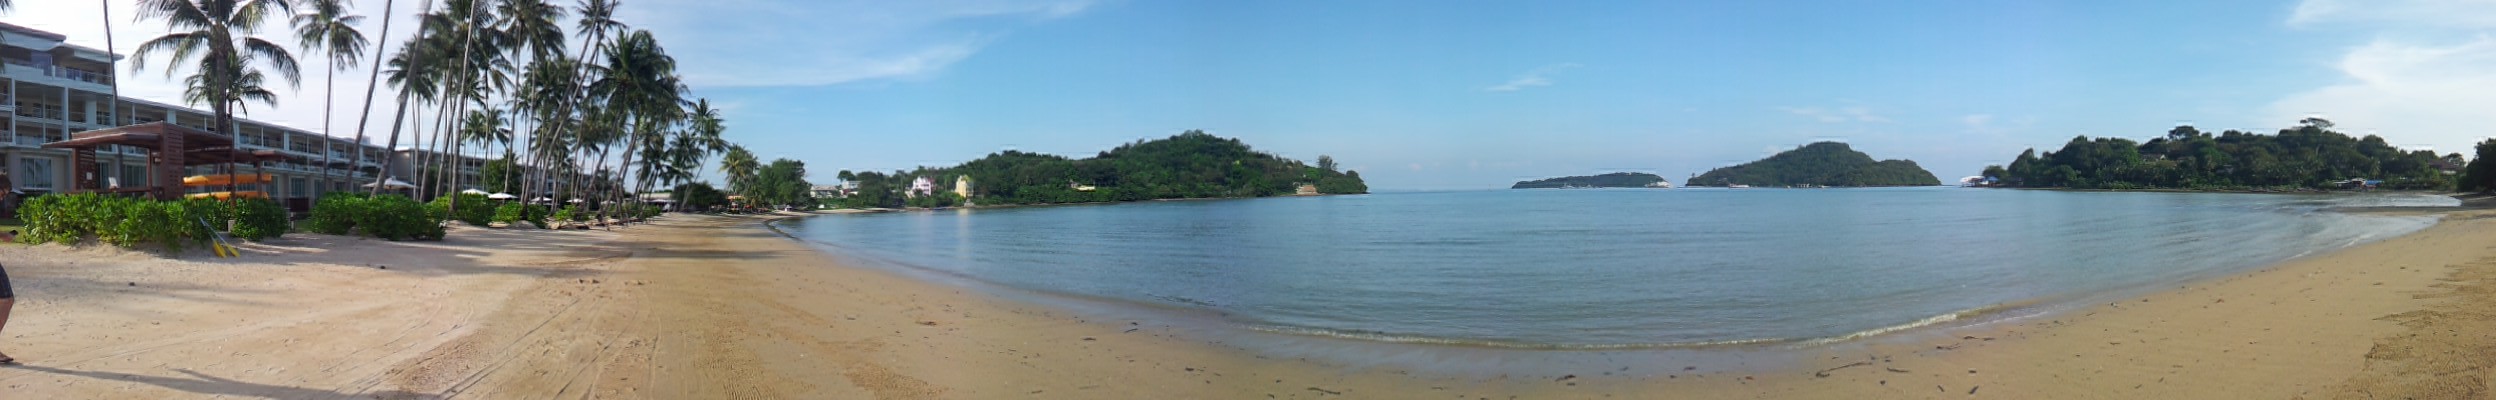
Cape Panwa, Phuket:
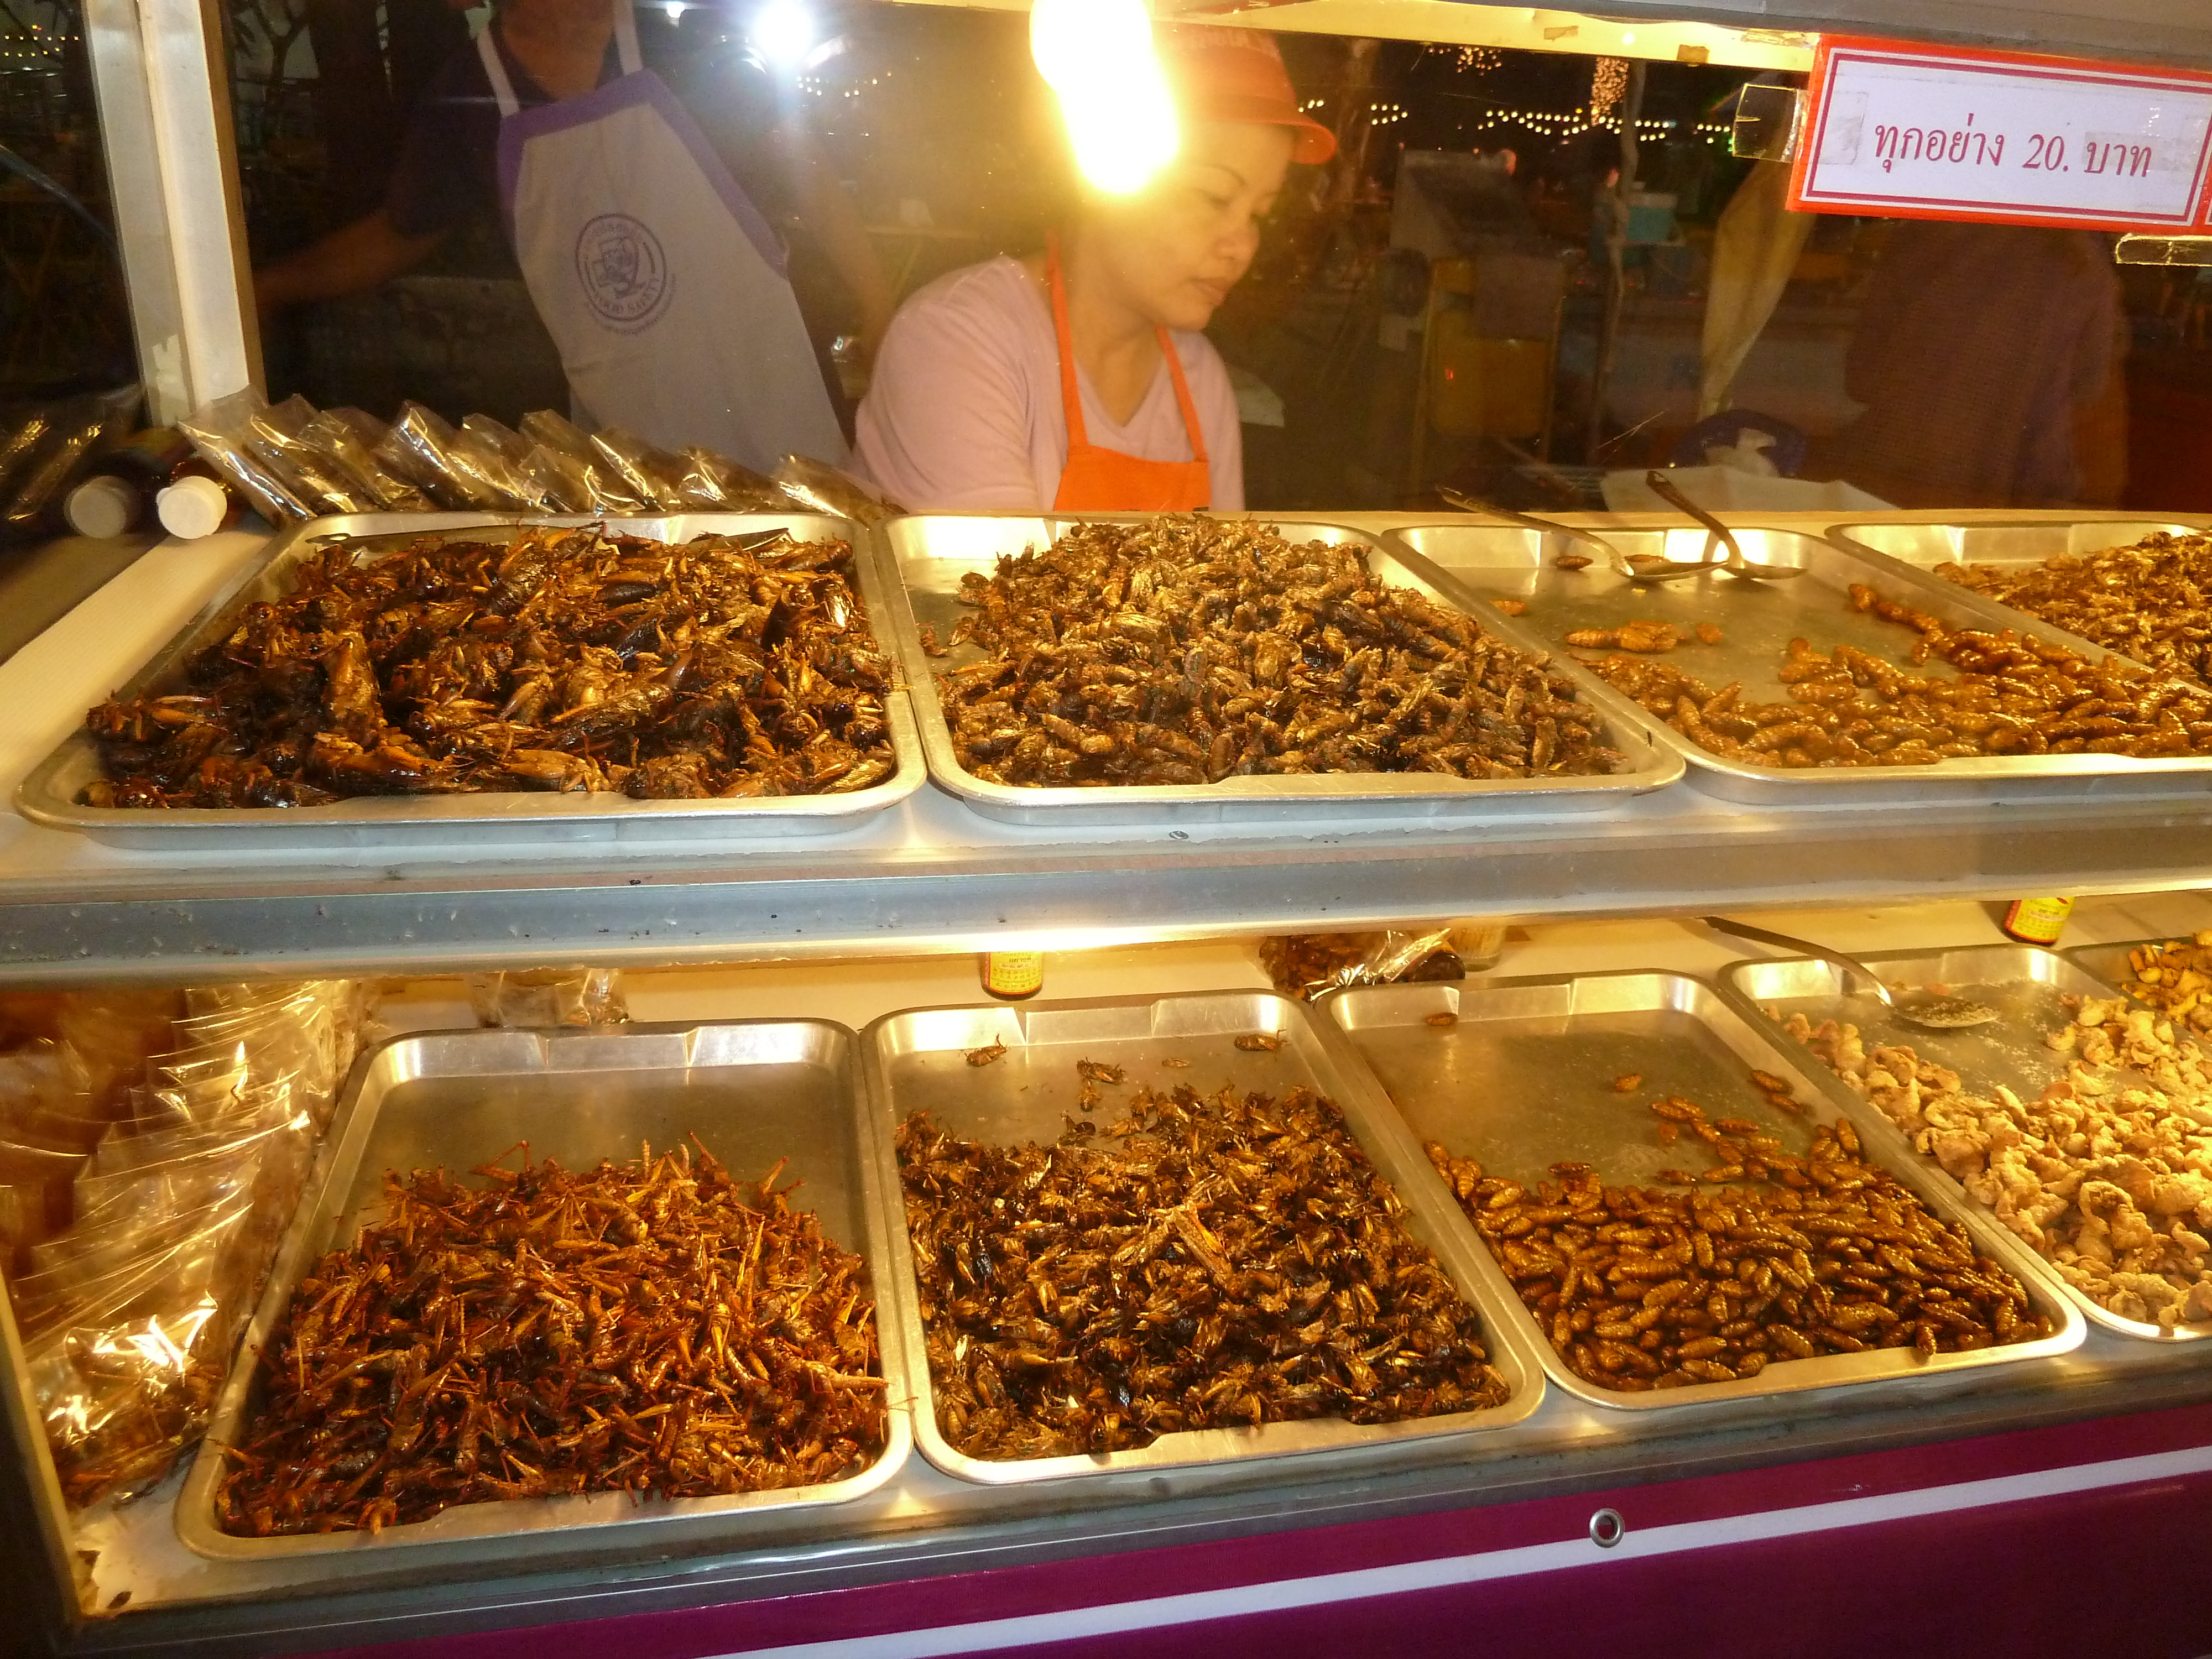
Insect snacks:
Monks on walkabout:

Those wires…