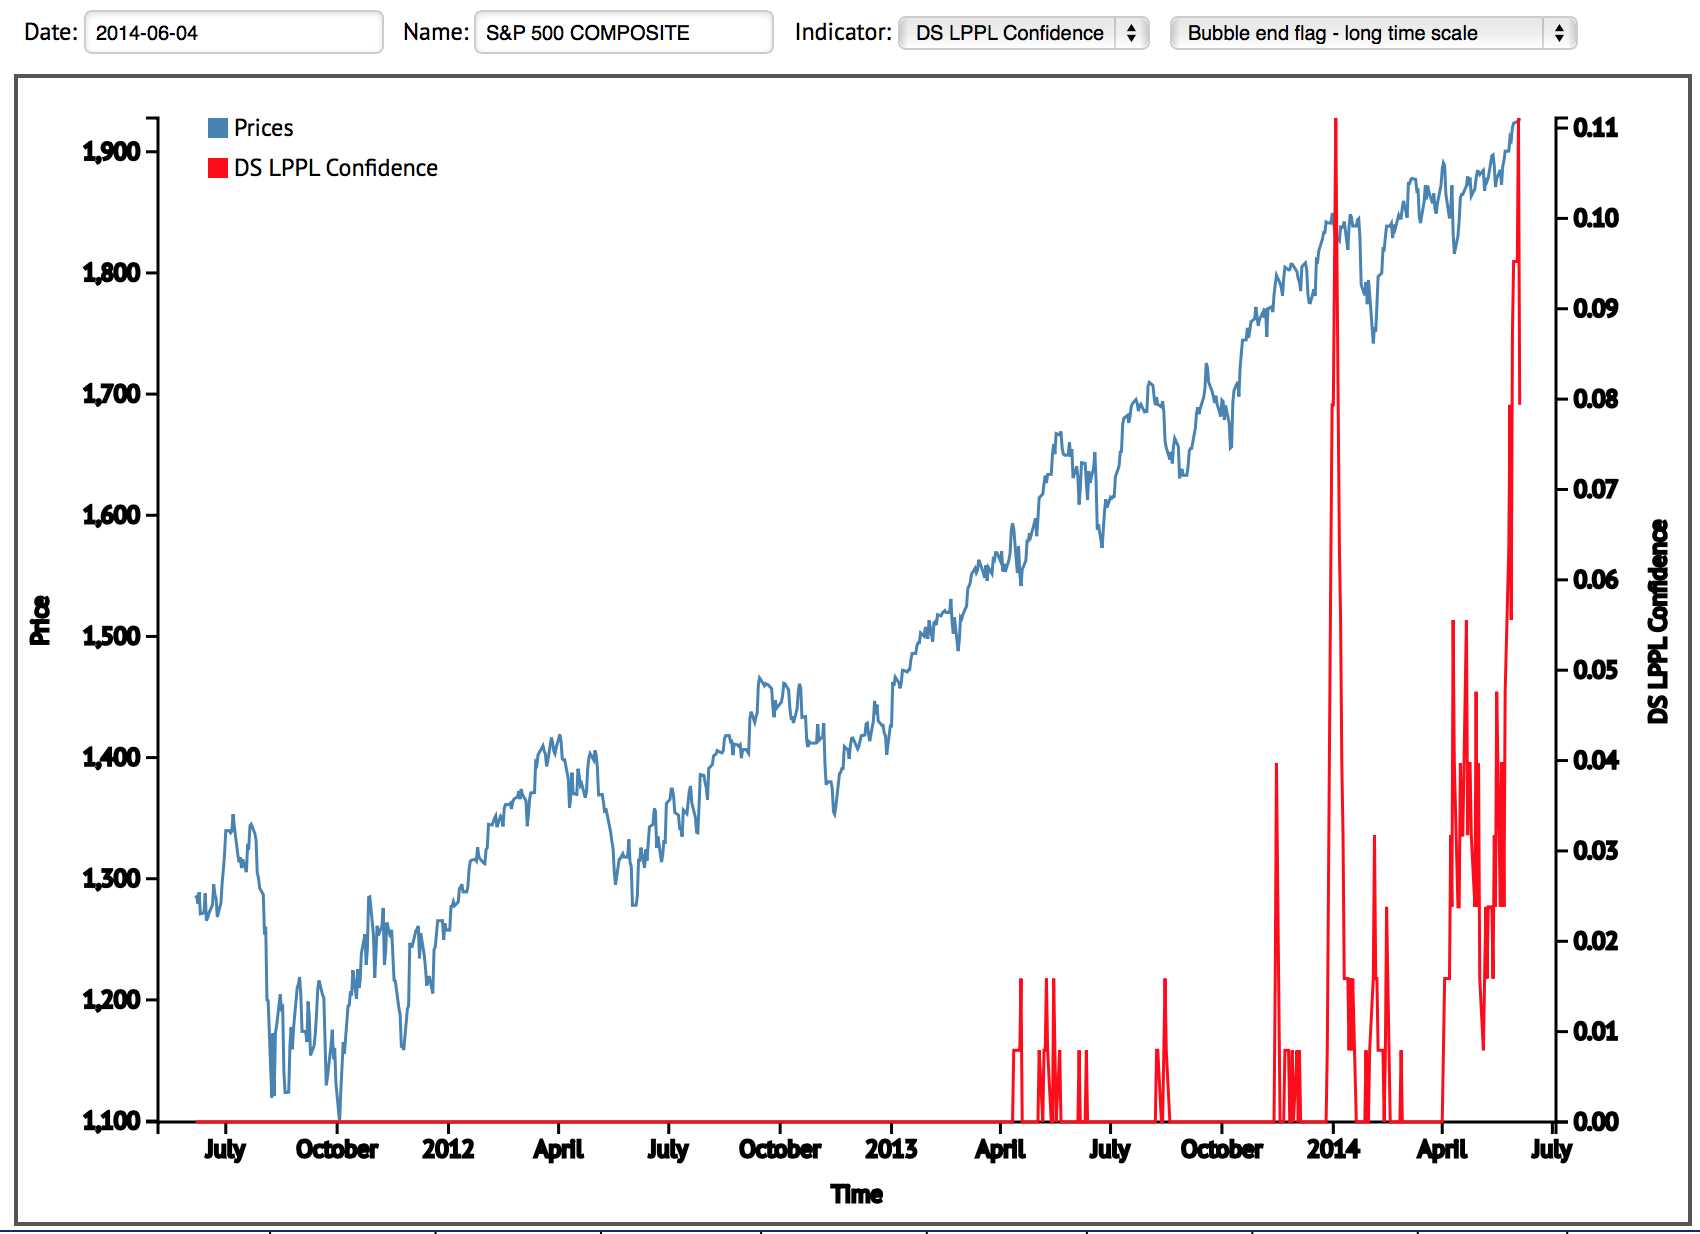
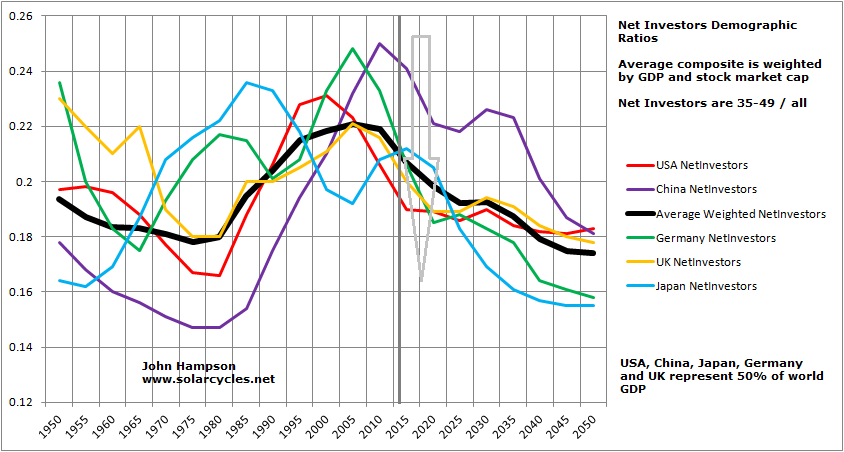
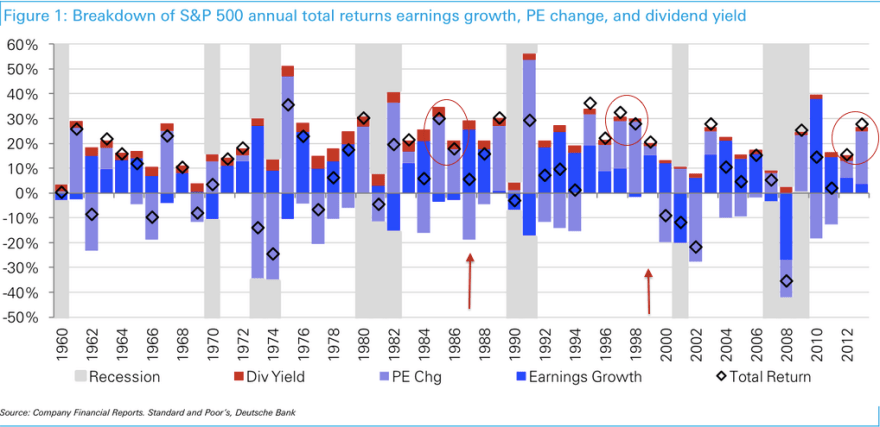
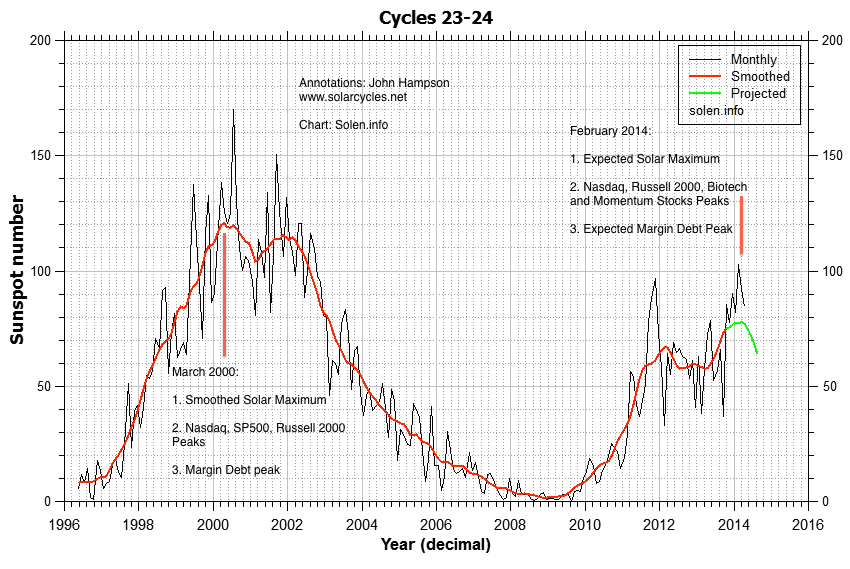
US equities have diverged from fundamentals, earnings and smart money flows for around 2 years now. In all three regards this echoes the couple of years prior to the 2000 peak. The run-up to steep valuations achieved by sharp increase in leverage also matches the run into 2000, and collectively these all indicate a speculative mania which has been historically induced into a solar maximum. Solar cycle 23 maximum = 2000, solar cycle 24 maximum = 2014.
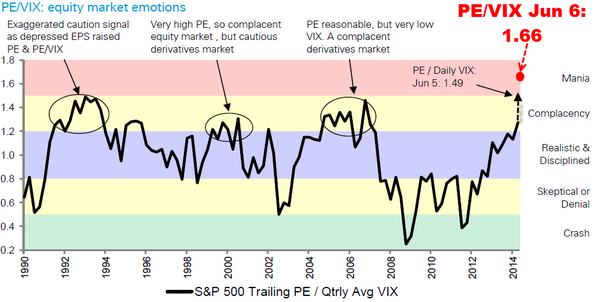
 Source: Ed Yardeni
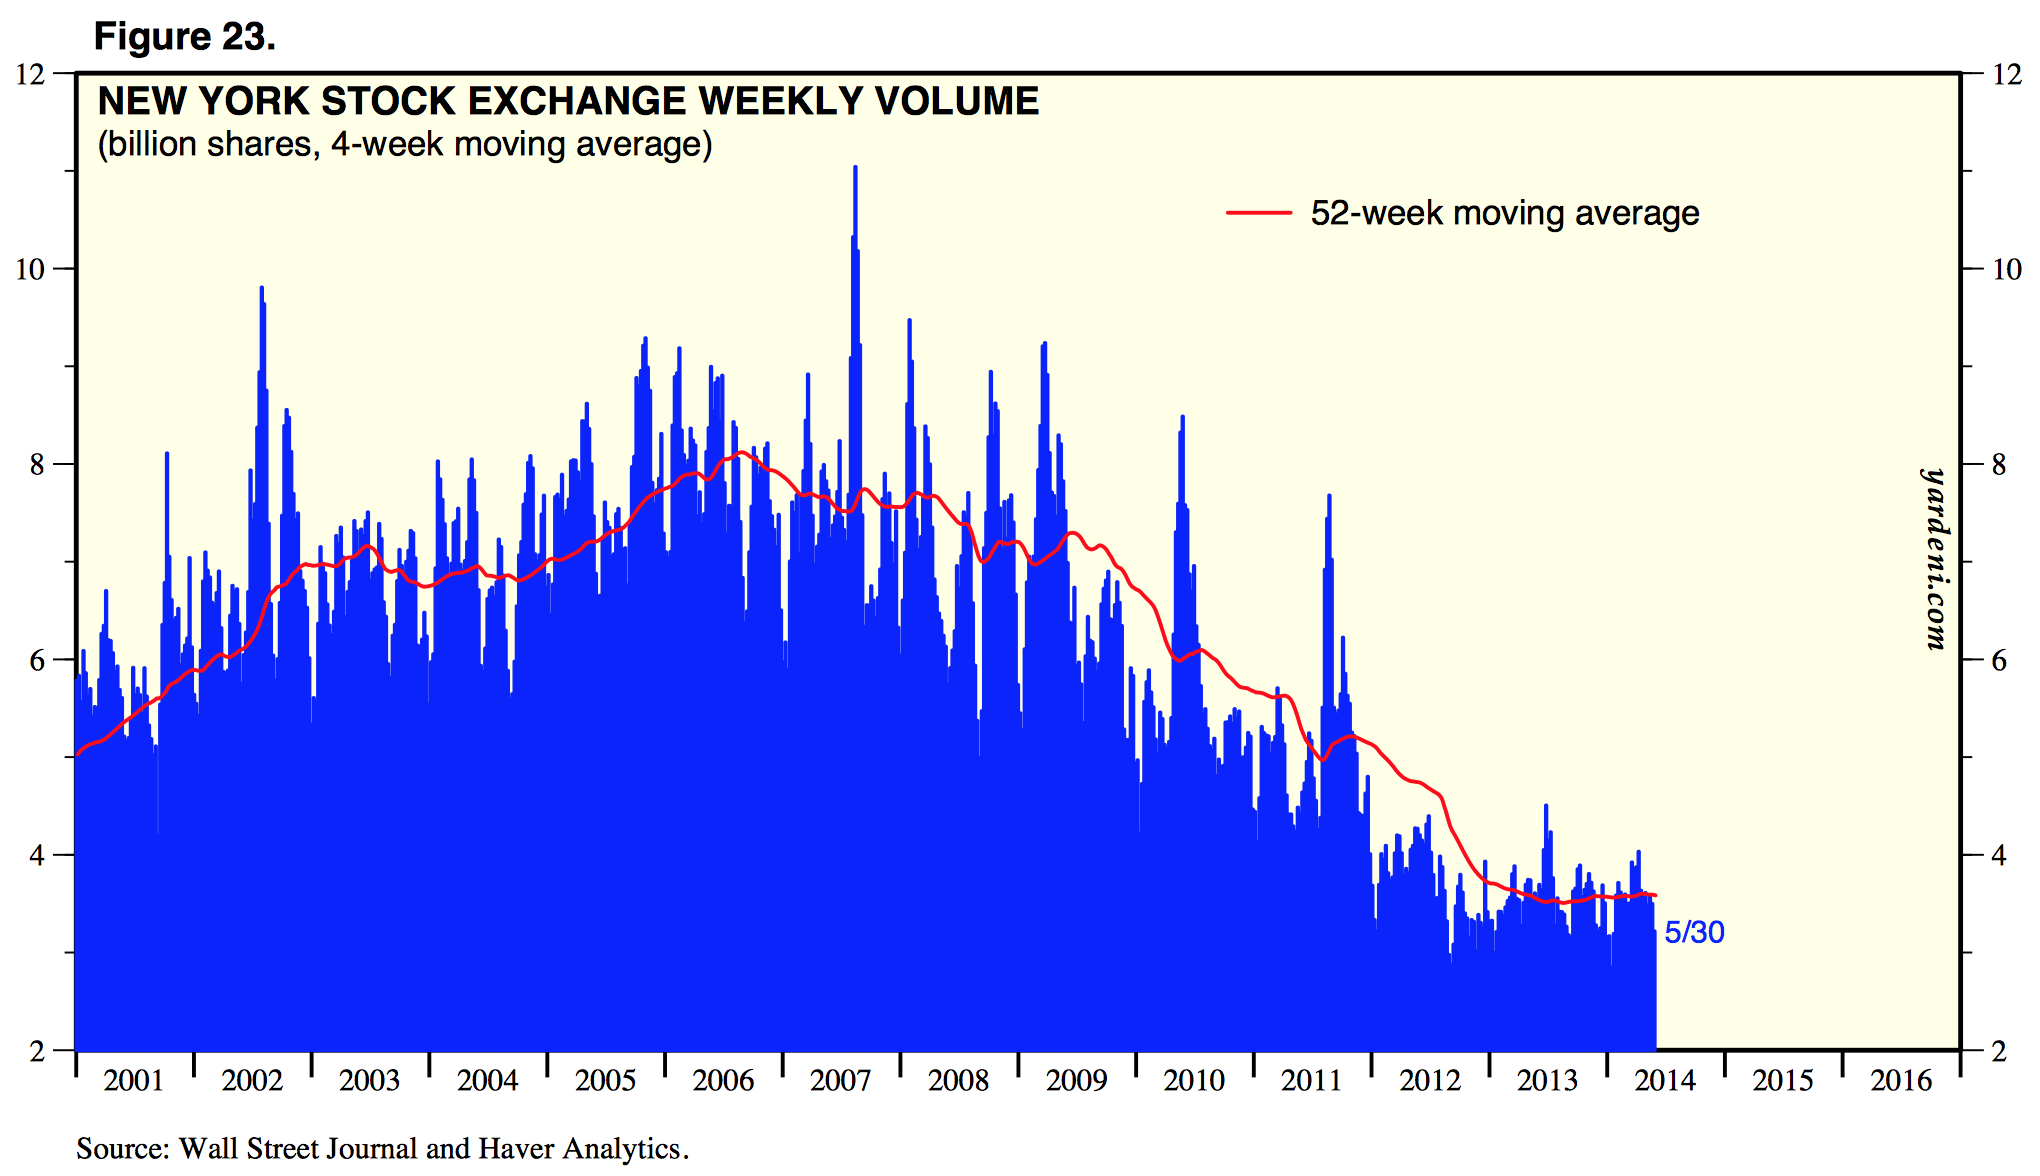
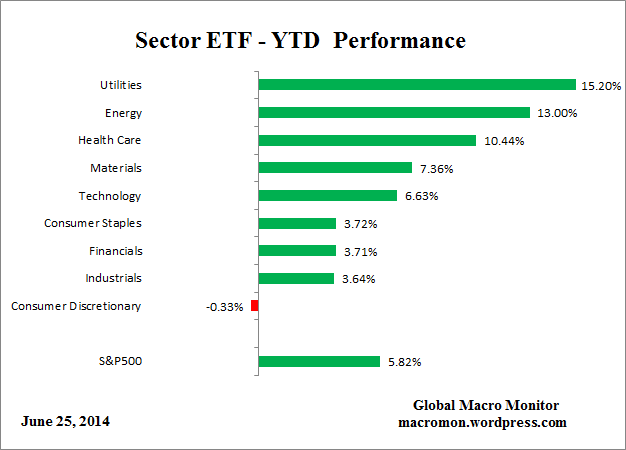
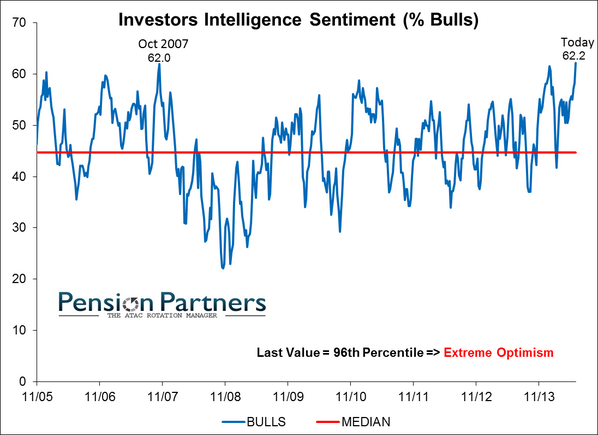
Source: Fat-Pitch

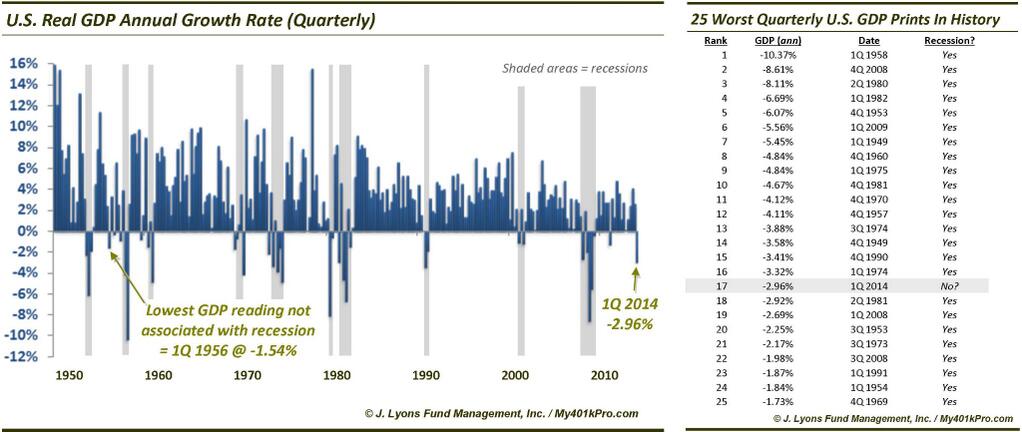
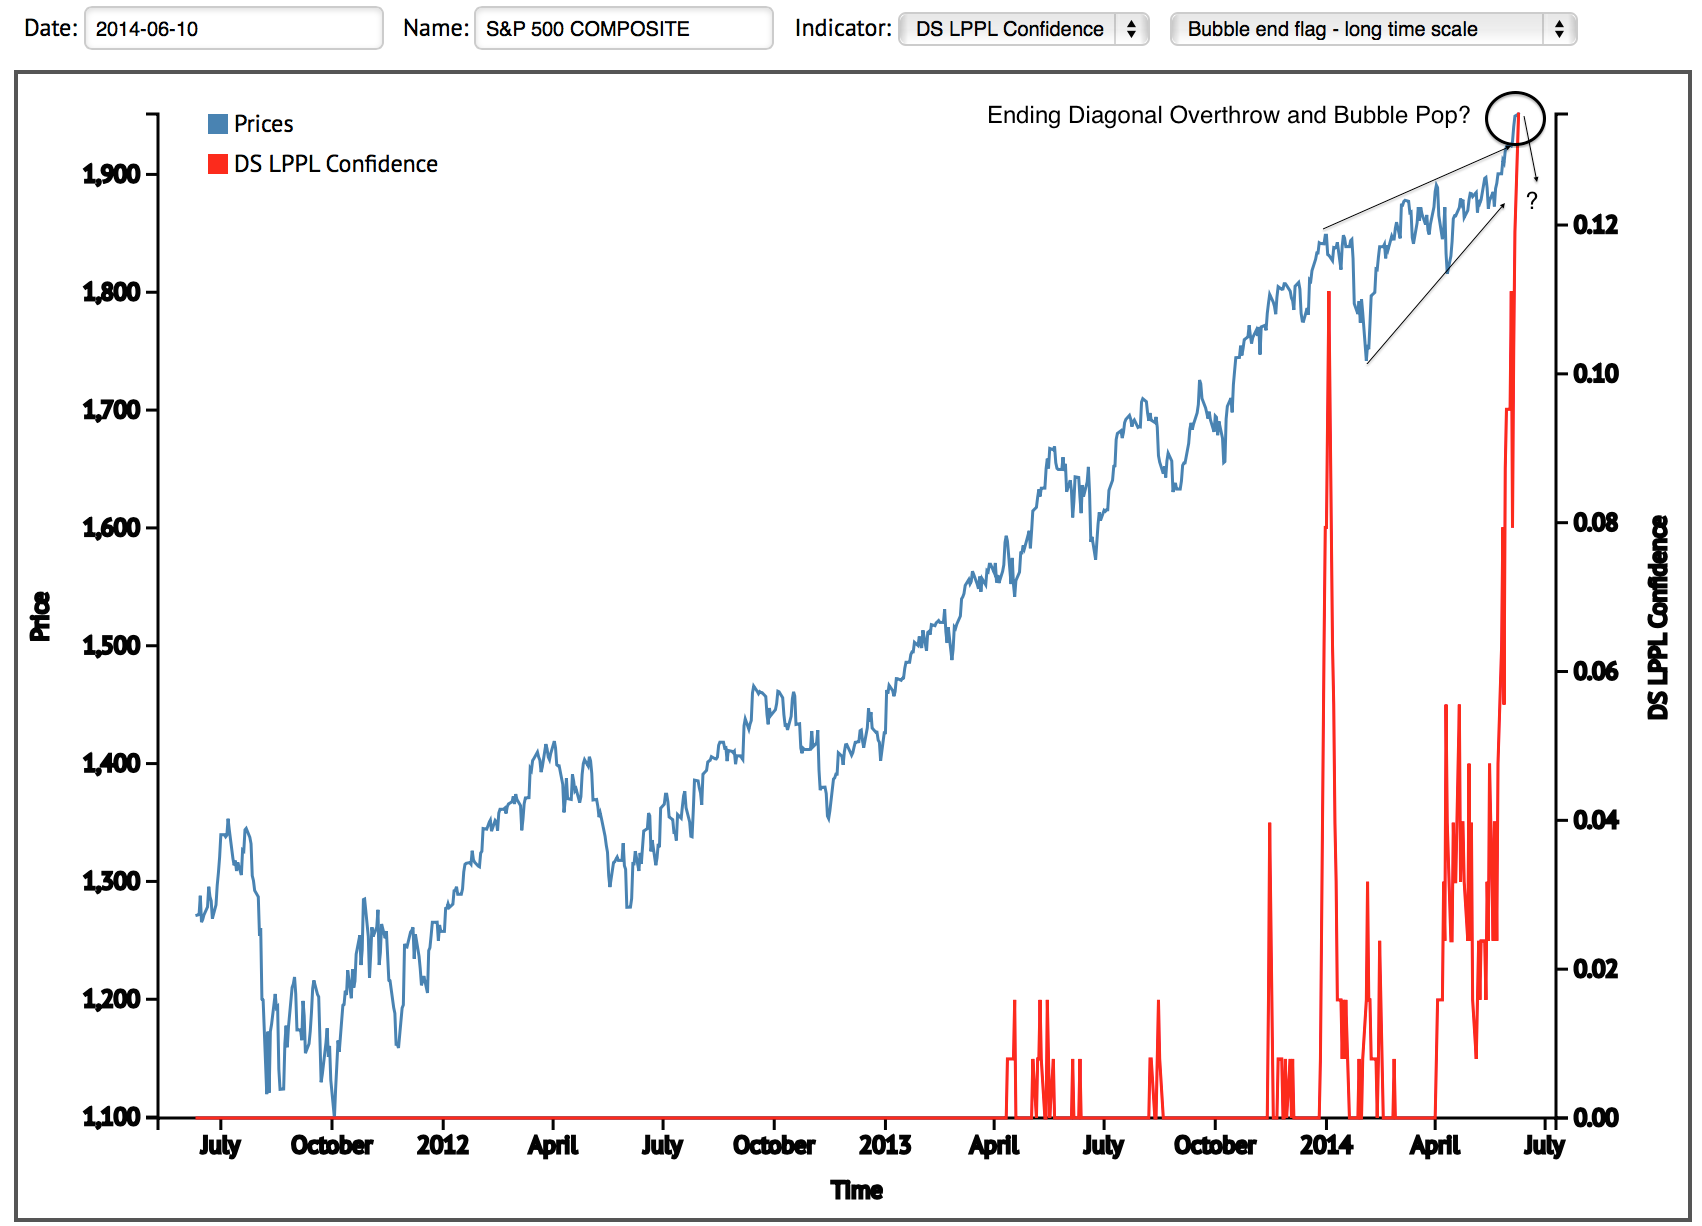
Source: DShort
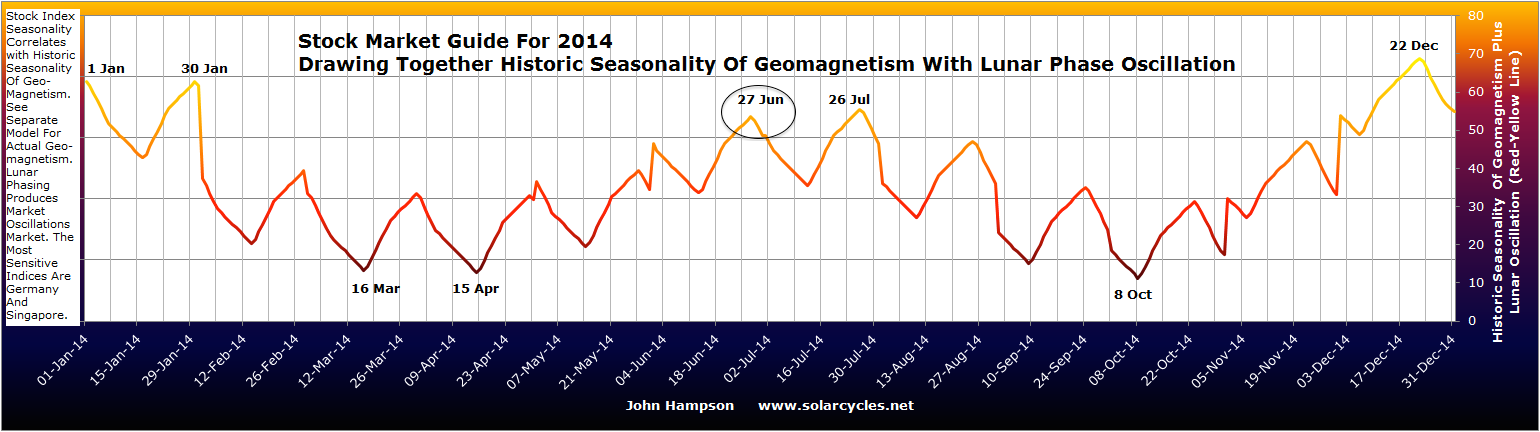
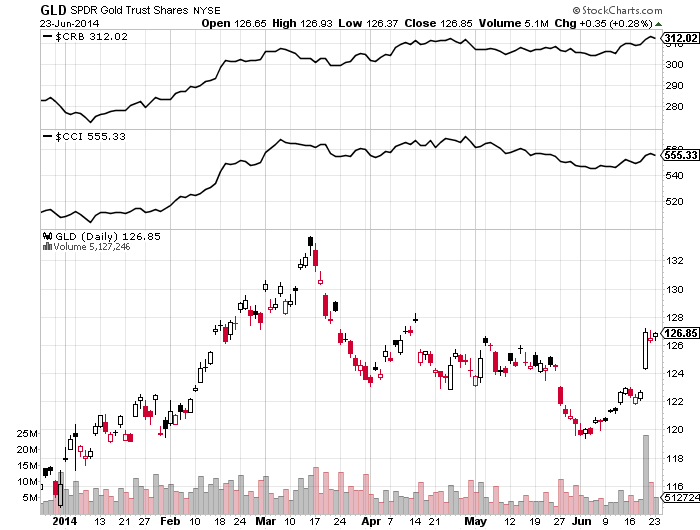
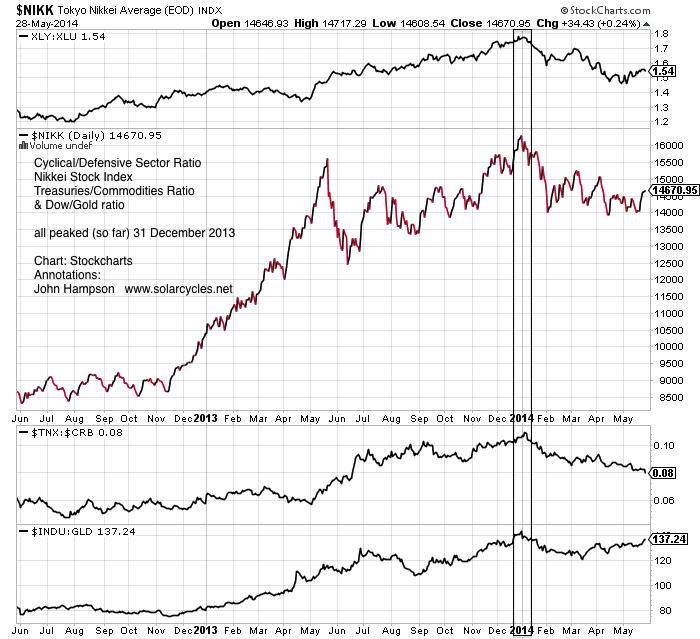
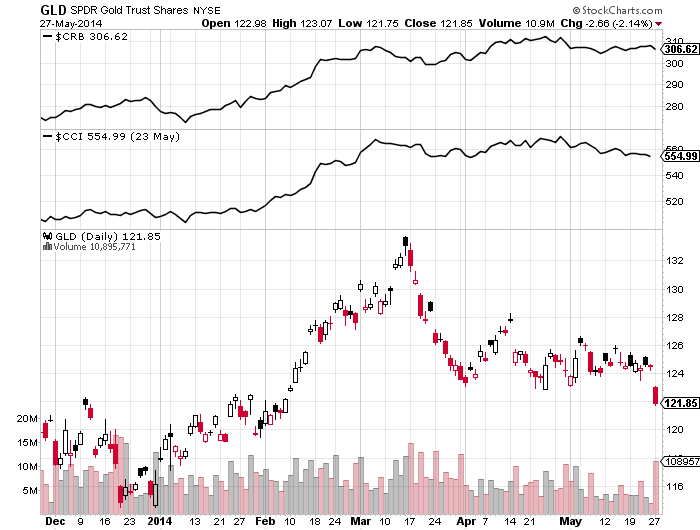
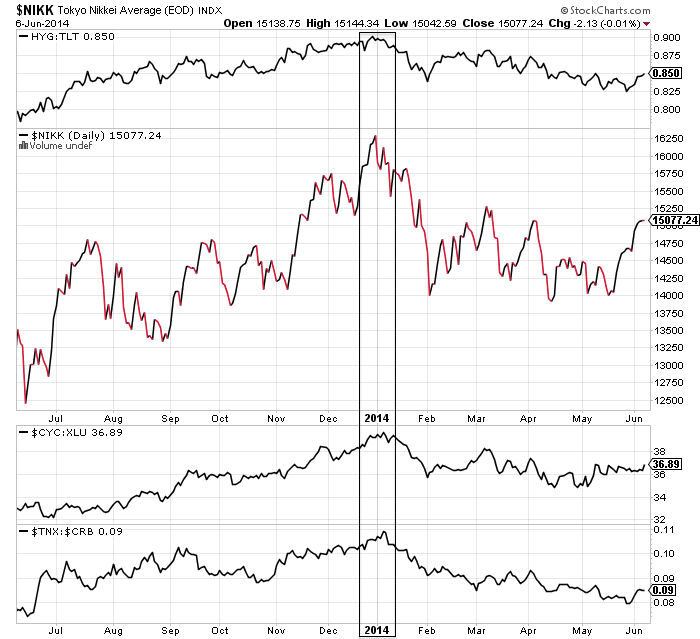
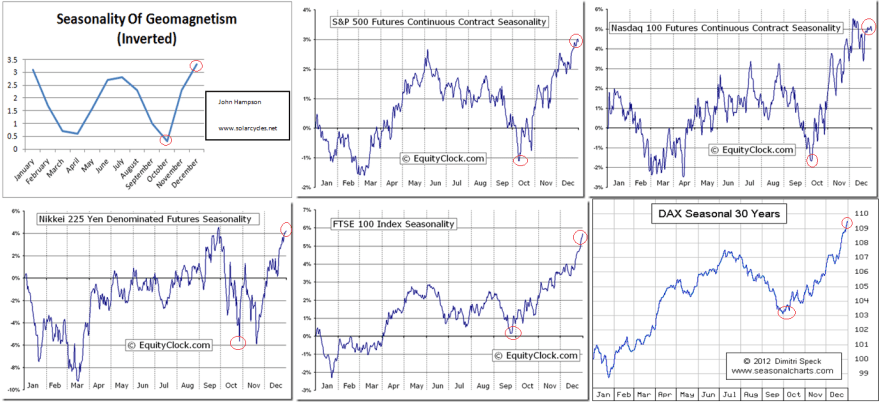
At the turn of the year into 2014, I believe we began the first phase of the topping process. Nikkei peaked, Bitcoin peaked, money switched into defensives in a trend that continues, with treasuries the best performing asset and utilities the best performing sector of 2014 thus far. Such a turn-of-the-year peak fits with a cluster from history and and I believe reflects peak inverted geomagnetism: a seasonal optimism peak.
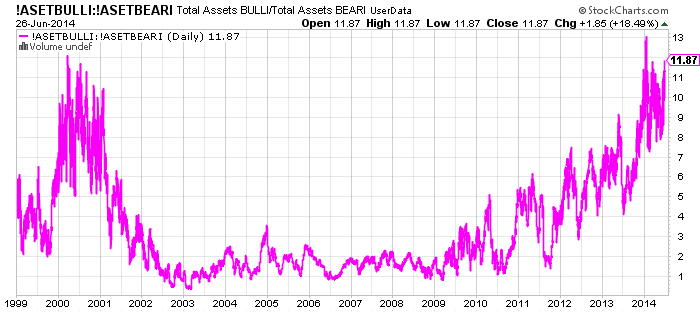
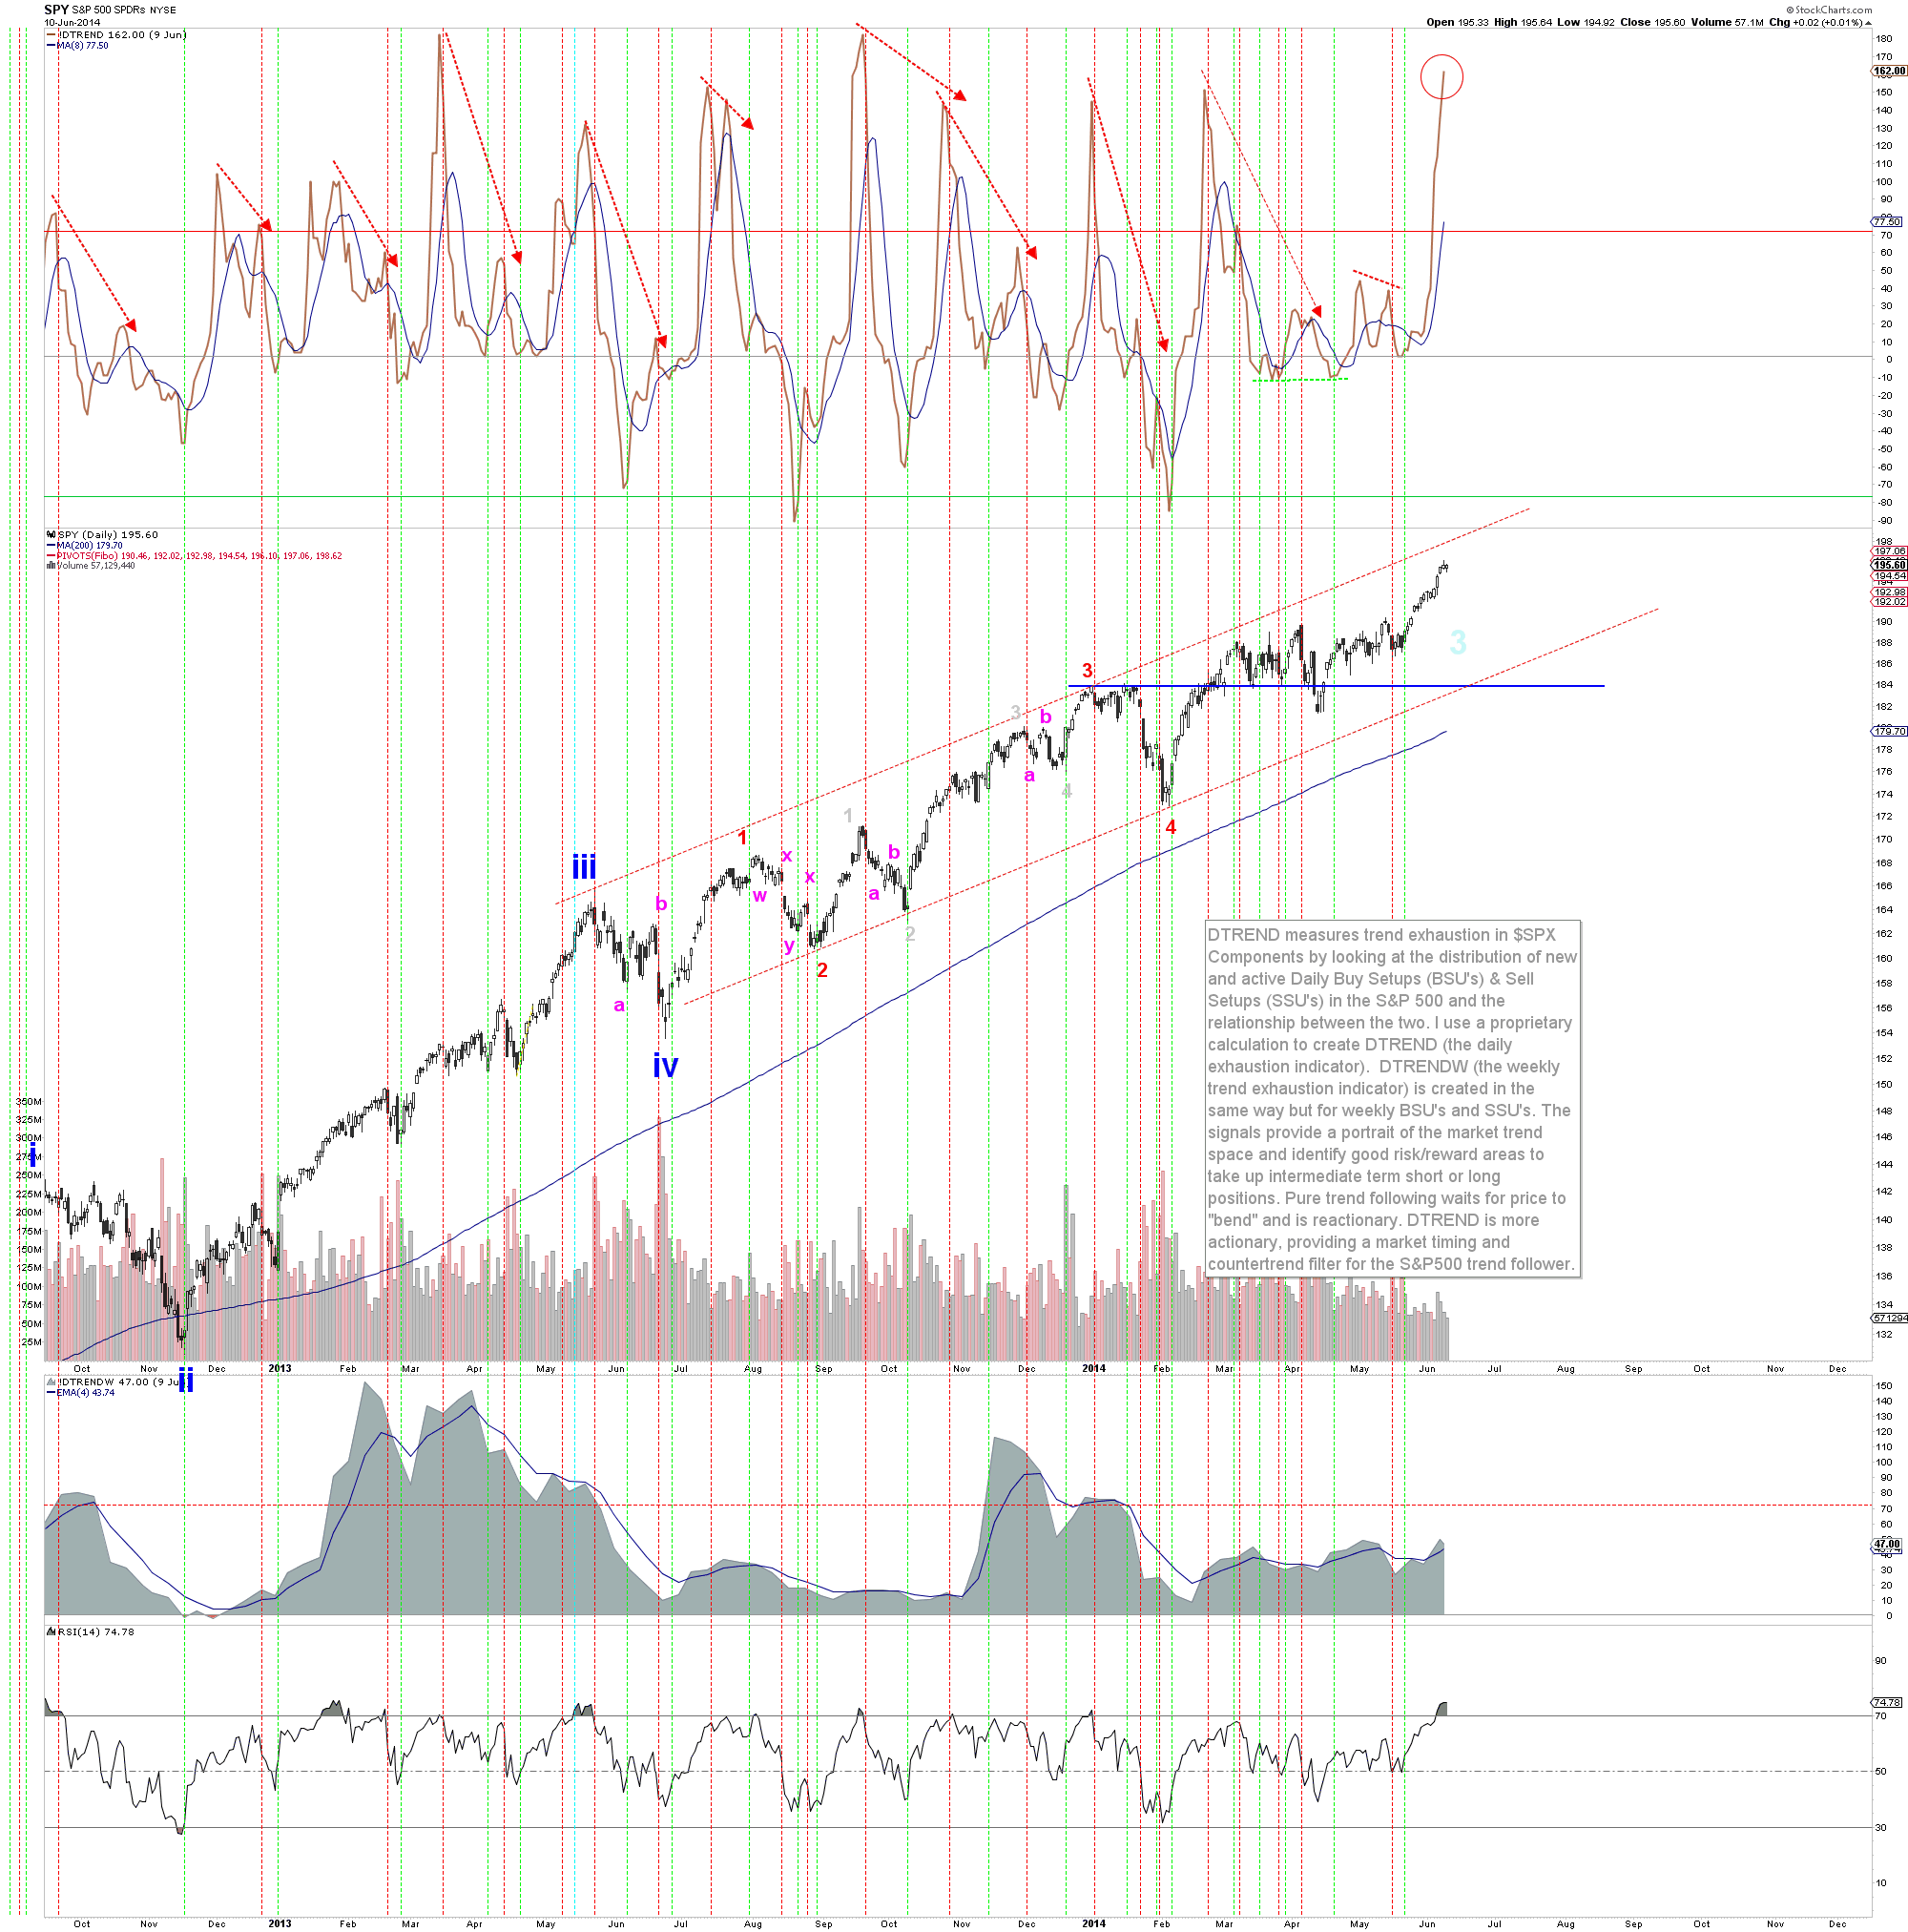
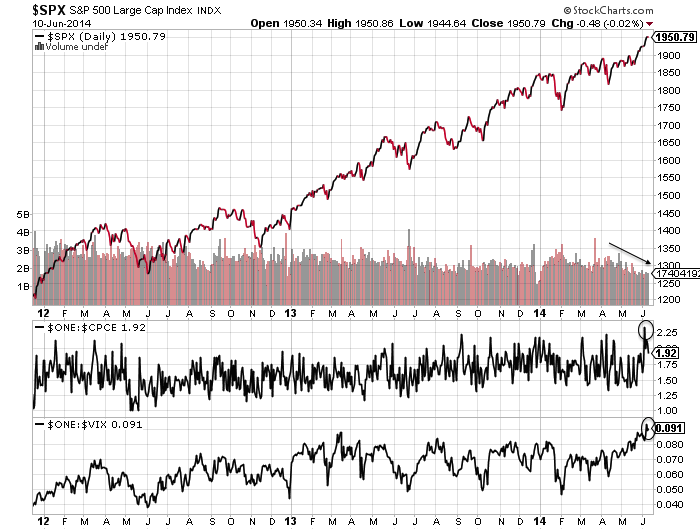
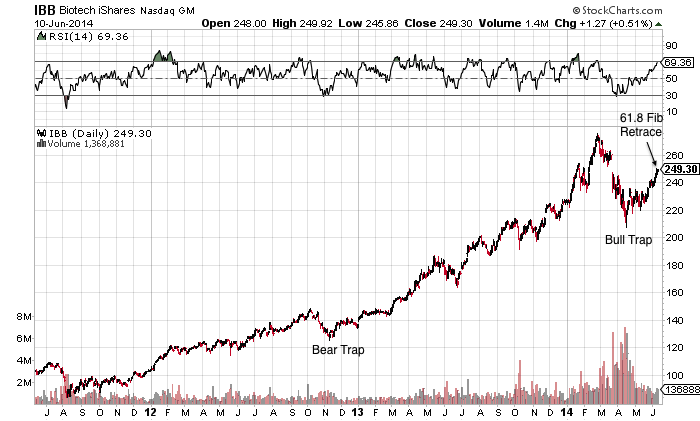
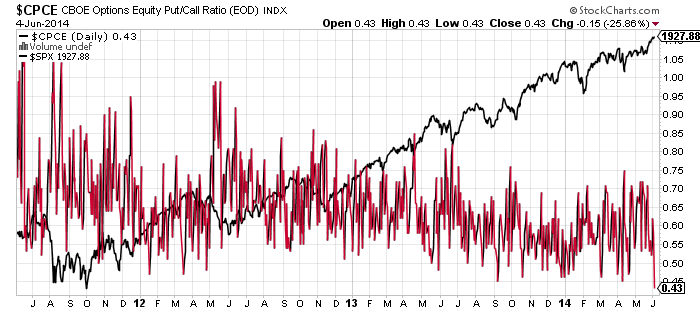
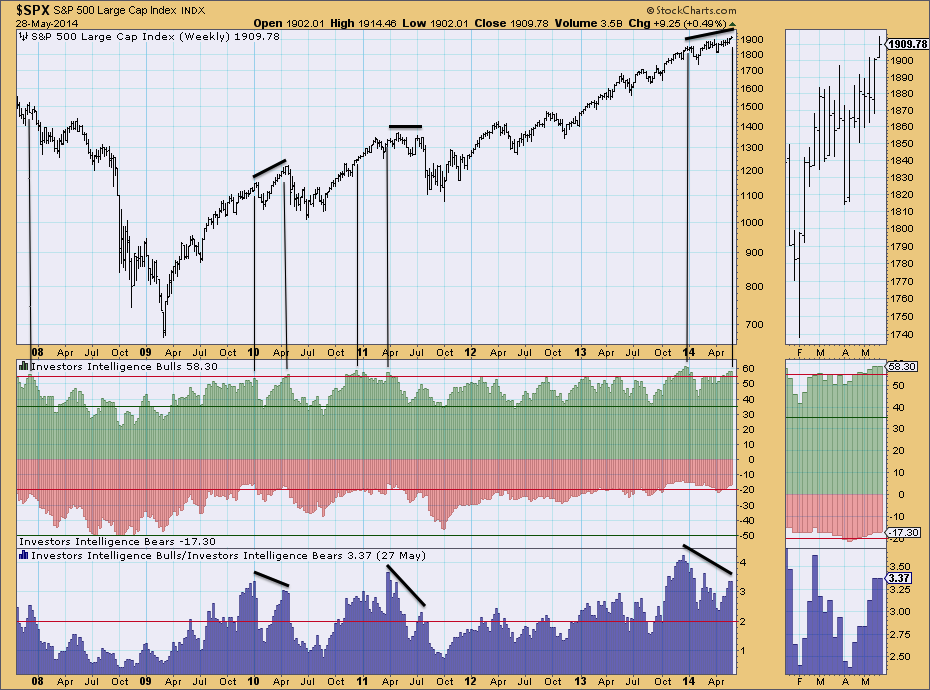
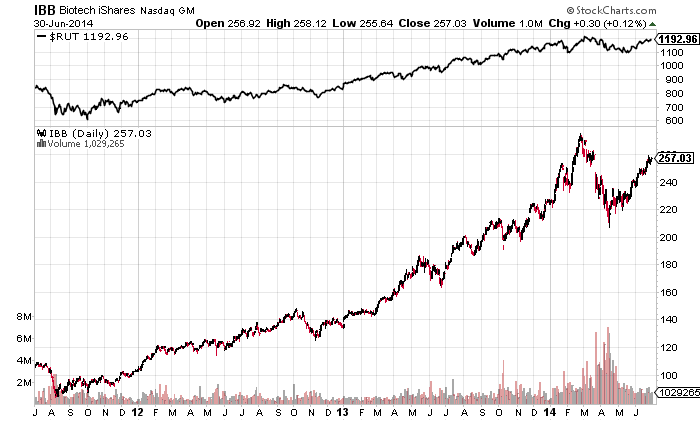
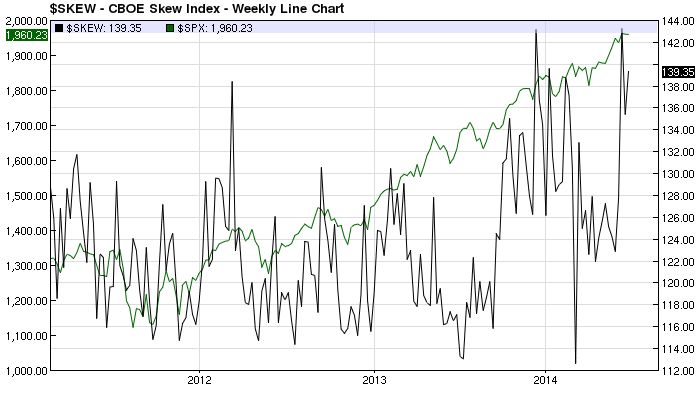
Source: Stockcharts
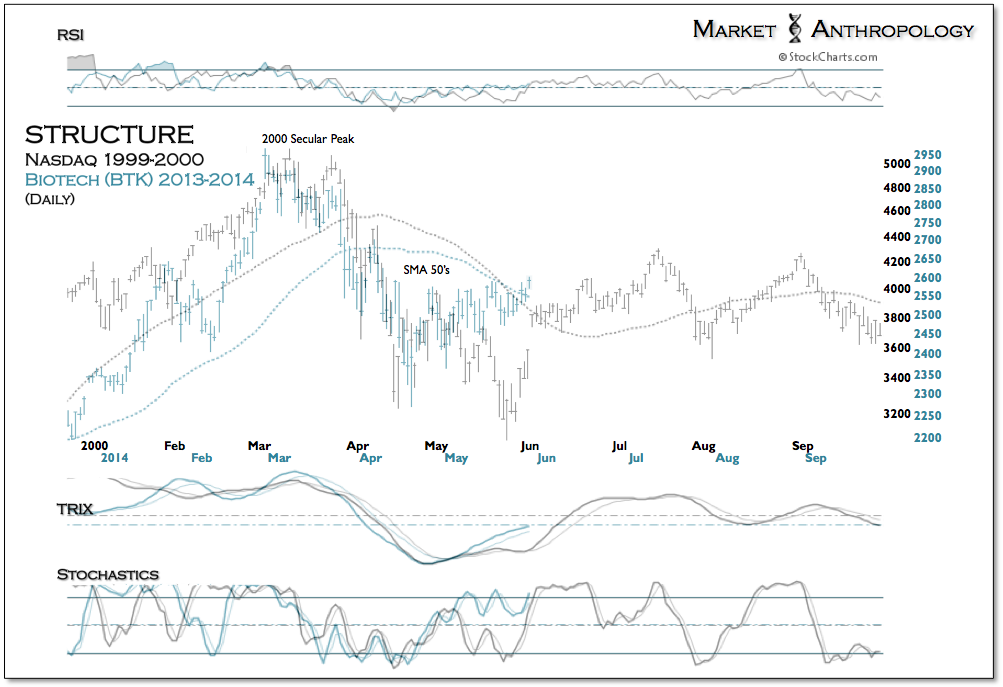
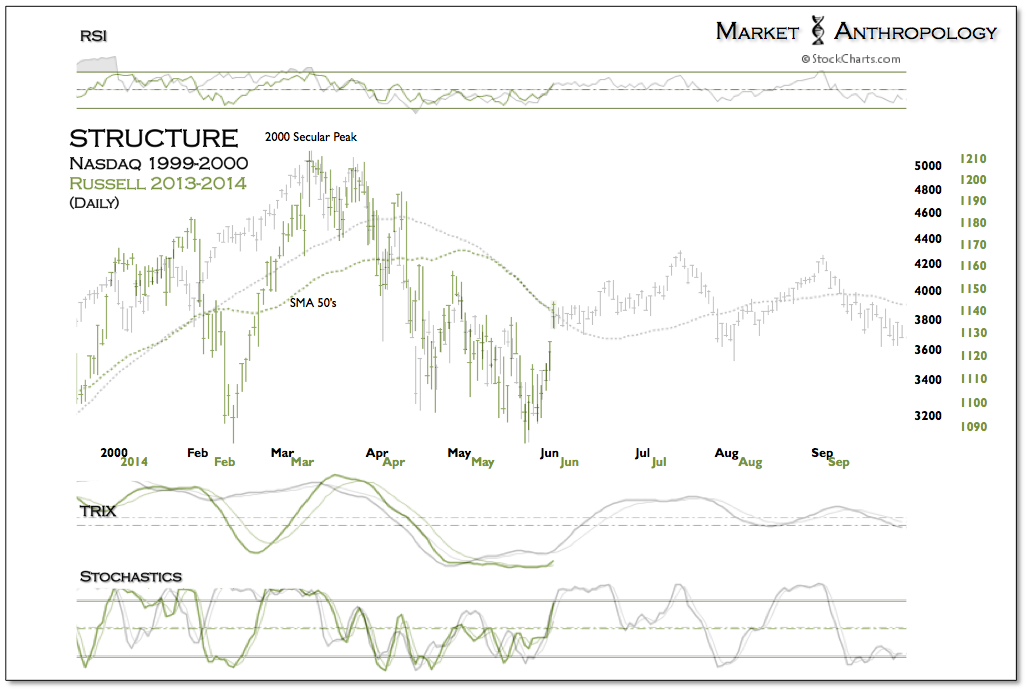
 Then at the turn of February into March I believe we saw the second phase of the topping process, with margin debt, Russell 2000, Biotech and momentum stocks all peaking along with the solar maximum. Such a neat confluence would echo March 2000 in all regards, and the technical price action has developed similarly since, as shown by the analogs below. If this is valid, then we should expect Biotech and R2K not to exceed their Feb-Mar peaks, and the solar maximum to wane. Like the dot-com stocks of 2000, small caps were bid up to p/es over 100 into Feb/Mar, and so by valuation, leverage, asset allocation ratios and price analog we saw a mirror of 2000; just the super-sized peak and public interest were lacking due to demographics.


Source: Market Anthropology
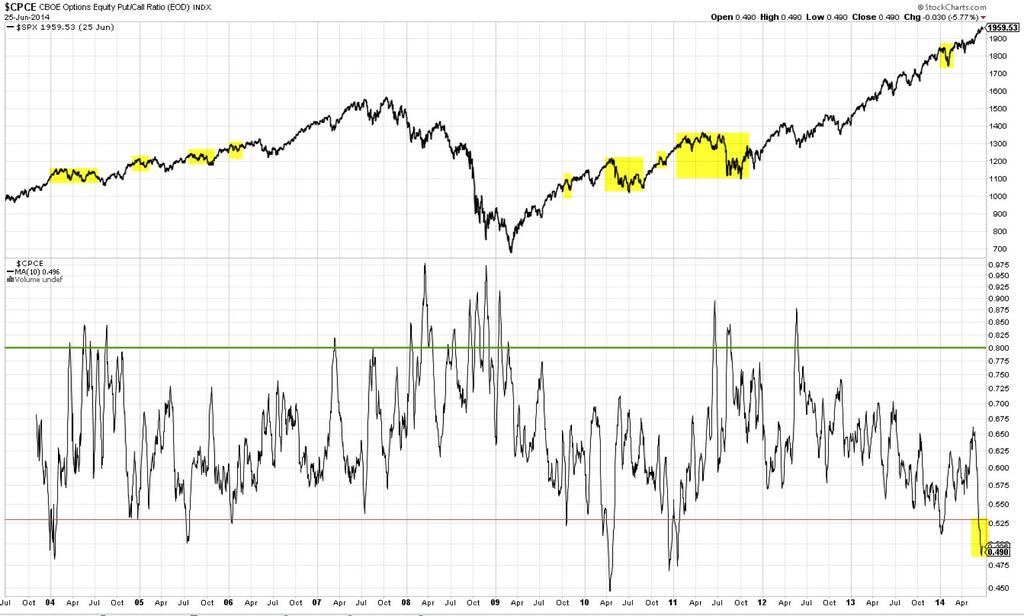
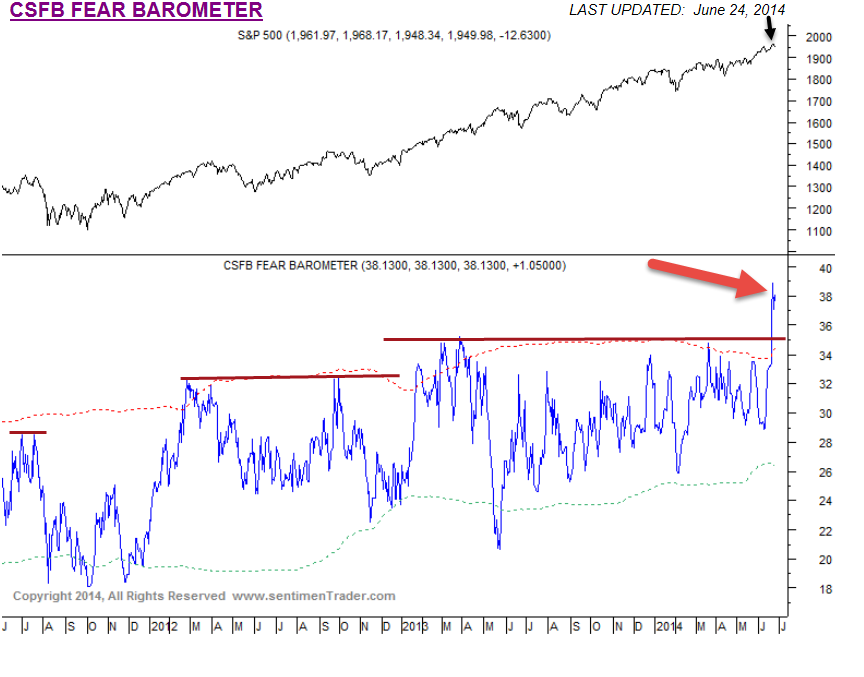
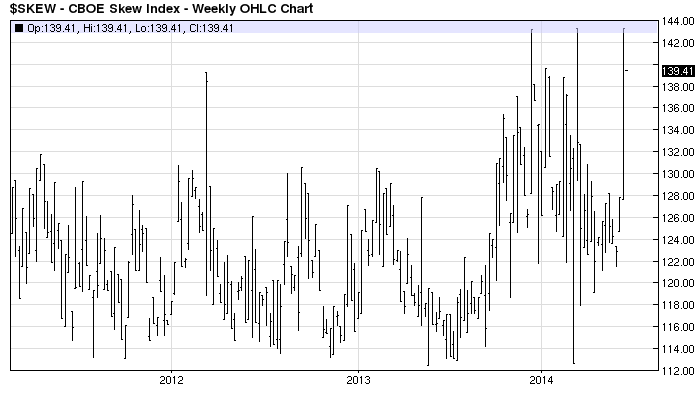
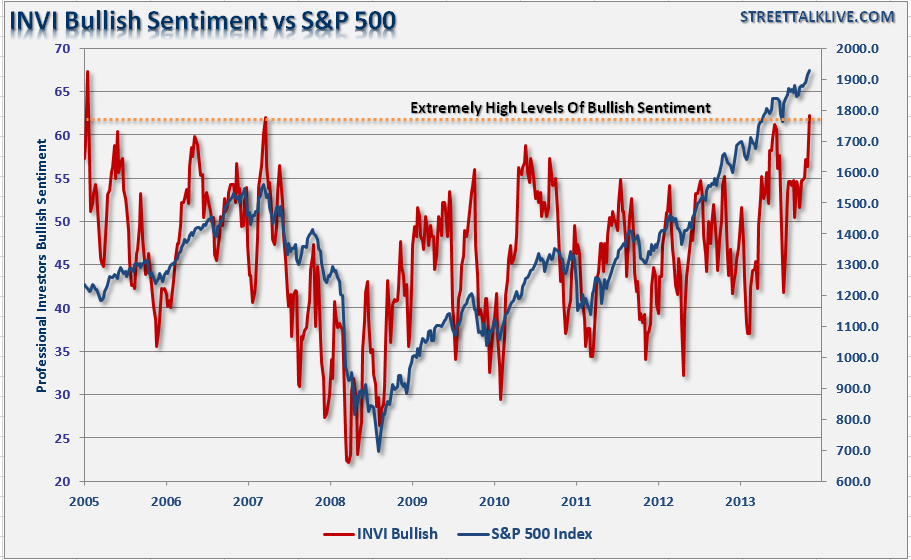
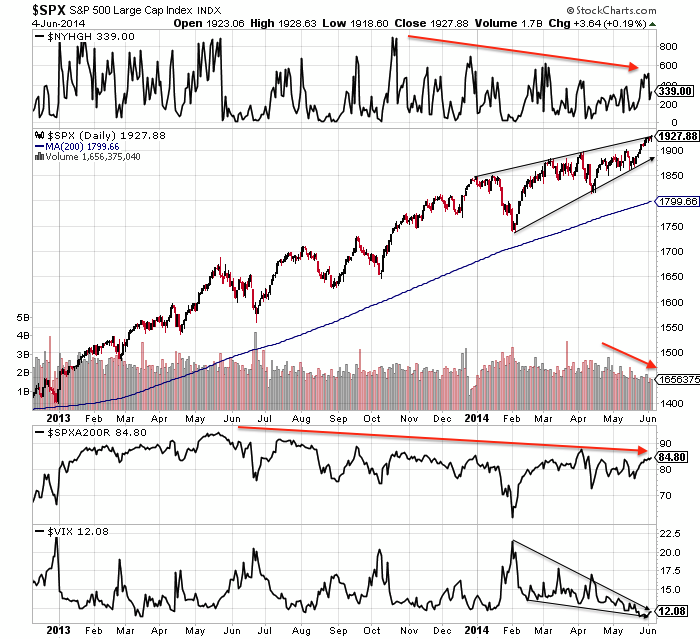
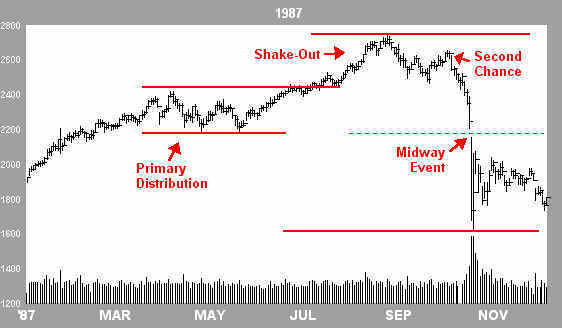
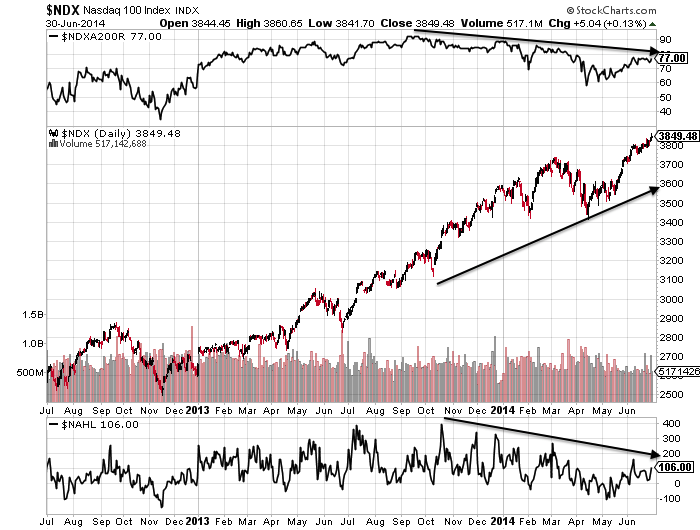
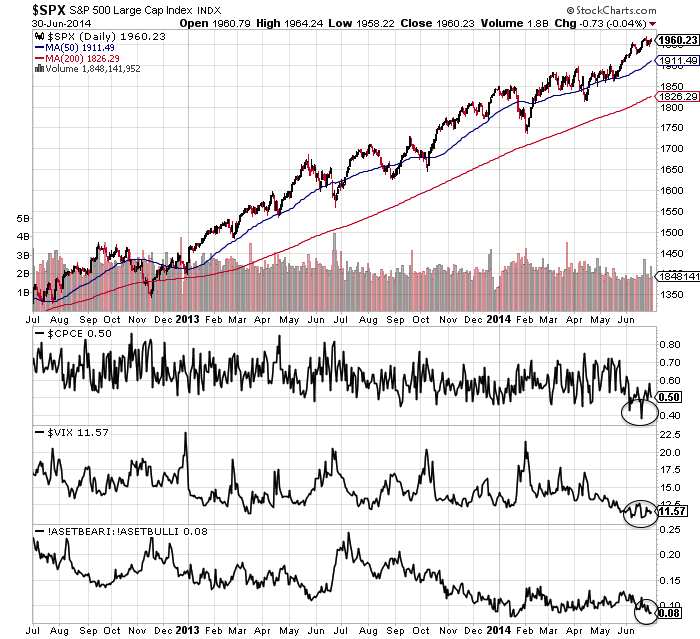
Whilst small caps are off their peaks, large caps have now broken upwards to new highs. To bring us right up to date they are trying to cement a break-out on 62% II bulls, 91% NAAIM equity exposure, some 9 month divergences in breadth, low volume, low protection and low volatility. Skew remains in a persistently elevated range, reflecting the risk of a large downside move due to the extreme lop-sidedness in the markets. 1987 and 1929 (similar backdrops in sentiment, valuation, leverage) both produced breakouts from ranges around May for a final 2-month overshoot higher, so there is historical precedent, but to achieve that here and now we would need to print anomalies in some historically reliable indicators and print some new all-time records in bull assets, sentiment and, likely, leverage.
Source: Acting-Man
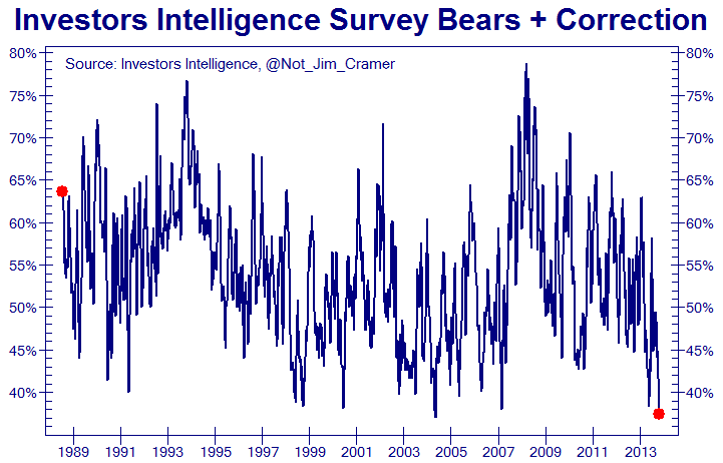
Source: Not_Jim_Cramer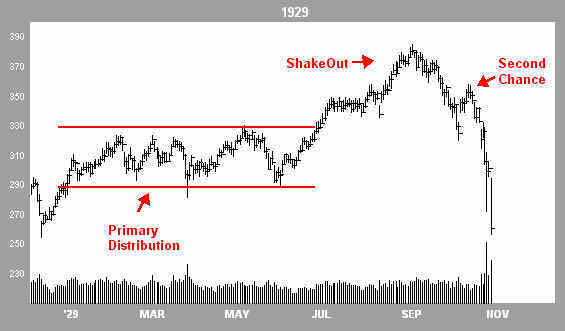
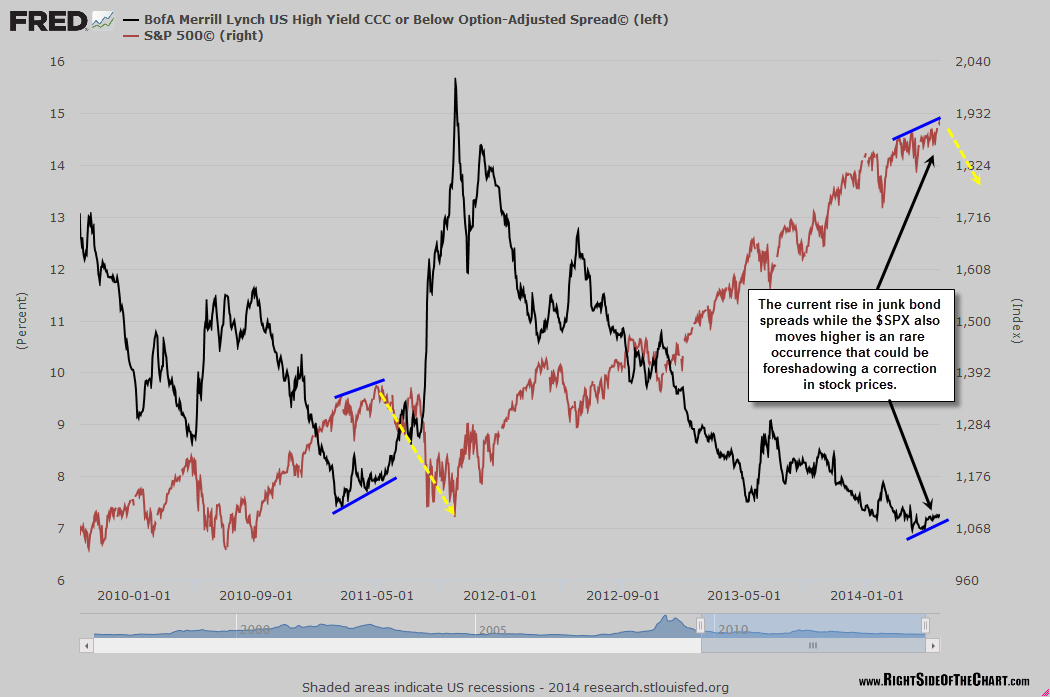
Source: Financial-Spread-Betting
I believe that US equities are more likely capped on the upside, with a lack of fuel to propel higher, in an ongoing topping process that began at the start of the year. Looking ahead to this coming week, the overbought and overbullish indicators flagging make it more likely the markets will pull back, perhaps to retest the breakout. This likelihood is enhanced by the downward lunar pressure and geomagnetic storming over this weekend.
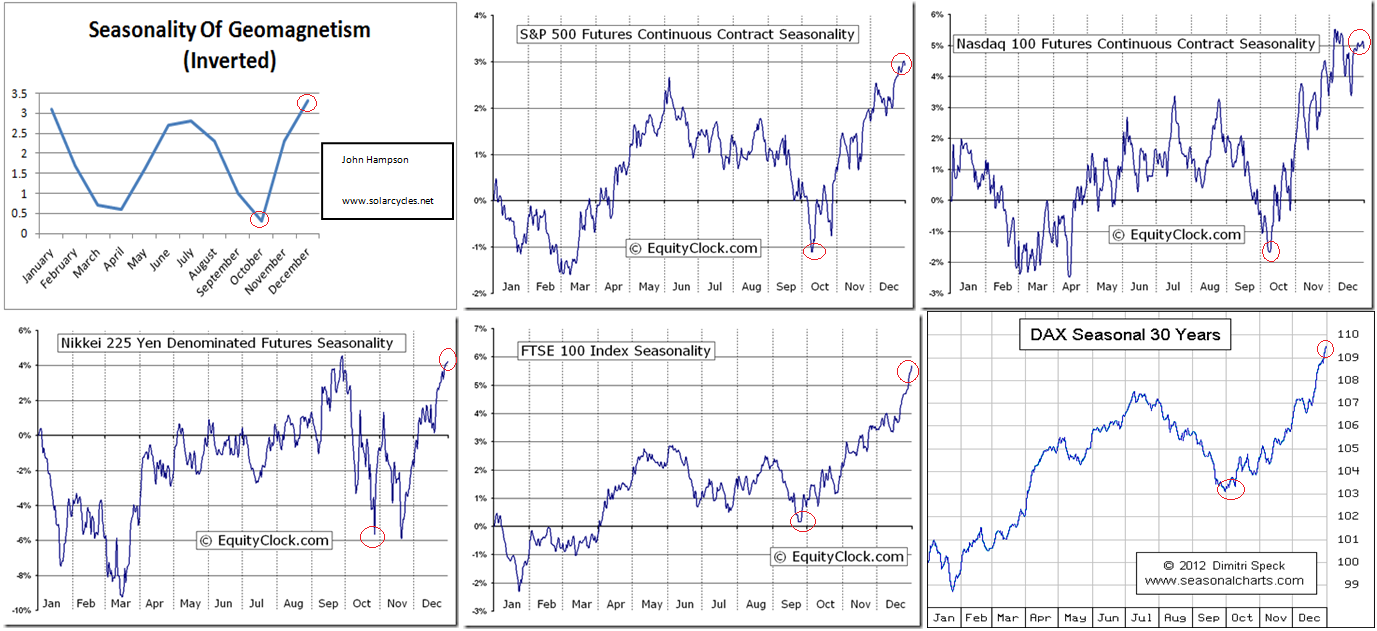
A final topping price in the June/July window for large caps would fit with the inverted geomagnetic seasonal model above, and as per that model, could then pave the way to ultimate hard falls in Sept/Oct time. A ceiling on large caps price rises here would then likely be compatible with R2K and Biotech not exceeding their Feb-Mar highs. This in turn would then fit with margin debt pausing its decline but not exceeding its high, as it did in 2000 and 2007, whilst stocks completed their overall topping process.
In short, the above analysis is the best fit as I see it. The cap on equities moving significantly higher is key. The big picture for that is demographic, and supporting that are the levels in sentiment, leverage, volume, and asset ratios. The picture is one of very lop-sided extreme bullishness, with naked unprotected longs on leverage. Markets have historically been unable to keep advancing when indicators have reached these levels and the mature divergences now in place ought also to resolve through downside price action, short of printing historic anomalies. Such a cap on price upside would then likely honour the existing peaks in small caps and margin debt and the turn-of-the-year cross-asset peaks that continue to be compelling in association with the solar cycle peak. Drawing on the historic analogs this may mean range-trading for some weeks more yet before a sharp correction erupts.
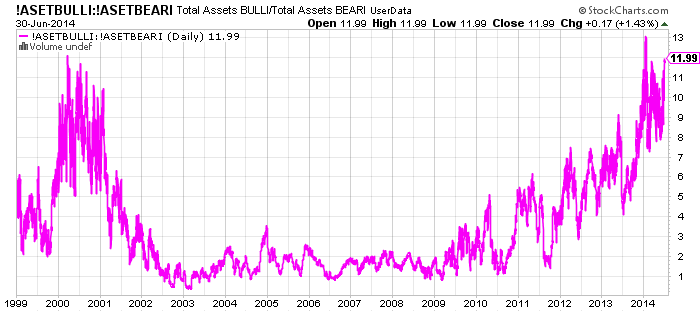
New highs in small caps, new highs in leverage, a reversal out of defensive sectors and assets, and/or repairs to volume and breadth would make me abandon that ‘best fit’ and conclude that the sun is not yet done with its speculation incitement. Whilst I can’t rule out a more definitive, crazy parabolic to erupt here, as has been typical at historic solar maxima, I just doubt it because of the lack of demographic support combined with the levels already reached in the likes of margin debt, rydex, valuations, investors intelligence and more. If a sharp terminal up-leg can actually occur from here on continued low volume, without the need for a stream of new buyers, then it would be a game of confidence in which the fear of losing out on stellar gains drives prices higher in a feedback loop despite participants knowing it is manic and unsustainable. If that were to occur then it would make the ultimate correction even bigger, but prior to that it would be a challenge to both bulls and bears: play the danger or suffer the drawdown. What seems clear though from history is that leverage would need to accompany such rises, and it appears that leverage already peaked out. However, there is a possible middle path, in which prices can eek out some more gains in June/July whilst not straying too far and honouring most of the above.
My strategy remains the same: I continue to look and attack on the short side for both short term profits and to add to my sell-and-hold big position. Only if it appears that we are entering some kind of terminal parabolic panic-buying upleg, would I then look to hedge by joining the danger game on the long side to some degree. Meanwhile, the risk to those still playing the long side is that the market is vulnerable to some surprise bad news due to the skewing of bulls, bullishness, leverage, complacency and lack of protection.

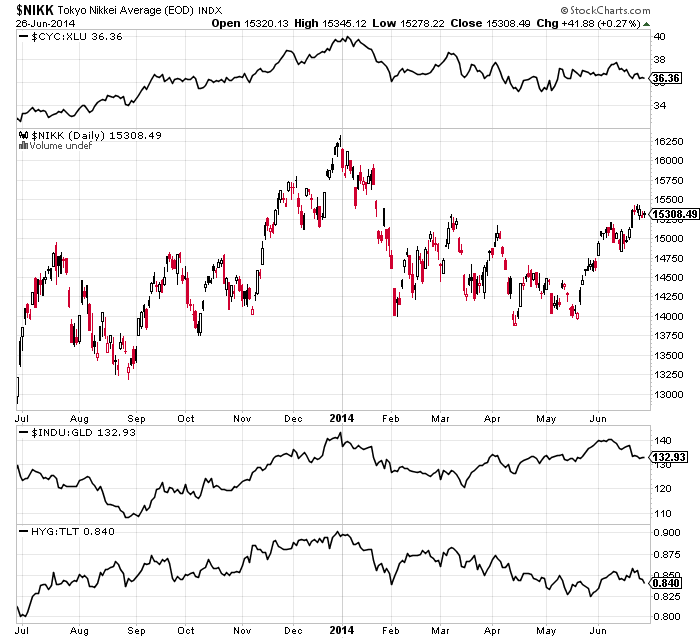
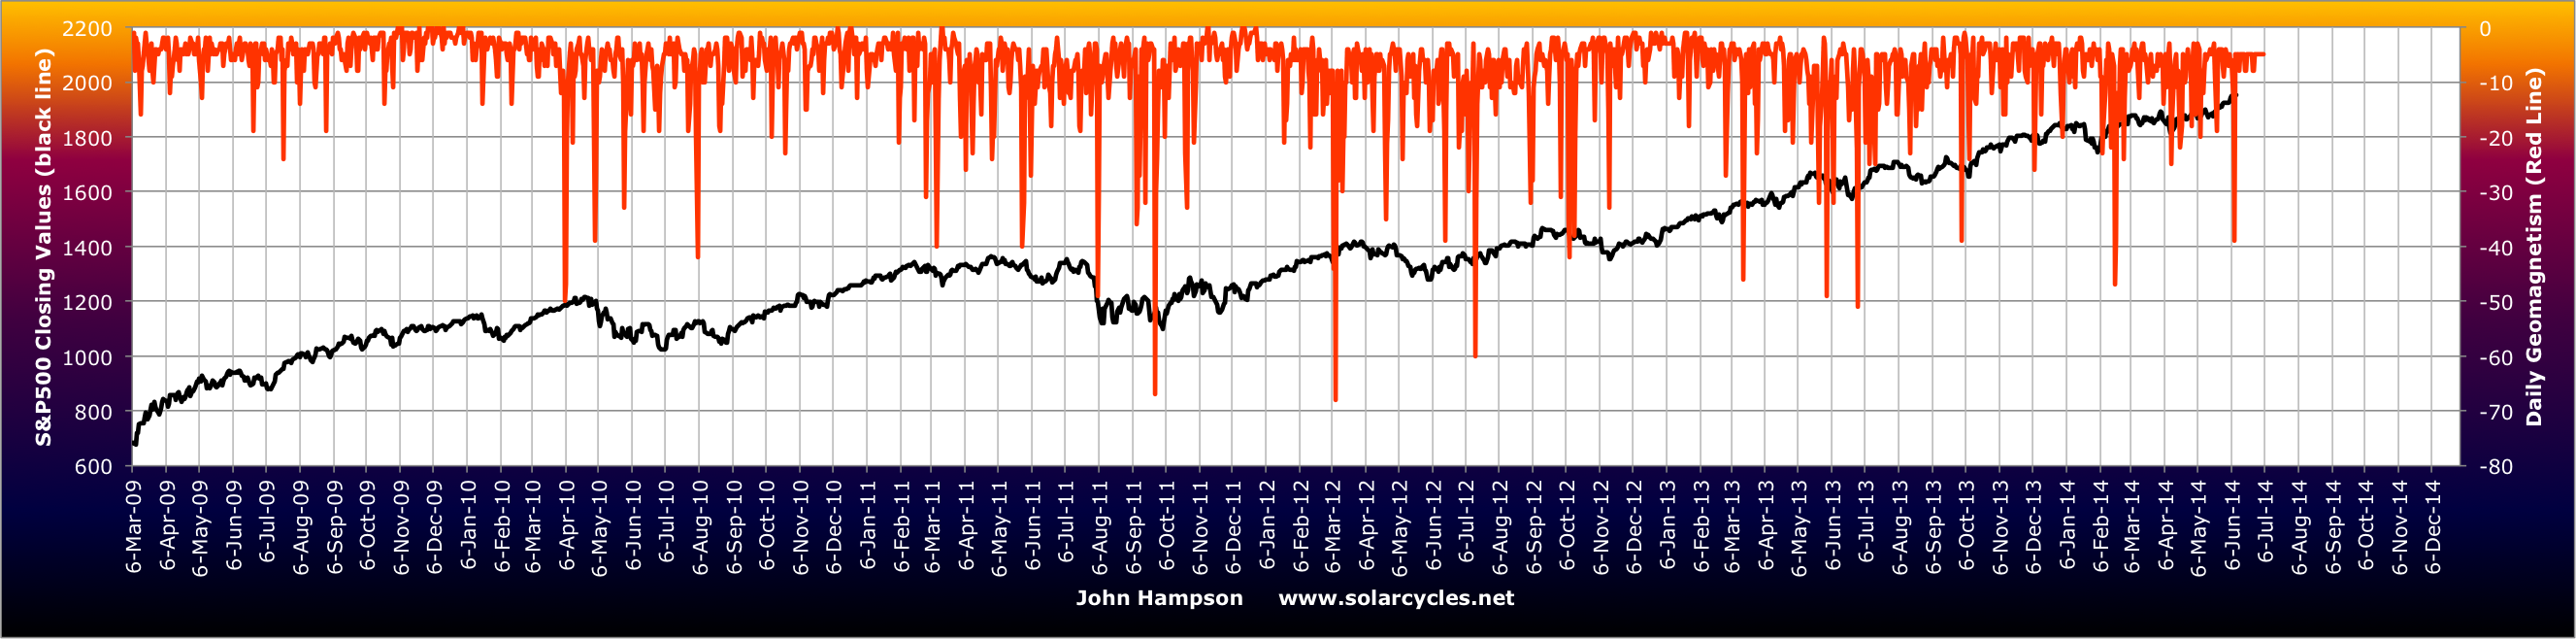
 The first major peak point occurred at the turn of the year, around the 2 Jan new moon and at the inverted seasonal geomagnetism peak (i.e twin optimism peaks), as these charts show:
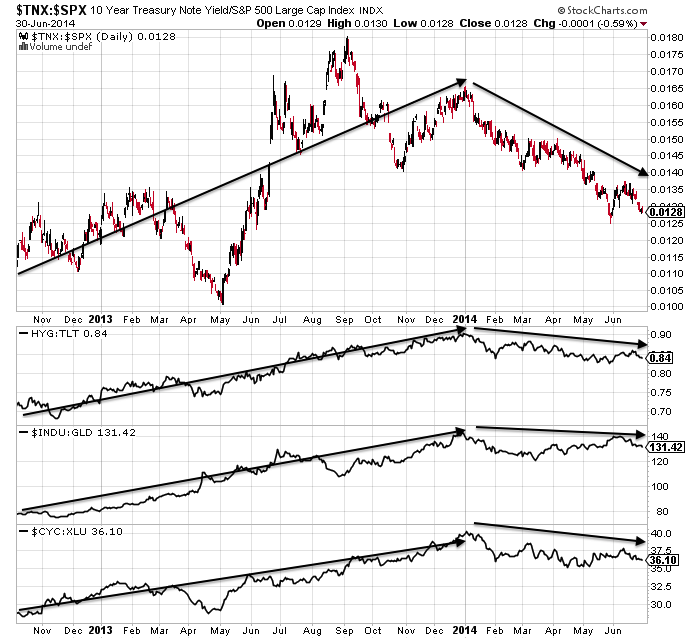
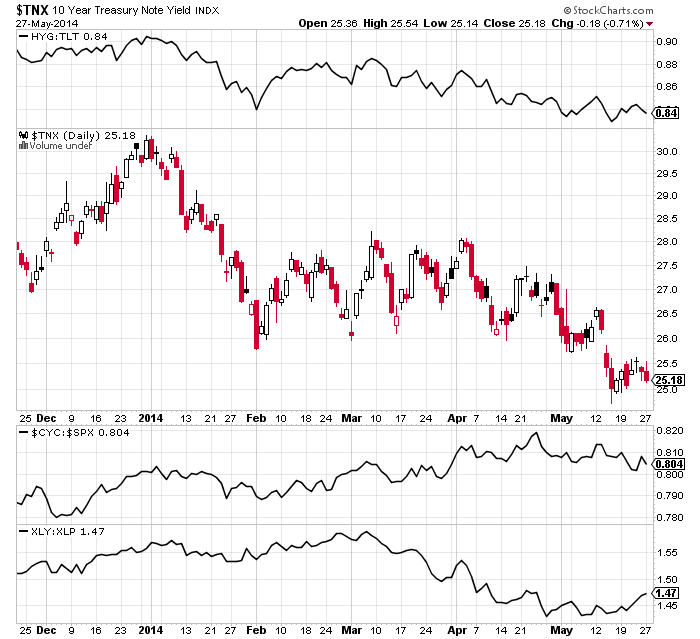
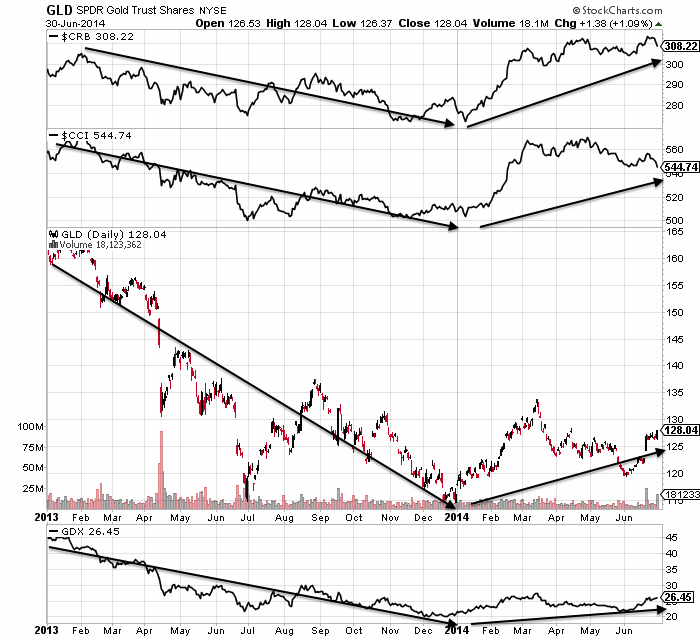 There were inversions at this point in different assets and sectors, and the Nikkei peaked-to-date 31 Dec. Various risk-off, defensive and late cyclical assets and sectors have been the dominant money flow targets since then.


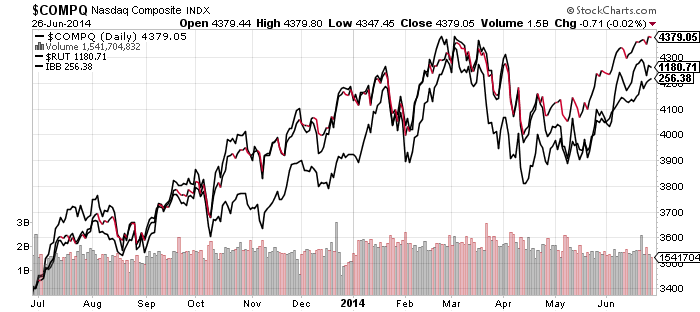
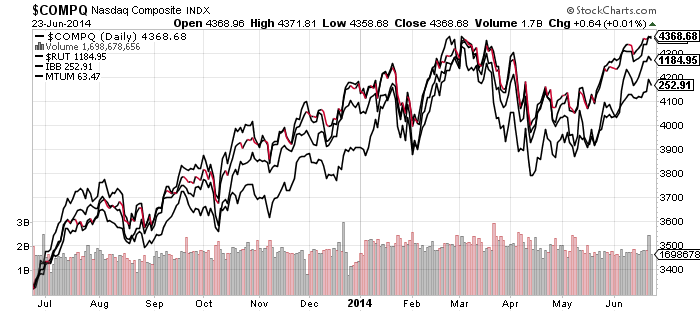
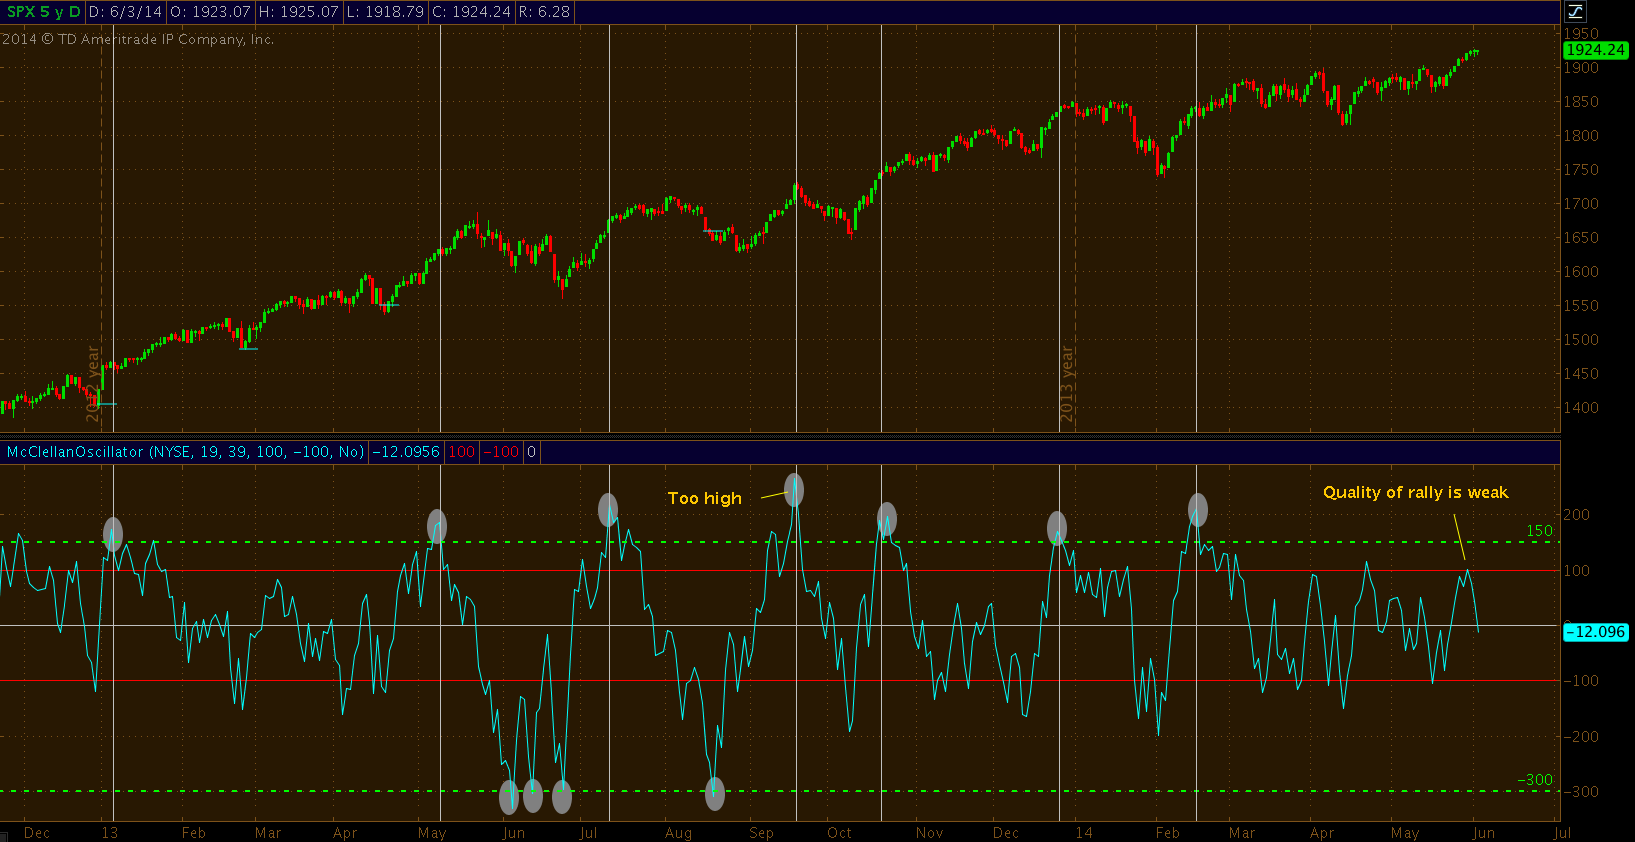
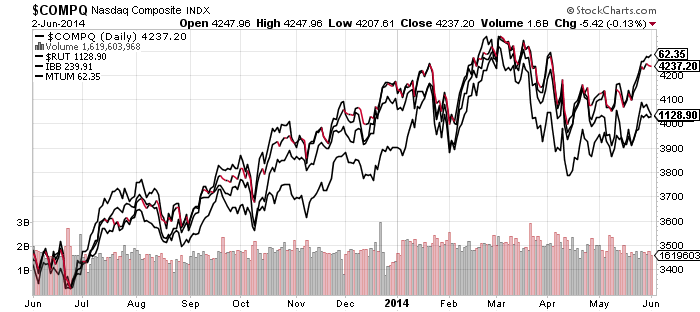
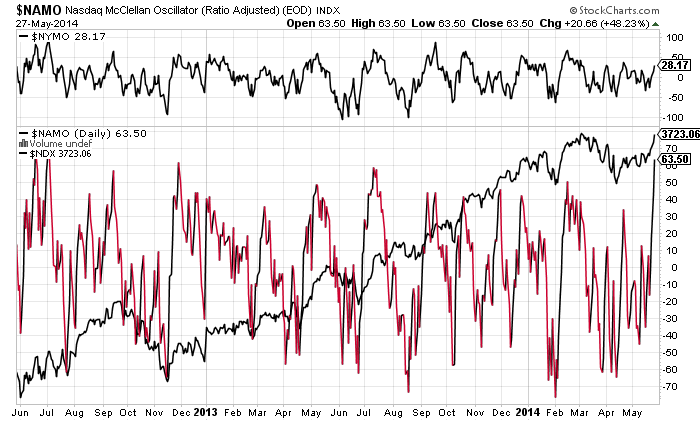
 The four main US indices aggregated also show the three peaks:
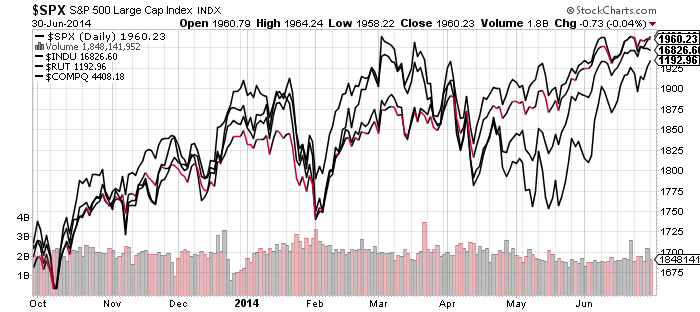
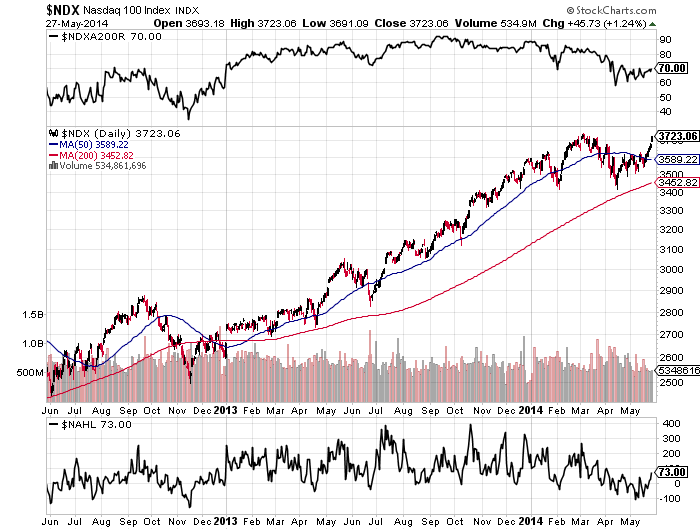
 So could stocks then run higher yet and postpone the final peak until late summer or even further out? I can’t rule it out, and it is the main threat to my positions: greater drawdown before it swings definitively my way. However, the trend in leverage suggests further price gains from here are unlikely. The COMPQ is at a suitable double top, whilst the RUT and IBB should make lower highs here to honour the Feb/Mar central peak. Various indicators are stretched to levels that are suggestive of ‘all-in’ or imminent reversal. We have mature divergences seeking satisfaction and fundamental doubts through Q1 GDP, negative economic surprises and Q2 earnings warnings.