No collapse in the stock market, which makes the case stronger for a more regular multi-month topping process. It would be historically normal for equities to retest their May highs and even make a marginally new high, then complete a volatile trading range by around September time before falling in earnest.
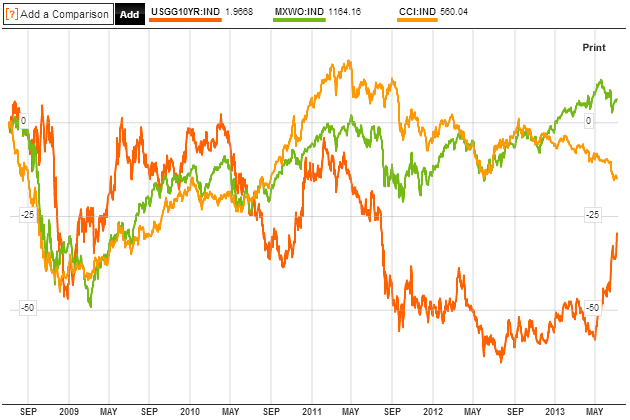
Also historically normal would be if commodities outperform from here, with bonds having topped first, then stocks topping, and eventually commodities topping out, likely in 2014. The continued falls in bonds – and rise in yields – adds weight to bonds having topped – and yields bottomed – in 2012. Now are world equities in the process of making their top?:
 Source: Bloomberg
The strong advance in crude oil of late has added more weight to commodities going on to outperform here, rather than the historically abnormal but deflationary case of commodities sinking. The combination of protest and unrest in Egypt together with speculation in crude oil are both historically normal for a solar maximum, so I am encouraged. Nonetheless, crude oil has yet to truly break out and some geopolitical dampening could pull it back:
 Source: Stockcharts
If crude does continue to rise, then commodities as a whole should catch a bid, due to high historic correlation, with oil a a key input in the agri process and a key inflationary force, which brings us to gold. Gold has dropped around 30% from its 2011 high, which is similar to the percentage drop made in 2008. It has the potential to be making a bottom here with a higher low than in late June, and the longstanding overdue bounce based on extreme bearishness, but only if it can rise this coming week, which brings back to oil’s performance, plus also the US dollar.
The recent strength in the USD has taken the currency to back up to a key level. Below is the long term view and the potential for an important breakout:
 Source: Rambus / Stockcharts
However, as per my demographic work, I believe leading indicators will weaken and gold will re-assert itself, and US stocks will top out here reducing demand for the dollar. Here is some evidence to support that view.
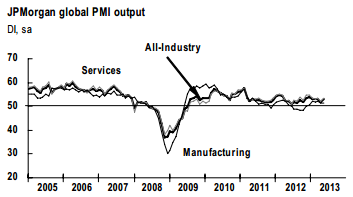
The latest global PMI combined services and manufacturing dropped to 51.4 from 52.9 and continues the overall weakening trend over the last few years. This is as I would expect under the combined deflationary demographics of USA, China and Europe since around 2010.
 Source: Markit
The performance in corporate bonds suggests US housing may be about to turn down again also:
 Source: Martin Pring
And margin debt continues to look an important pointer for the stock market. See below how a sharp run up in margin debt, a final parabolic rise, precedes the 2000 and 2007 tops in the SP500 by several months. We have seen a similar parabolic rise since mid-2012 to now and there is the possibility that margin debt peaked out in April which would suggest stocks should indeed be in a topping process now and over the next couple of months:
 Source: Dshort
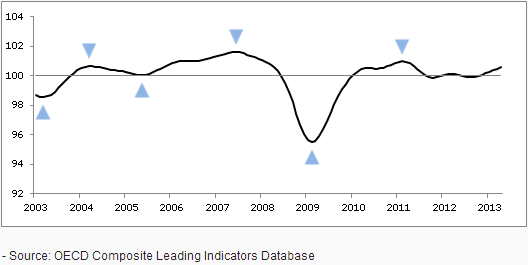
If stocks are topping out then normal clues would be found in negative divergences in stock market internals and leading indicators. For the former, we should look for breadth divergence once we see a retest of the highs. For the latter, we have the potential in the global PMI above, but also in this leading indicator of leading indicators, by RecessionAlert:

Source: RecessionAlert
I have enquired with them what this MBS indicator is, but have no reply. If anyone knows, please share. But it would fit with my demographic-deflationary expectations.
We also see a potential divergence in geomagnetism, if equities can now rally again to a retest of the highs:

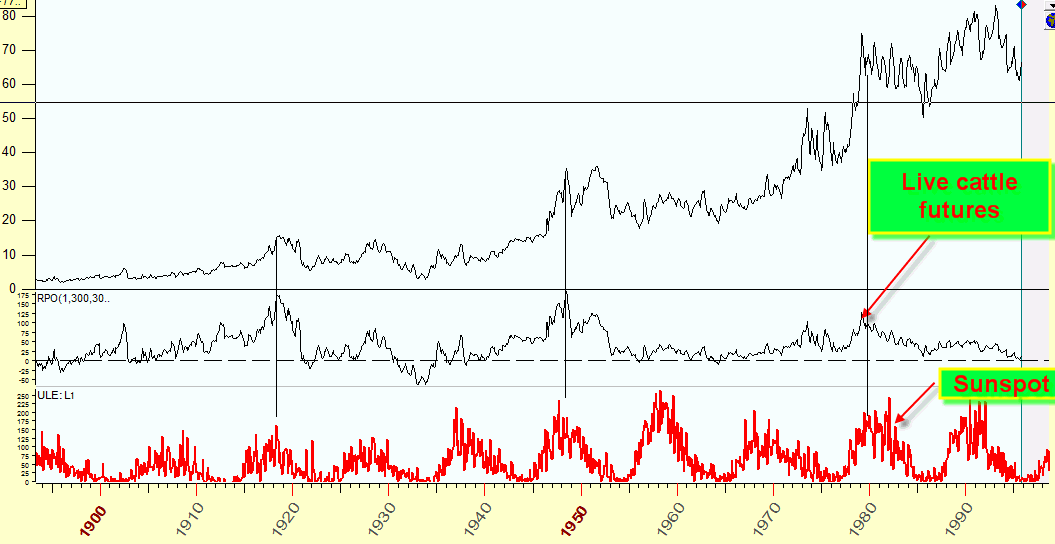
The ideal combination by my work and research is for commodities to outperform again now into next year, and make a speculative peak near to the solar peak (the timing of the solar peak remains unknown, with the experts still diverging. Sunspots are currently back up over 100, which adds to the muddy trend), then deflationary demographics to mean the global economy fairly quickly tips into recession under that commodity price pressure, and then we should see the steep falls in nominal stocks. My alternative scenario is that the deflationary forces are too great and commodities in general sink with just gold, as the anti-demographic, eventually coming again alone.
In support of my primary scenario, the action in live cattle has been very much aligned with solar history, with what looks like a peak earlier this year:
 Source: Tarassov
 Source: TradingCharts
Now we need to see other commodities make a fresh rally to new highs, assuming a solar peak is still ahead.
This week we have the new moon on Monday and the end of the lunar positive period by Thursday. So I am ideally looking for equities to rise further in the next couple of days and make that retest of the highs or marginally higher high, then retracing again in the negative lunar period ahead, to further the technical look of a topping process. If we get that retest of the highs then I will be looking to sell equities longs and add short. But for further support I would like to see oil break out, commodities to rise en masse and the US dollar to be turned down with gold catching a bid at last. Let’s see how the action unfolds.