

If the combined demographics of the major nations are exerting an overall deflationary pull on the global economy, then we ought to see clues in the data. Broadly-speaking, USA demographics began a downtrend around 2000, Europe around 2005 and China around 2010. Therefore, the biggest pull has been in place since 2010 or so.
G7 and E7 countries combined industrial output has been weakening over this period. The question is whether this measure is going to continue downwards and break beneath zero or pull upwards again from here:
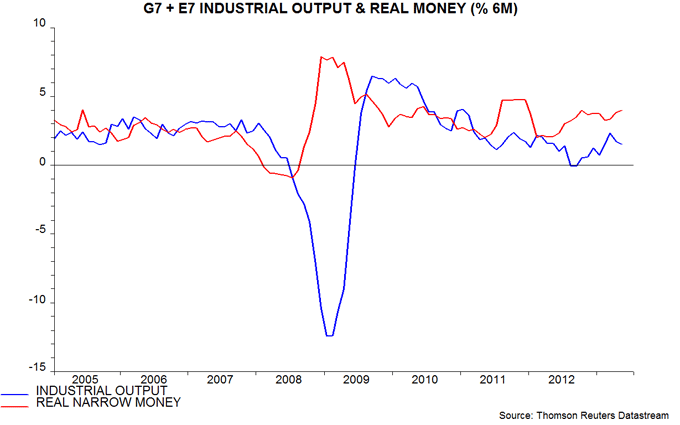 Source: Moneymovesmarkets
Retail sales in some of the key advanced economies have also shown a declining trend over this period, and are also at the point whereby they either pull up or drop into the negative:
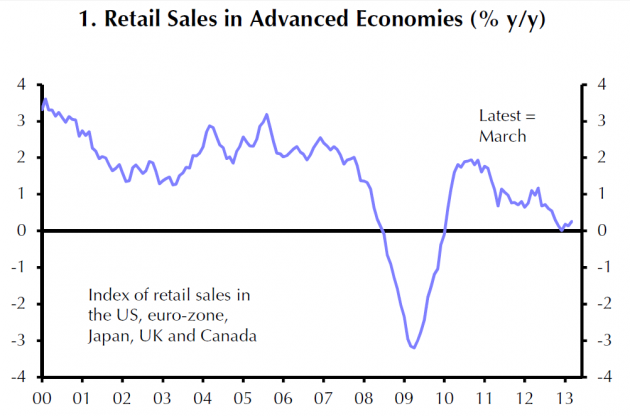 Source: Capital Economics / IBtimes
The global PMI composite for services and manufacturing shows something similar: a weakening trend over the last several years and the same predicament going forward:
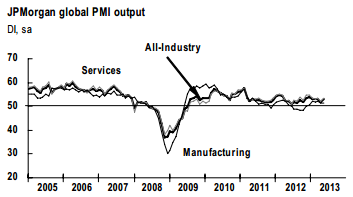 Source: Markit
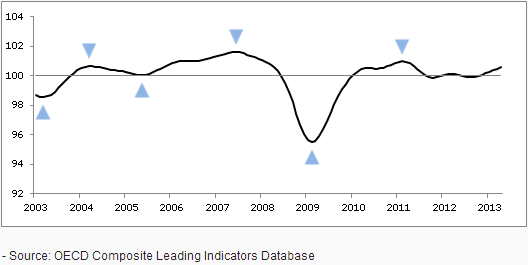
Combined leading indicators for the OECD nations have also shown weakness the last couple of years but are trying to pull up again:
Furthermore, we have seen a renewed round of easing recently, with rate cuts across the globe in the last couple of months, as shown below, which should have a positive effect several months hence:
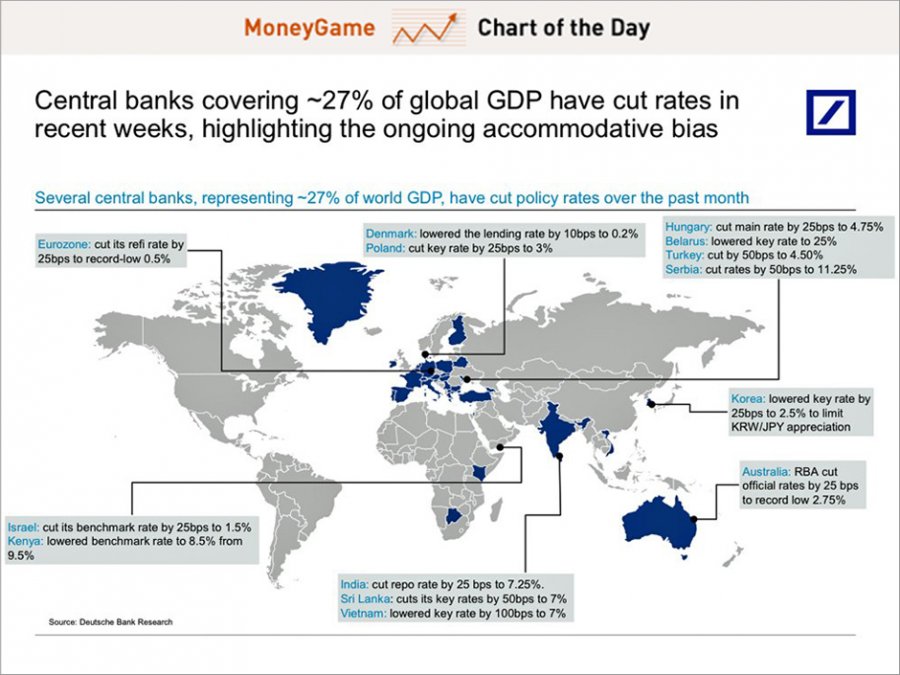 Source: Business Insider / Moneygame
Lastly a look at specific USA data on its own does appear to show trends being pulled down over time:
 Source: Streettalklive
 Source Dshort
Now let me outline two scenarios going forward. The first is that the world economy picks up in the second half of 2013. Positive effects from the round of further rate cuts, plus the drop in input prices through recent softer commodities push most of the above indicators upwards and away from danger. Demographics continue to exert their influence in keeping global growth weak and unimpressive, but growth is nonetheless maintained and improves, at least temporarily. Asset markets would be the primary beneficiary, with stocks most likely winners again, under low growth low rates. Commodities should also get a boost, in a mean reversion away from oversold and overbearish, and on improved global demand. If commodities then gained too much traction, the risk would be of oil and other key inputs tipping the world into recession given global growth is fragile due to demographics.
The second scenario is that the combined demographic trends of USA, China and Europe, that are now collectively at their most potent, drag those indicators above negative and the world economy tips into recession under deflationary momentum. So no spike in commodities, no excessive inflation or subsequent tightening, but rather like a global version of Japan in the 1990s, whereby no central bank action could prevent the demographic waves from cutting spending and investing. Such a deflationary shock is the scenario Russell Napier is predicting. QE has failed to produce either strong or self-sustaining growth, and growth in emerging market reserves has reversed, limiting their ability to deal with another deflationary shock. Inflation is the only real solution for the indebted developed country governments, to inflate the debt away, yet they cannot induce the necessary inflation, due to the combined demographic downtrends. If the world was to tip into a deflationary recession, then I expect a panic would ensue and stocks would sell off hard. The perception would be that despite the billions spent on propping up the economy, it had all failed and central banks were powerless. The massive debt that had been racked up in trying to stimulate and support was also now growing even bigger under deflation – a double failure. Of course, demographics would be the culprit, and eventually by around 2020 the trends would have improved in USA and China and others sufficiently to give the global economy traction again, but not before a massive sell-off in assets.
Stocks look to be rising again since the new lunar positive period, so I am hopeful my preferred scenario of a re-test of the highs will ensue. If this is a topping process in equities then we may then see the historically normal switch to outperformance in commodities. Certain indicators, such as Martin Pring’s, suggest commodities are about to gain traction again, and given they have been oversold and overbearish for some time now, a mean reversion would make sense. If commodities were to truly rally and then top out after stocks in the normal sequence, the whole momentum move for commodities would have to happen fairly quickly. This could happen through solar maximum inspired speculation, but until and unless commodities become the money target then this scenario remains theory for now.
If commodities do not take off, but rather leading indicators weaken and provide a negative divergence to the equities high retest, then the deflationary scenario could be unfolding. I would expect bonds and cash to be beneficiaries to some degree, whilst equities fall hard, and I believe gold would rally again, as the anti-demographic go-to. Once again I could see a solar maximum inspired speculative peak, this time in gold.
I have to end on the scenario not mentioned. Central banks continue to tease enough growth in the economy to keep stocks in favour. Not too much to inspire inflation and commodities momentum. Not too little to slip into deflation. Sustained weak growth in the economy and sustained easy money conditions, with the latter inspiring continued flows into equities, and perhaps a solar maximum inspired speculative peak happens in stocks. Under this scenario I would expect Japanese equities to outperform, under their belated demographic catch up, full-on central bank push, and as an energy importer benefiting from the subdued commodity prices. If this scenario were to be the theme of H2 2013 then I would expect renewed economic weakness in 2014 as the recent round of easing wears off again, and demographic forces continue to pull. Would we then slip into deflation at that point, or could yet another round of central bank interference once more have the required effects?
It comes down to whether central banks are really in control here. Are they successful in their ZIRP and QE efforts? The evidence suggests not, as they cannot induce inflation nor sustained growth. Japan’s central bank could do nothing to overcome their demographic downtrend in the 1990s. Central banks can only encourage or discourage through their tools, they cannot force. With US, Chinese and European demographics united down in this decade, I think that’s too potent a combination for central banks to overcome. It’s just whether they can keep it at bay for now. So let’s see how leading indicators develop, and whether commodities can attract a rally or not. Timing the solar peak remains troublesome as the experts cannot agree, but assuming it remains ahead, then I expect it still has a key role to play here. I expect a sunspot-associated speculative peak, and maintain the most likely asset to benefit is gold, as demographics are anti-equities, anti-t-bonds and deflationary. If it isn’t gold, then the combination of easy-bubble-making monetary conditions and solar inspired speculation should inspire a moon-shoot in another asset.

Thanks for your analysis!
I really love the demographic analysis you did during last months.
Don’t you think it is not unreasonable to expect that different demographic groups would be responding to solar activity growing/decreasing with different actions? As they have different perspectives and different objectives they should be biased toward different behaviors.
My uneducated guess would be – young should be more fearless and overly optimistic. Older strata might probably be more defensive. With tendency to have higher percentage of their wealth in liquid easily exchangeable assets (gold, cash, bonds).
regards,
P.
p.s.
For short term outlook I am always eager to see sentiment indicators you sometime post.
Thanks Pawel. Could be.
Any sentiment indicators in particular?
In the second scenairo, I think commodity still can rally in deflationary environment like 00-now . When economy is falling into recession, global central bank must kick off a new wave of printing money that cause a short lived rally of commodity. However, central bank finally cannot stop the deflationary pressure. All asset except for USD and Treasury will fall hard.
P.S I hope the following research by Deutshce Bank about long term trend is helpful to you
Click to access lt-asset-return-study.pdf
Bo,
Many thanks. Beefy but extremely interesting. Wow!
HVA
Thanks Bo – will make some time to read that report as looks to be good input into the theme.
Oil?! Go to http://www.barchart.com and look at Commitment of Traders for oil. Big speculators who are usually wrong at turns, are at record high longs. Speculative commercials who are usually right, are in record short positions. But iq1n 2008 the specs forced the commercials to cover forcing the huge spike we saw in oil. Just the producers (part of commercial specs) are net long. Since they are normally sellers, obviously; they may know something or the specs have already forced them to start covering. Whatever, the COT are at extreme levels.
Plentiful inventories and a strong US dollar, yet it is making another attempt at an upwards breakout.
Yes, I read it may be geopolitical, Egypt closing down the Suez Canal! Or it could be like 2000 when the Economist said the world was awash in oil at $10 a barrel as a great bull mkt started. Not my belief but possible. This just in, military in Egypt to remain neutral giving 2 weeks for a settlement.
John,
Your comprehensive demographic studies have really produced some noteworthy results. I hope you plan on organizing it all into one easily located and studied grouping on your website. Perhaps another PDF? 🙂
The last scenario you mention, the previously “not mentioned” one, I think that’s the most likely scenario given the macro backdrop (fully supported by your demographic studies) and CB’s effectiveness (or should I say ineffectiveness?) these last few year. I think at best they can insure liquidity, and that’s about it. Financial Black Hole Avoidance is the name of the game, and is the only game they’re capable of at least coming out even with I think. I’m almost 100% certain that the CB’s know this perfectly well (after all, they do have the best minds around to work with the best raw data available). Quantitative Easing as we know it wouldn’t exist without a real threat of systemic collapse IMO. CB’s are in control just about as much as firemen are in control of putting out a fire though, and while that isn’t much, ultimately, it looks pretty good to the person who lives next door. 😉
Okay, that’s my opinion, and I know it’s not the only one around. Have you seen this from Gann Gobal? http://www.gannglobal.com/webinar/2013/06/13-06-25-Video-4.php Got to admit, they’re sticking to their guns!
Thanks High rev. Appreciate the link, hadn’t seen. Another PDF is a good idea – a winter task to organise the new material on the site.
John, as I somewhat mentioning in the last posting; one other alternate. I think a new Bretton Woods like event would occur once they see currencies and prices are deflating. SDR’s might take off more quickly and the dollar loses it reserve status faster. Or, they do a more price tag where its a fixed value to gold. All of this of course after enough damage is done already.
Makes sense, thanks wxguru
Thanks for all of your reports, they are very informative. Robert Prechter has also been predicting a deflation scenario: Conquer the Crash, published 2002. Russell Napier’s The Anatomy of a Bear, 2007, is also a great read.
Thanks Cesar
Thanks, John, you know my deflationary scenario from long time ago. QE stimulus have created embarrassing enviroment and have made a little more inflation, but you see prices are falling down and commodities are in a down-trend since 2011.
Hi Antonio. I think it’s important to realize that “money printing” or QE alone does not create inflation. Inflation appears when there are bottlenecks or shortages in the economy. If demand exceeds the productive capacity in a given sector, then that sector will respond by raising its prices.
But if a company or sector has plenty of idle capacity, then they respond to rising demand by increasing their production, not by increasing prices.
Current situation in most western economies:
*labor shortages: none (on the contrary, record jobless rates)
*commodity shortages: none
*capacity utilization: low
That’s why the setup is for deflation, as you point out.
I would like add my theory
We are importing deflation
We continue to buy the same goods cheaper and cheaper
While our standard of living improves, we create all the problems of joblessness in our own countries.
And it can only end with some form of import protection….. which is swear word.
Another factor to consider is this: Where is the QE money going? If it’s just sitting in bank reserve accounts, it will not have an inflationary effect. If it’s getting funneled into the stock market, it will fuel rising stock prices. Neither of these will cause price inflation for goods and services.
Thanks for your input guys
Admirable work. Significant insights and no doubt markets are effected by demographics as demographics may be influenced by Solar Cycles. I’m thinking that the demographic influence is also qualitative as much as it is quantitative. Each generation contributes a force to the economy based on its size but also based on its position in history. There is much discussion bandied about regarding Millennials and this group of 25-34 year olds hasn’t had its say yet. It will be interesting to watch their power unfurl. One of Pring’s tenets is that real estate as a leading indicator has been a powerful predictor for 200 years. Indicators have been distorted with all the intervention so we might have simultaneous scenarios playing together at once, a Phase VI and Phase I in Pring parlance, going off together. Like listening to two radio stations at the same time on different radios. With time we can get back on to a single station and tune out the distortion (maybe).
Household formation is both qualitative and quantitative and millenials are just now moving out of their parents houses to shack up with others. Multifamily home starts have ricocheted off the bottom even more than single family home starts. This is a significant development with positive lag effects. Renters will dominate for a time until credit access and jobs find equilibrium. So we are witnessing a sea change.
http://www.theatlantic.com/business/archive/2012/12/the-most-overlooked-statistic-in-economics-is-poised-for-an-epic-comeback-household-formation/266573/
Lifecourse.com has some fascinating research on the effects of generations on the political economy. I was first drawn to this work by a little book called The Fourth Turning which we are presently traversing. Solar Cycles seems to be a helpful accompaniment to their work.
HVA
Many thanks for your input HVA
I’m confused, if you expect deflation, why would you want to hold gold? Regardless, could get interesting when mines start shutting down.
My view of gold as the default go-to, the anti-demographic, with demographic trends counter stocks, real estate and gov bonds, and with ZIRP counter cash.
The demographics for Israel are also good:
http://www.madhedgefundtrader.com/demographics-as-destiny/
Thanks
we have a solar storm with Kp=7
Here are all such storms and Norwegian index since 2006

All storms led to market declines, except December 2006. Think the bullish December-effect cancelled that one
Thanks Jan, looks potent
yup, think so 🙂
My diagram above shows that the initial market reaction often is up first, then the correction.
This is however more frequent in uptrends, where the storm seems to cause the last squeeze up to overbought, before it stalls.
BUT when a storm happens in a downtrend, it often causene an immidiate downturn.
And right now the markets have bounced for ~4 days and could be ripe for another leg down. But must be prepared for some kind of initial squeeze…
I have updated all models this morning. The forecast for the next 3 weeks together with the storm of the weekend makes for a fairly unbroken geomagnetic downtrend.
Thanks, John
Hi John
Norway is signalling ~10 days downside from here, and target could be ~5% below recent weeks low.
Then a 3-4 week bounce into August, and down again.
There is a “crashy” element here, because this scenario would suggest inverted/collapsing cycles… and that normally means a mess.
Hi Jan
Is there any correlation between your Norway market and US S&P?
Regards
bobc
hi bob
most markets correlate well on the short term, at least Europe and US. On a longer term Europe and US also correlate well.
One reason that markets correlate well, is that they are driven by sentiment, and sentiment is mainly caused by solar cycles/activity (geomagnetism, solar flux, solar wind).
Norway is a slave to the SPX futures, and seldom goes against it. So to trade Norway, I must analyse SPX. So when I get a signal from SPX, it will affect Norway. And if I get a signal from Norway, it can be a leading signal for SPX, unless it gets cancelled.
For SPX I had a signal of an ABC-mode down after the FED shoulder, and it is noe finishing the B-up and preparing for C-down.
And Norway is projecting downside the next ~10 days.
It is still room to go sideways a couple more days…
cheers
JAn 🙂
A good read on correlation between different stock markets is Rouwenhorst research paper (http://www.imf.org/external/np/res/seminars/2003/global/pdf/rouwe.pdf ).
Historically the correlation has varied between 0 and 0.40, and there have been long streches of weak correlation, which doesn’t support the idea of the solar cycle as an important driver of sentiment in the markets. Periods of internation conflict have typically come with low or no correlation, while periods of economic integration have usually come with higher correlation.
Busy moving into my new home this week, hence the lack of new post. But keeping my eye on the markets and this action in crude oil looks significant.
oil is on its last leg IMO. Excellent short candidate!
Hi bluemoon
Thats a very strong statement
Seeing as I am long, big time
Why is oil on its last leg and when do you think this leg will break?
regards
bobc
Thanks Jan
Just what I wanted to hear.
Regards
bobc
looking into the data for geomagnetic storms of Kp>6, shows that in Norway there is always a squeeze topping around one week after the storm, typically some 2-3% up from the level at the storm.
And then we typically fall 5% or deeper below the level of the storm in the weeks following.
So that would suggest a top around this weekend or early next week, and then some weeks of downtrend/correction.