Saturation Again

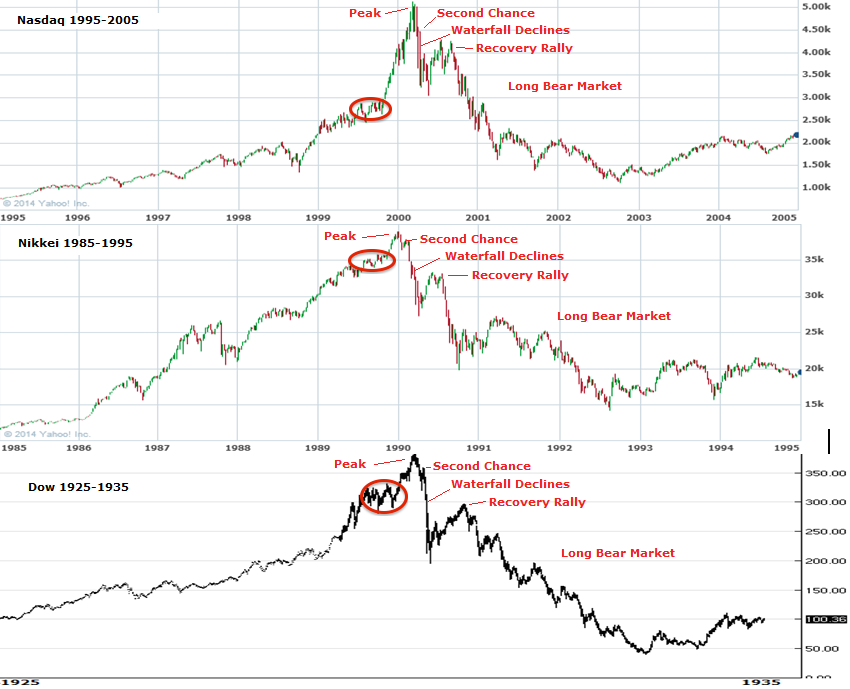
We have many historically reliable indicators of a major stock market peak in place: valuations, sentiment, allocations, leverage, negative divergences, risk-off money flows, all clustering around the smoothed solar maximum of April 2014. IMO, a compelling, cross-referenced real time test of the theory with too many angles all united as one, to question whether we are considering the wrong dominant cycle. If some other king cycle were at work with some peak in the future, then we would not have seen all those topping indicators and topping process characteristics coming to fruition in 2014. Rather, they would have only begun to form at at a later date. Therefore, there are only two possibilities in my eyes: either we are indeed seeing the last gasps of a topping process, or there is some other agent at work keeping price rising that is anomalous to historical peaks, namely the manipulation by a few big players fuelled by ZIRP-enabled leverage. With those two options in mind, here’s the latest picture:

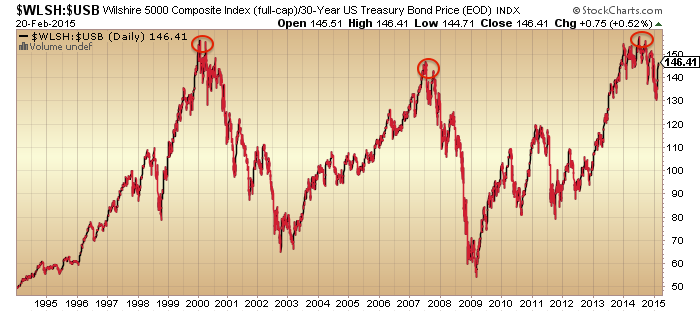
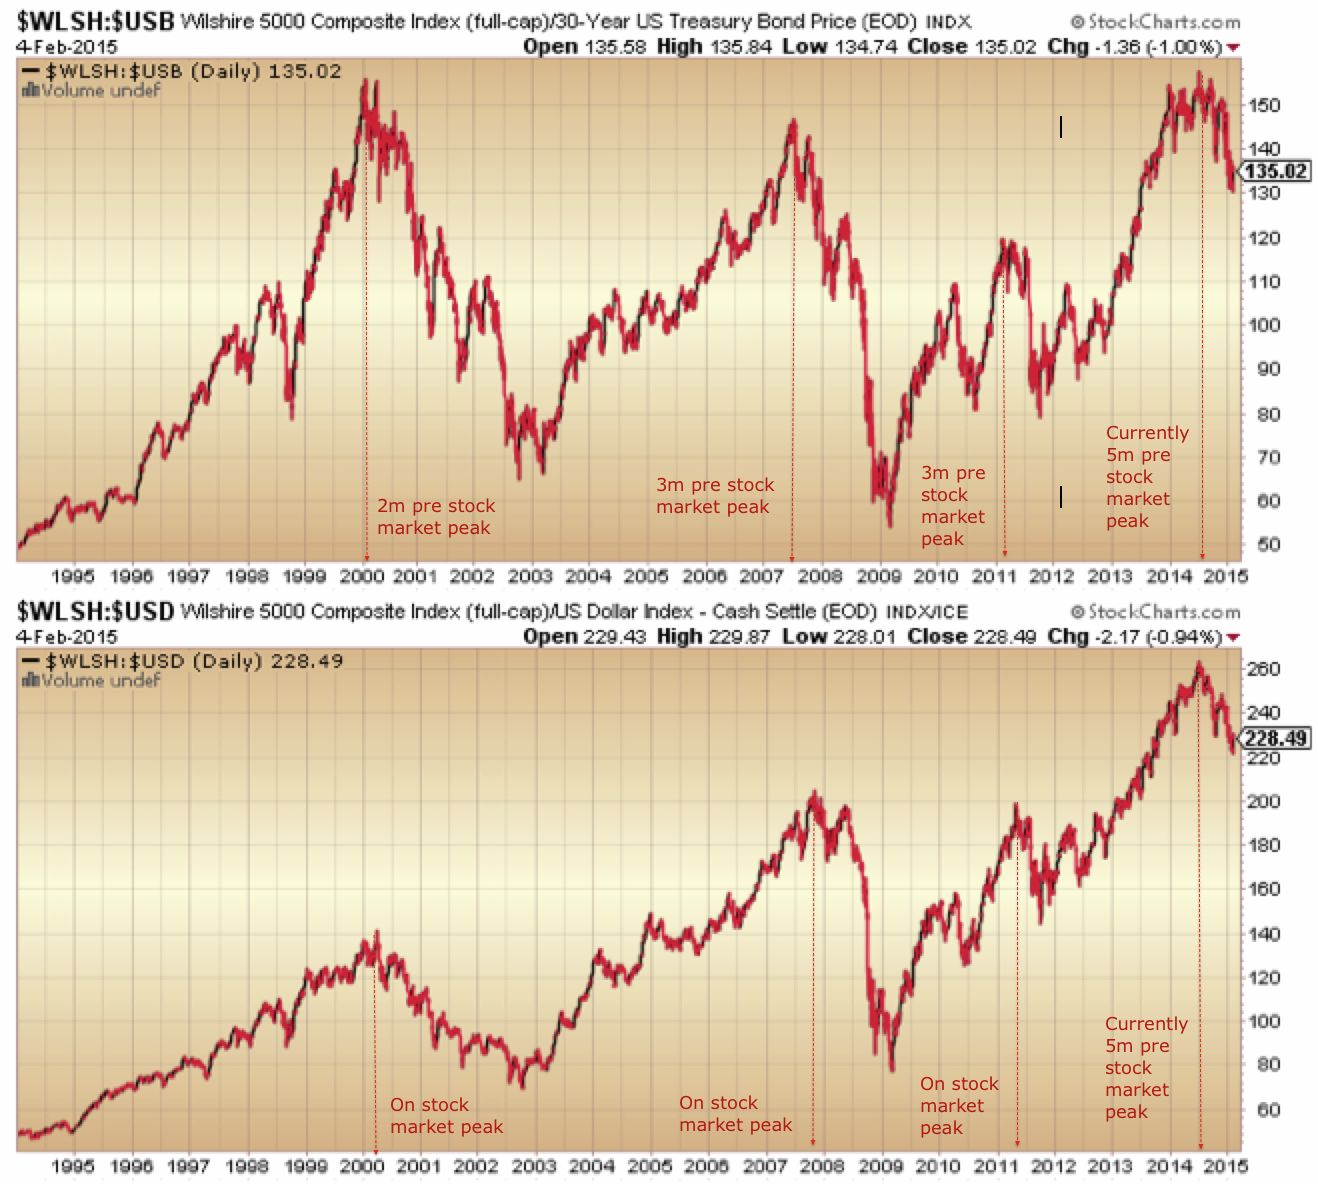
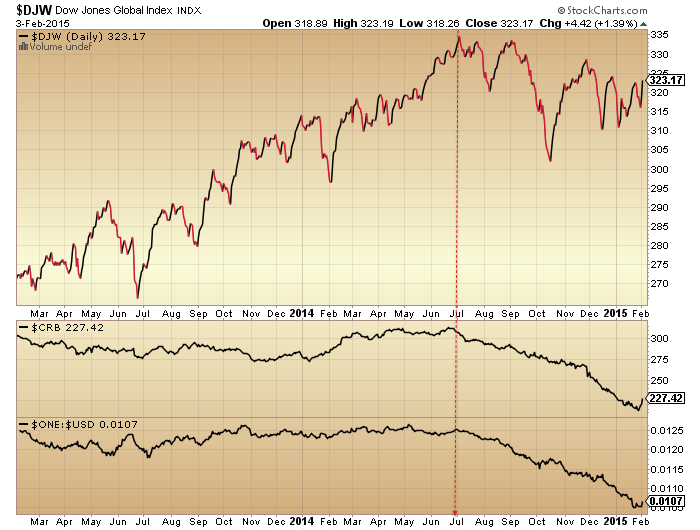
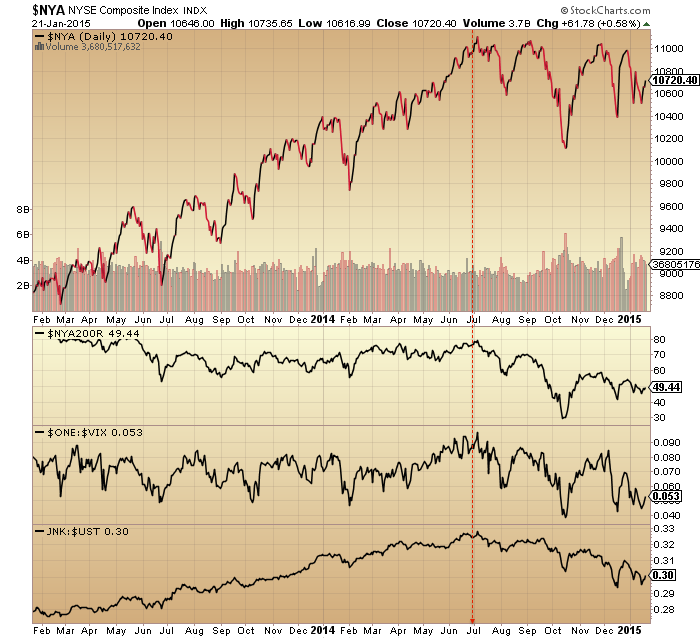
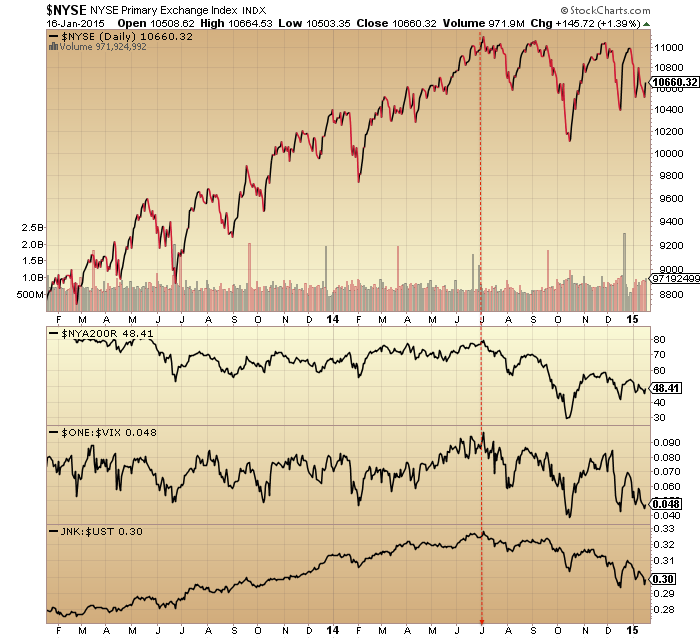
1. US stocks to bonds and stocks to dollar ratios have tentatively turned down again, maintaining the downtrend since, and real peak at, mid-2014:
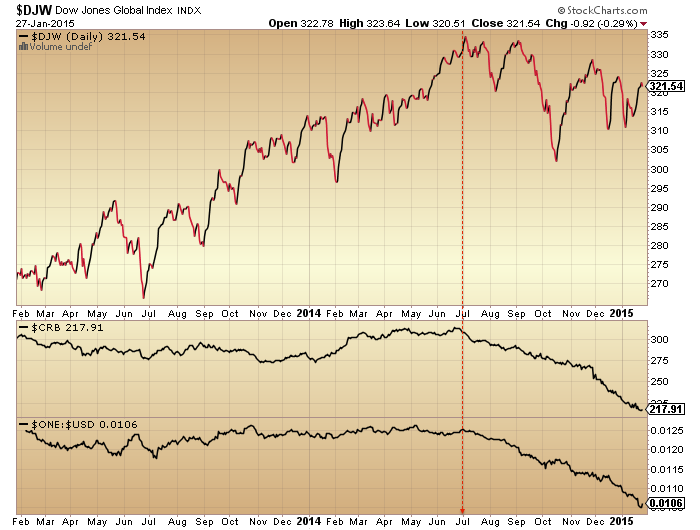
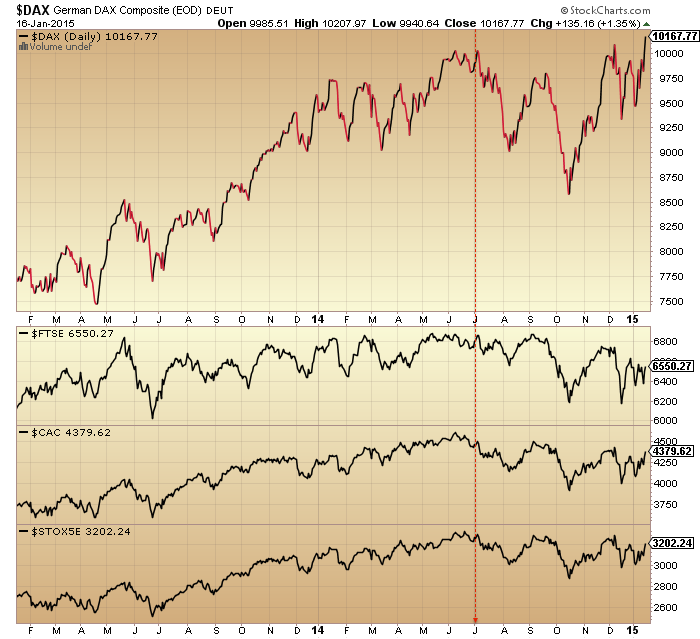
1marc21Source: Stockcharts

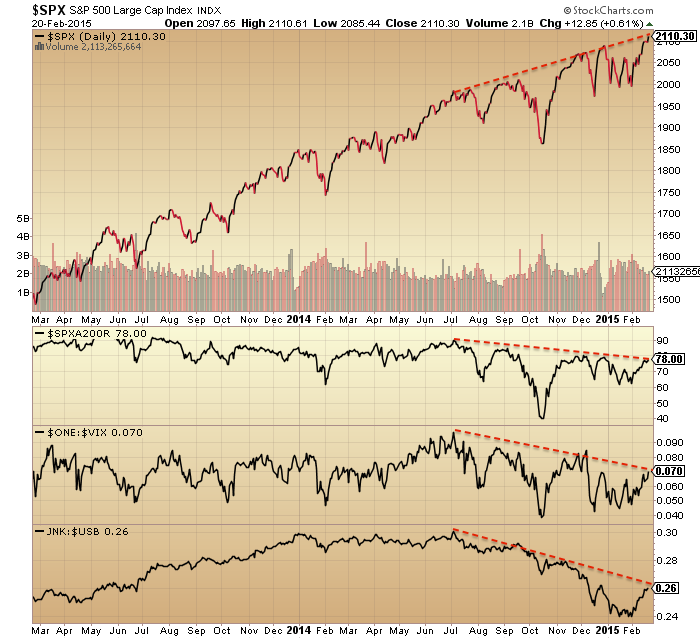
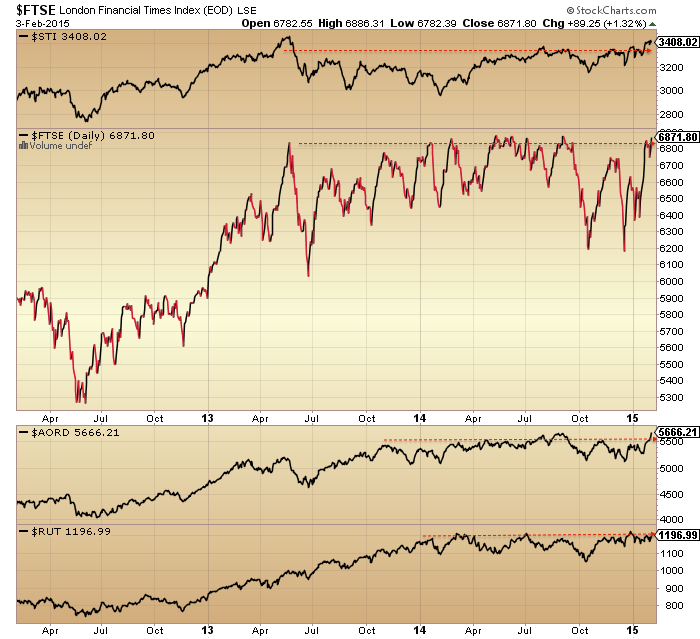
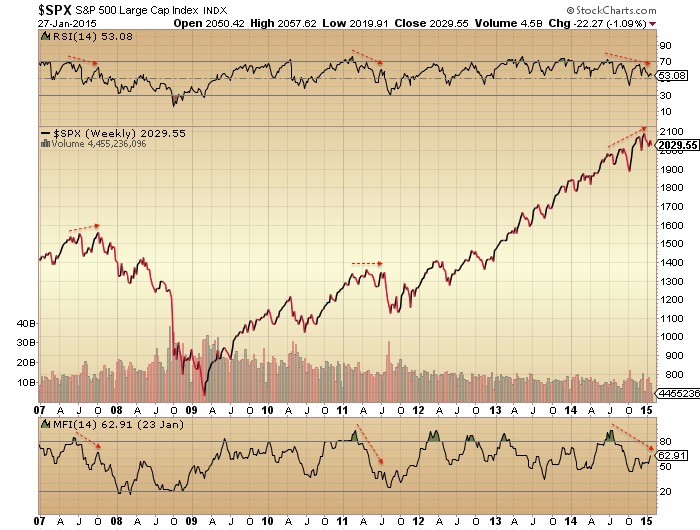
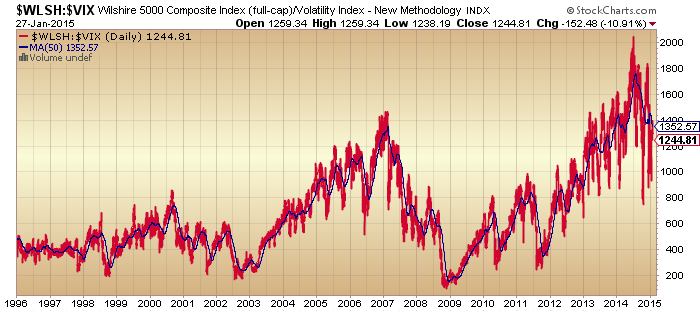
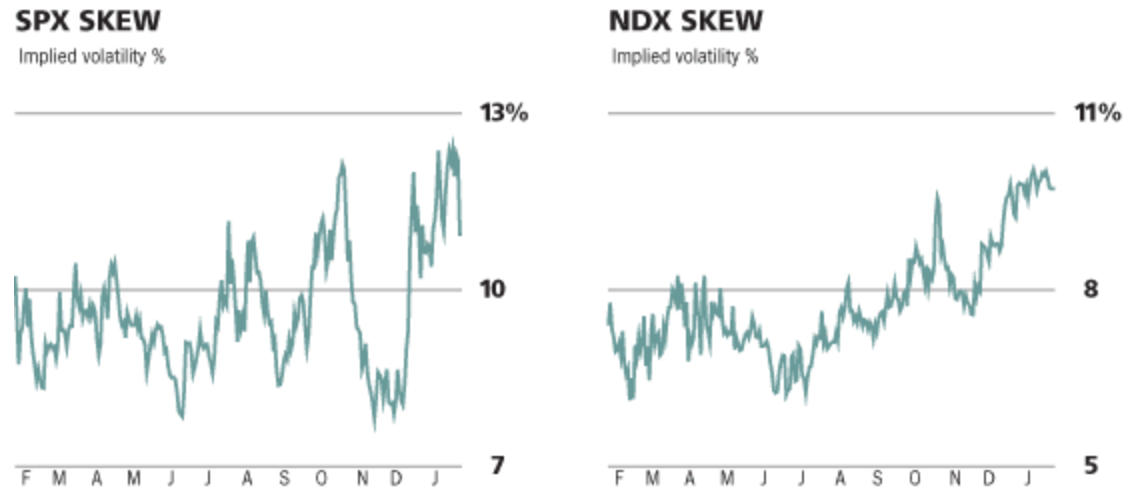
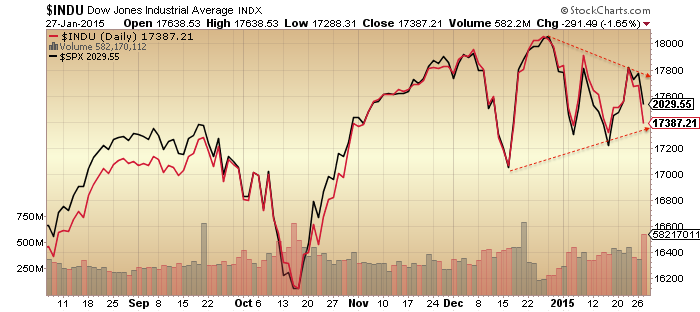
2. SP500 is at rising resistance, whilst volatility, breadth and risk-off divergent indicators are at downward resistance. An appropriate point for a turn if it is to occur.

1marc13
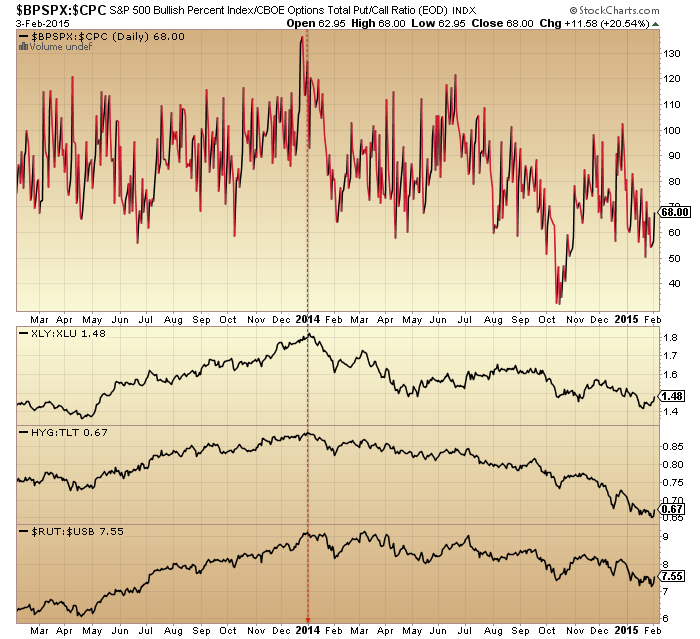
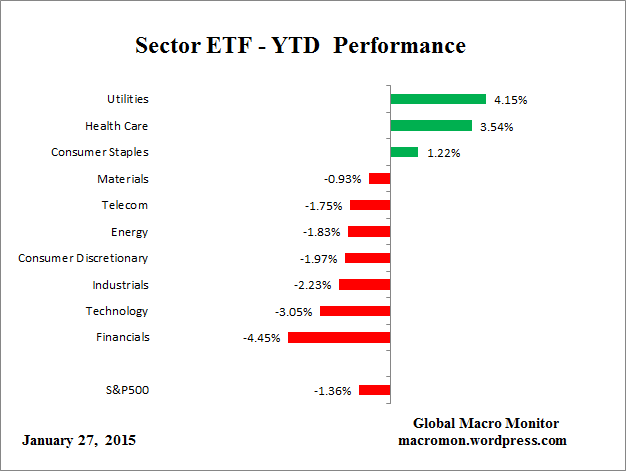
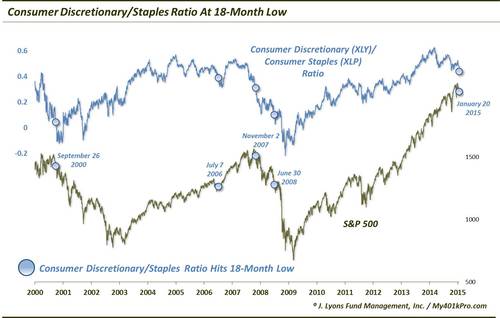
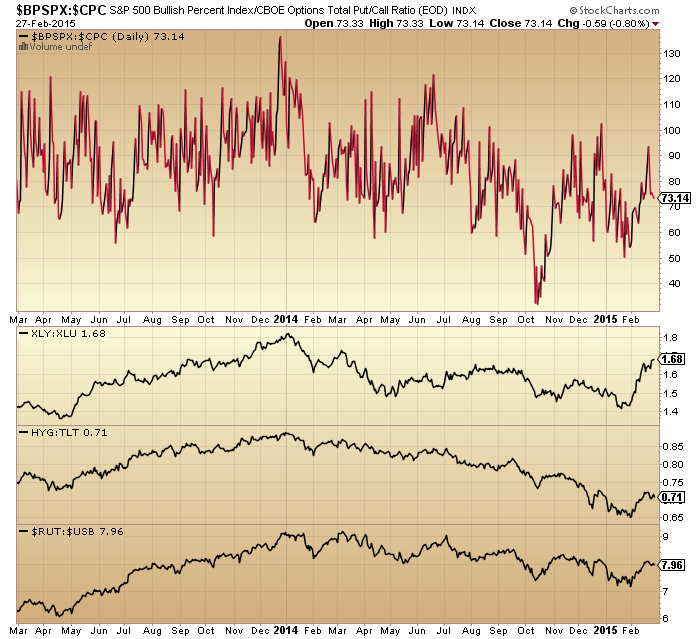
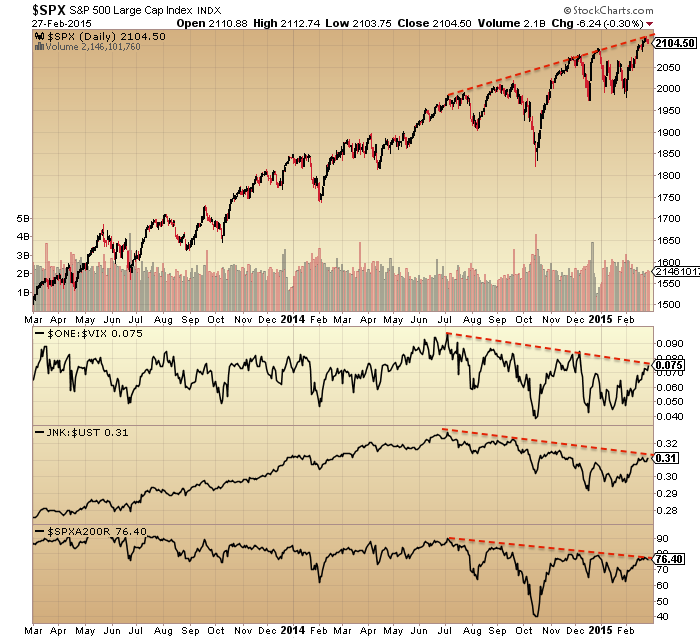
3. Four more risk-off measures below are in downtrends since the turn of 2014. Other than XLY:XLU they also give the appearance of turning down again at resistance now, keeping those downtrends in tact.

1marc20

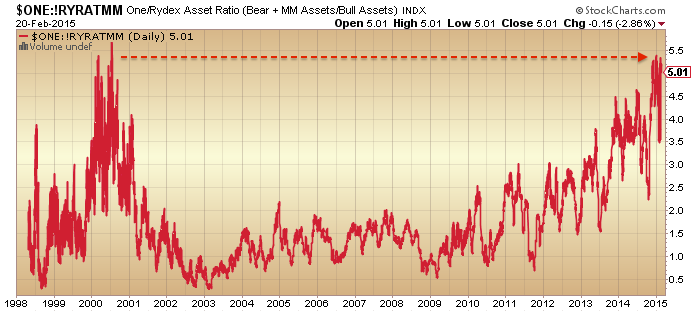
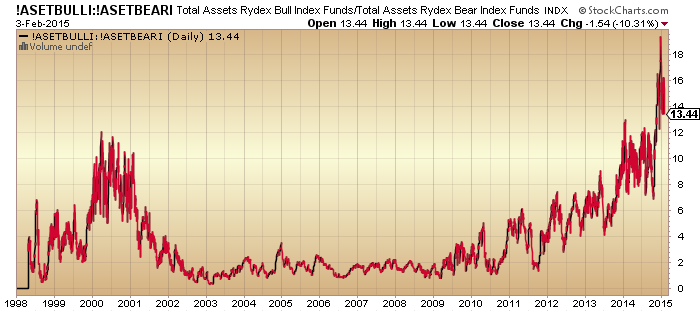
4. At the same time, Rydex allocations are back at their peak:

1marc8
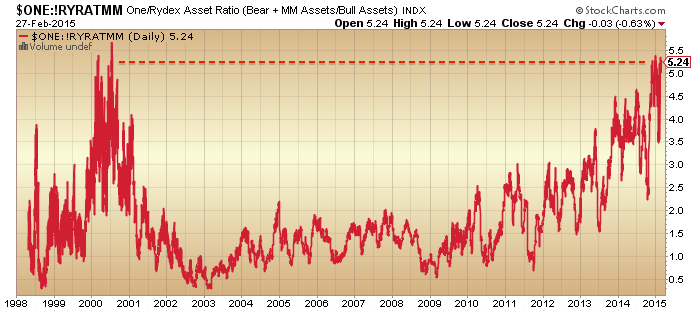
5. Plus, investors intelligence sentiment is also back at its peak:

1marc10

 Source: Not_Jim_Cramer

1marc2

Source: KingWorldNews

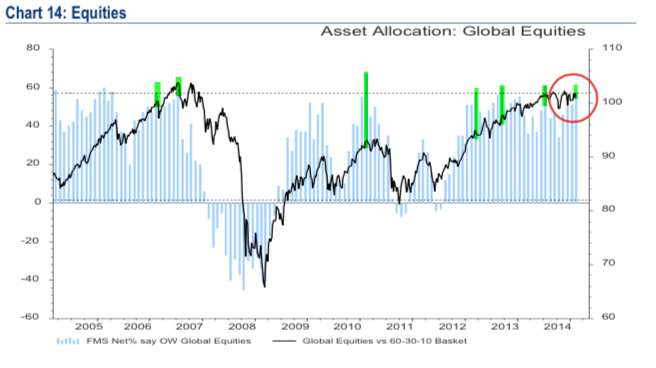
5. Fund manager allocations are back at their peak too:

1marc4Source: Fat-Pitch

6. And NAAIM exposure is also back testing all-time highs, with 99% long exposure currently.

1marc1All four of those sentiment/allocation angles suggest a correction should now come to pass, even if only short-lived or shallow. I’ve highlighted on the NAAIM chart that we previously saw NAAIM diverge before we saw a more significant correction – something to bear in mind.

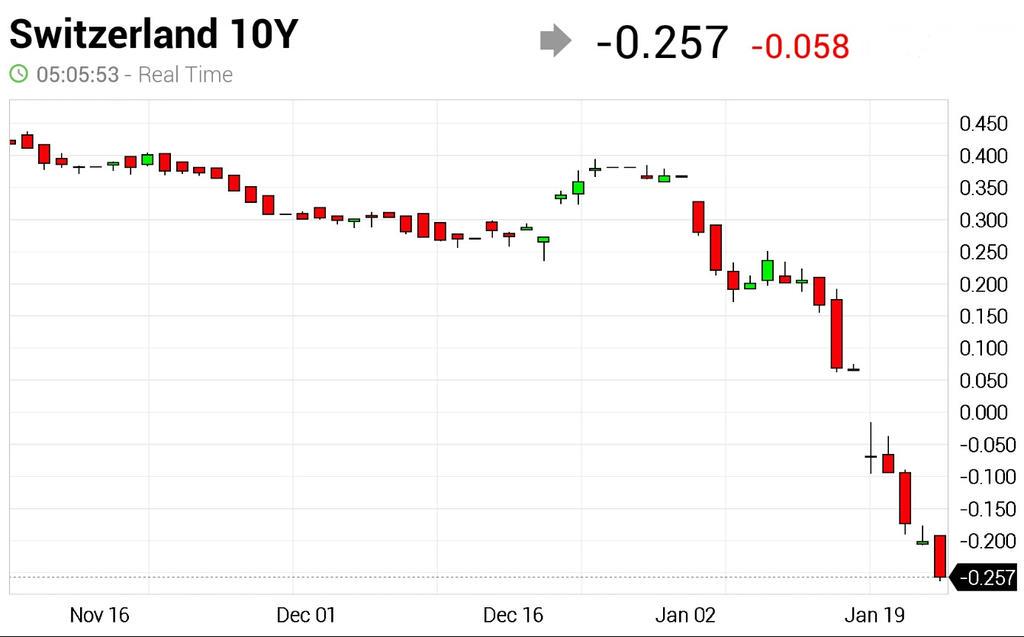
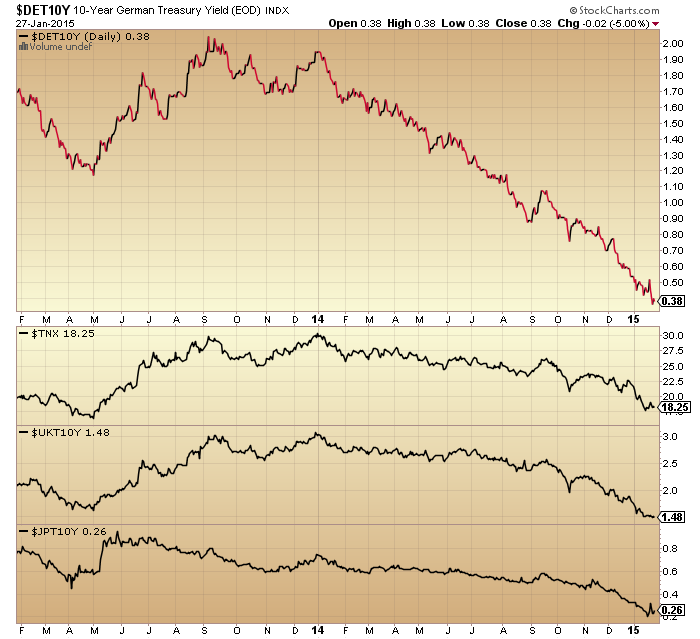
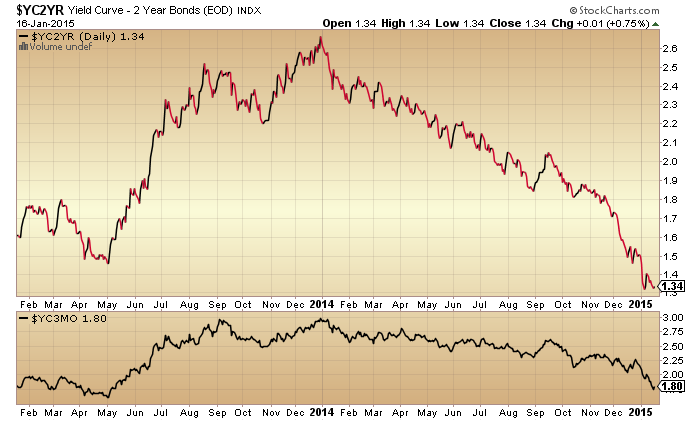
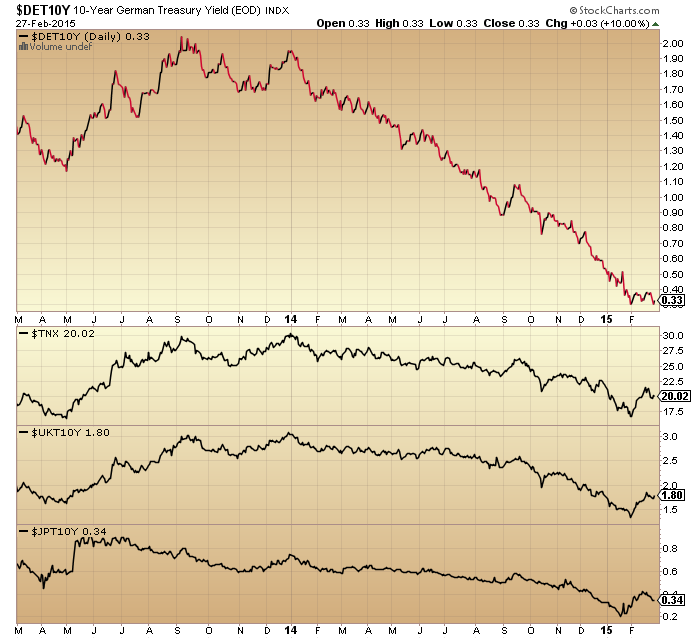
7. Bonds yields appear to be rolling over again, which would also fit with a stocks pullback.

1marc12
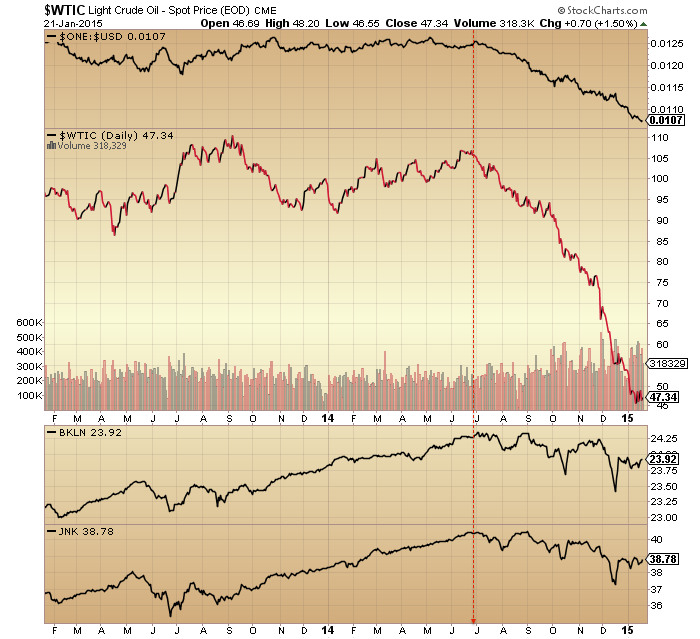
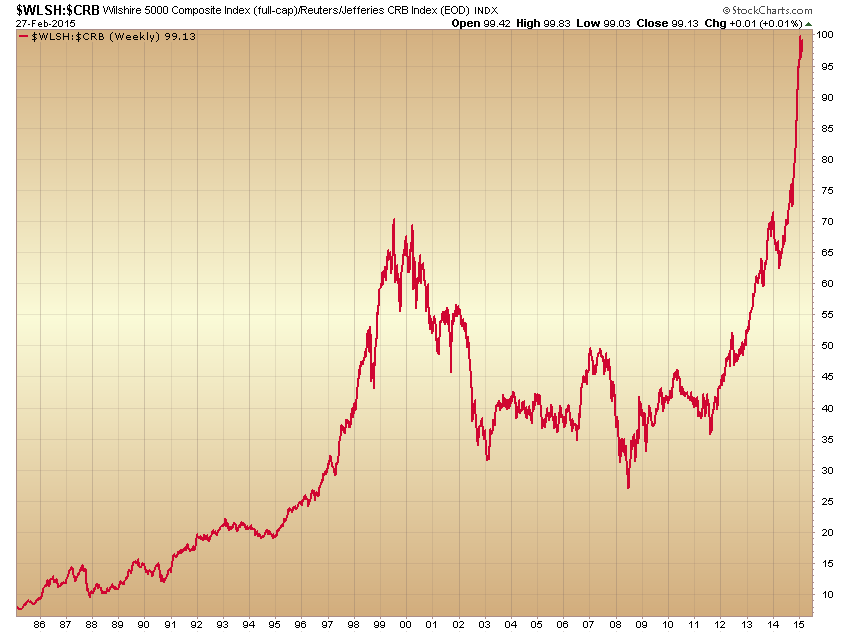
8. Stocks to commodities, suggested by Simo, looks exhaustive and ripe for reversal.

1marc15
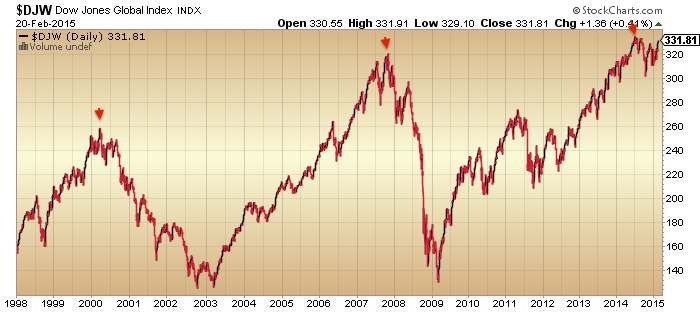
9. Margin debt declined in January, keeping the peak to date as February 2014. Meanwhile, leveraged loans have risen again and are well correlated to the Dow Jones World stock index, namely either at the end of a topping process or heading for new highs.

1marc9

 Source: DShort

1marc40

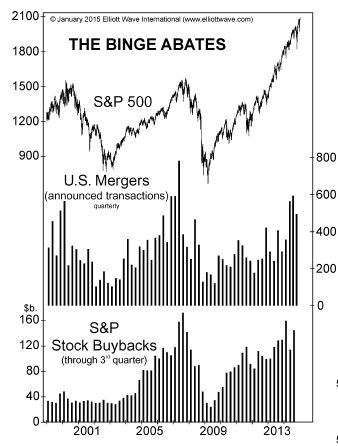
10. Buyback announcements, indicated by Allan, hit a new record. The previous spikes of start-2006 and mid-2013 corresponded to consolidation periods in the SP500, whilst the 2008 ones were contrarian.
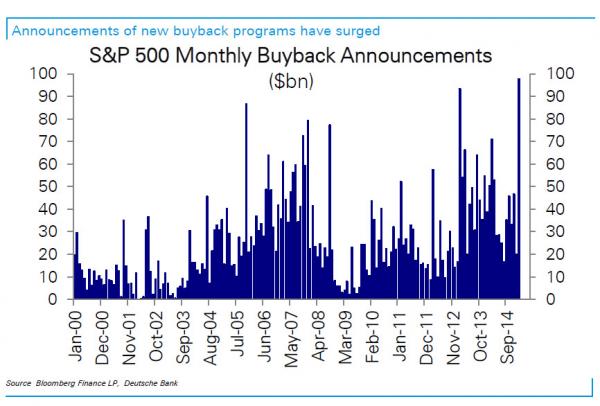
1marc13

Source: ZeroHedge

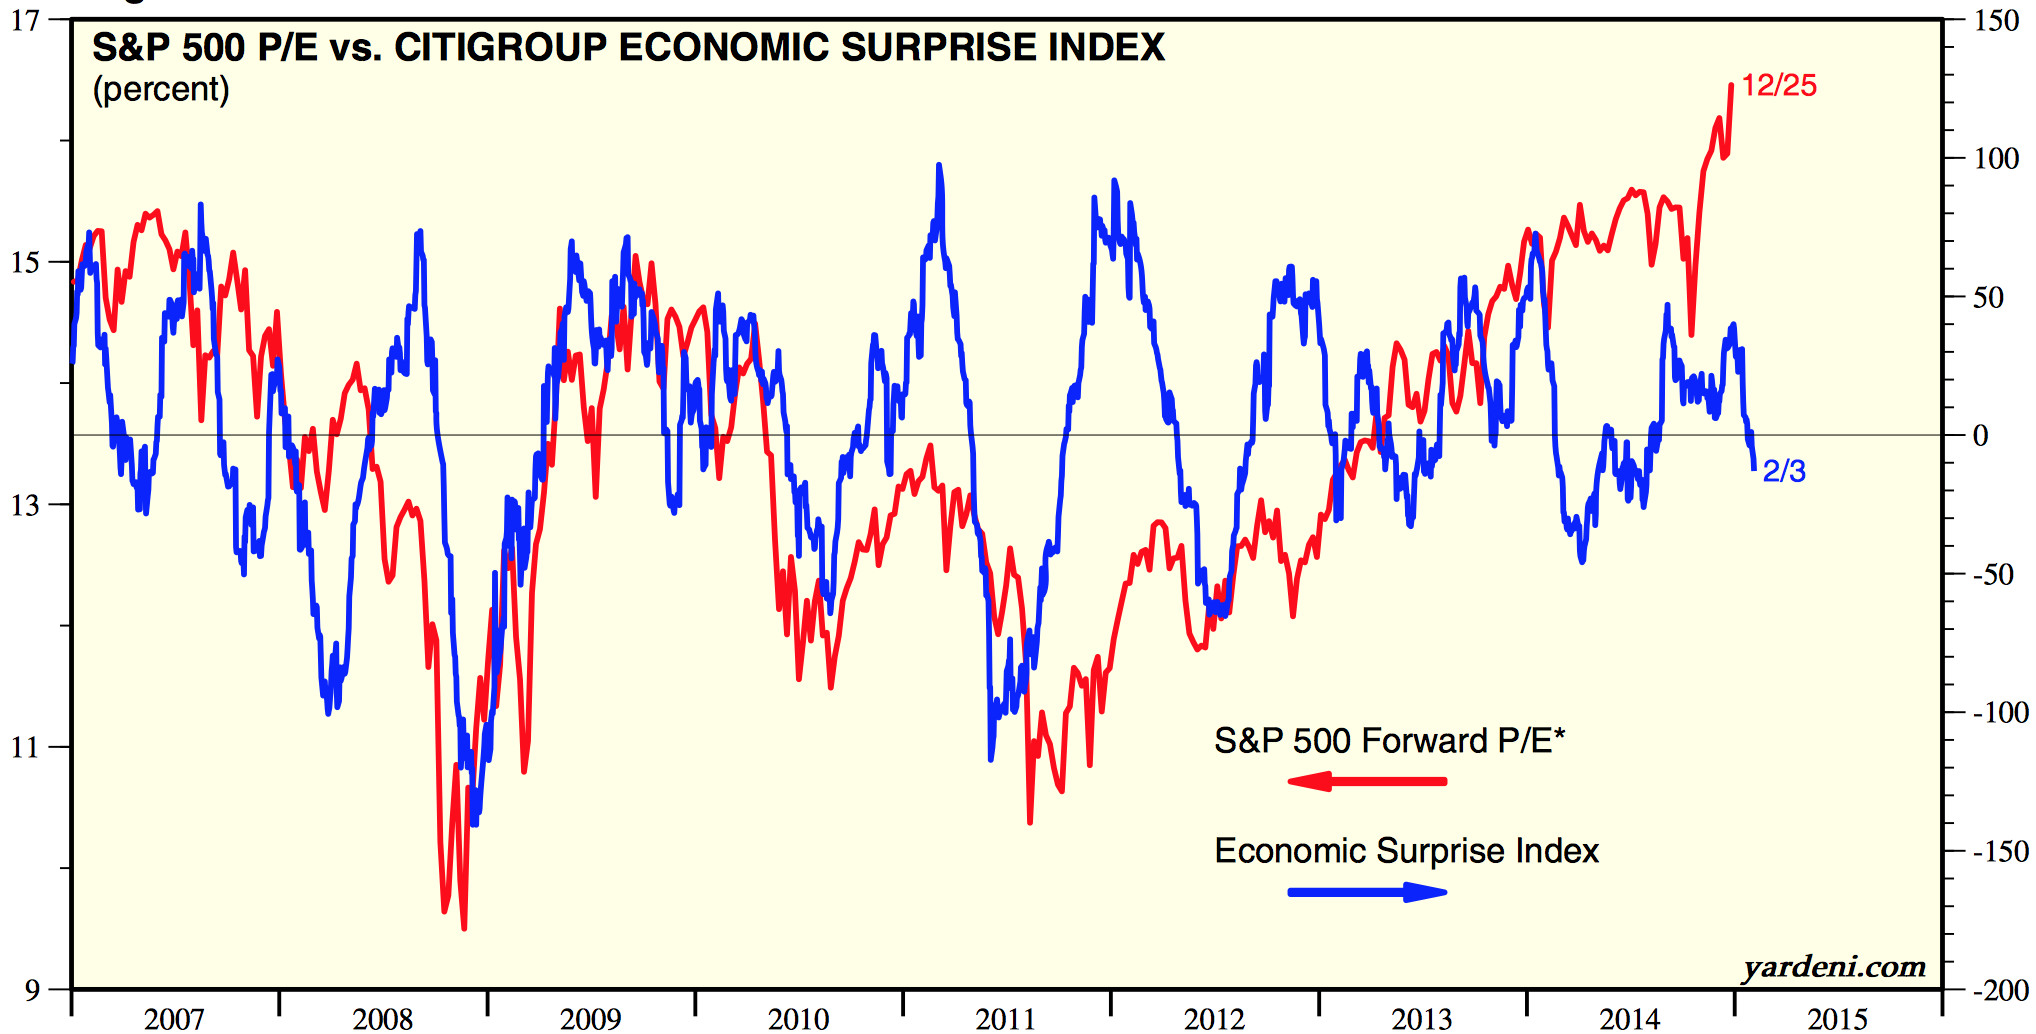
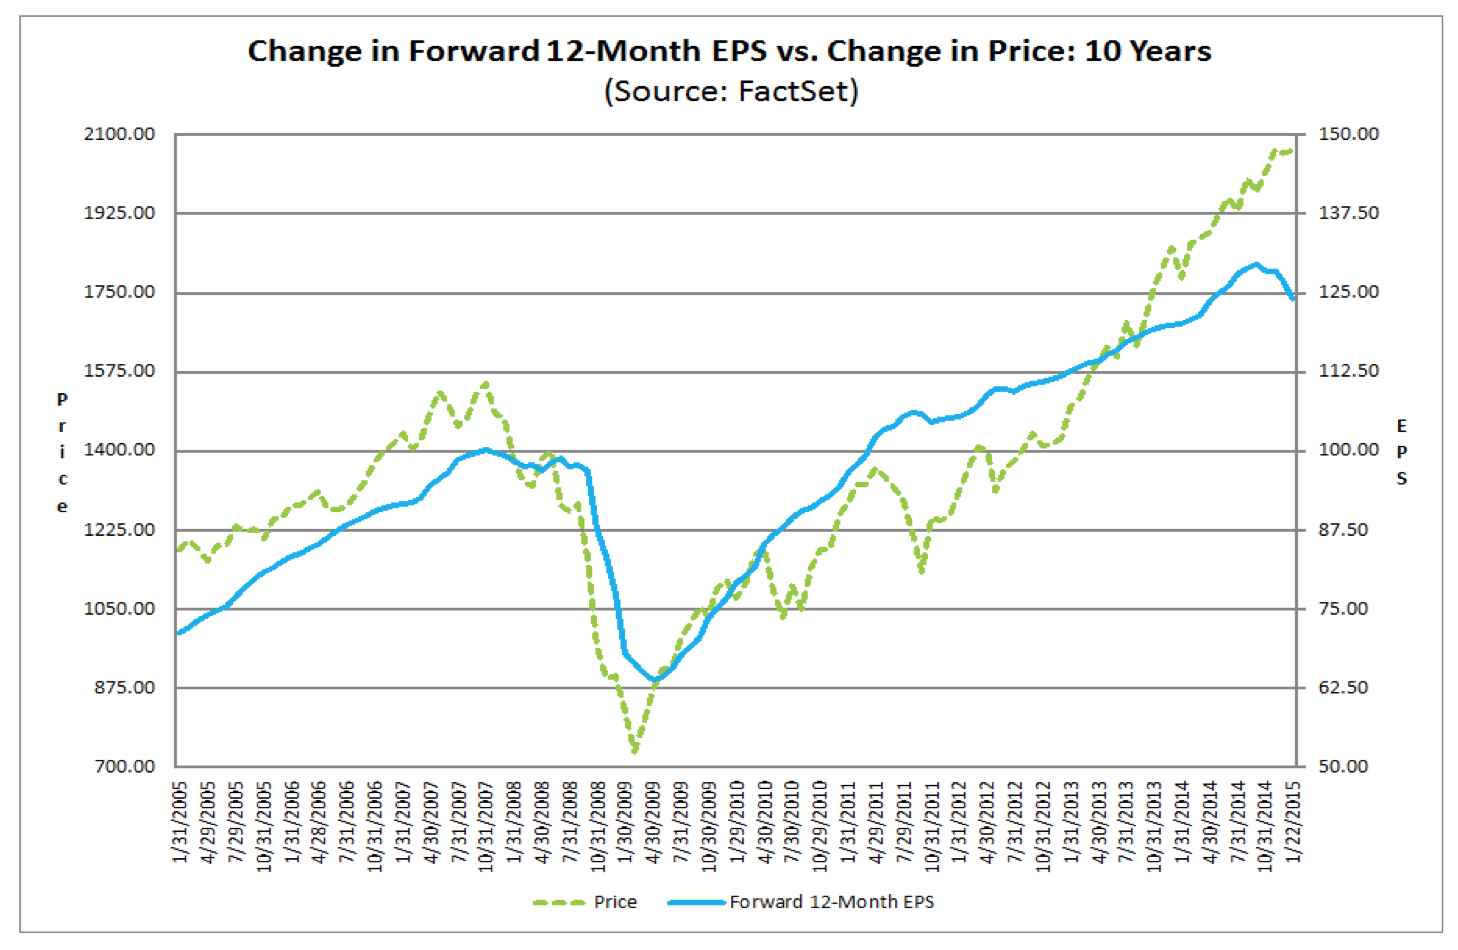
11. The negative divergence in earnings projections is shown in two ways here: arguing for a sharp correction in SP500 prices and the ushering in of a recession:

1marc9 1marc11

Source: Not_Jim_Cramer

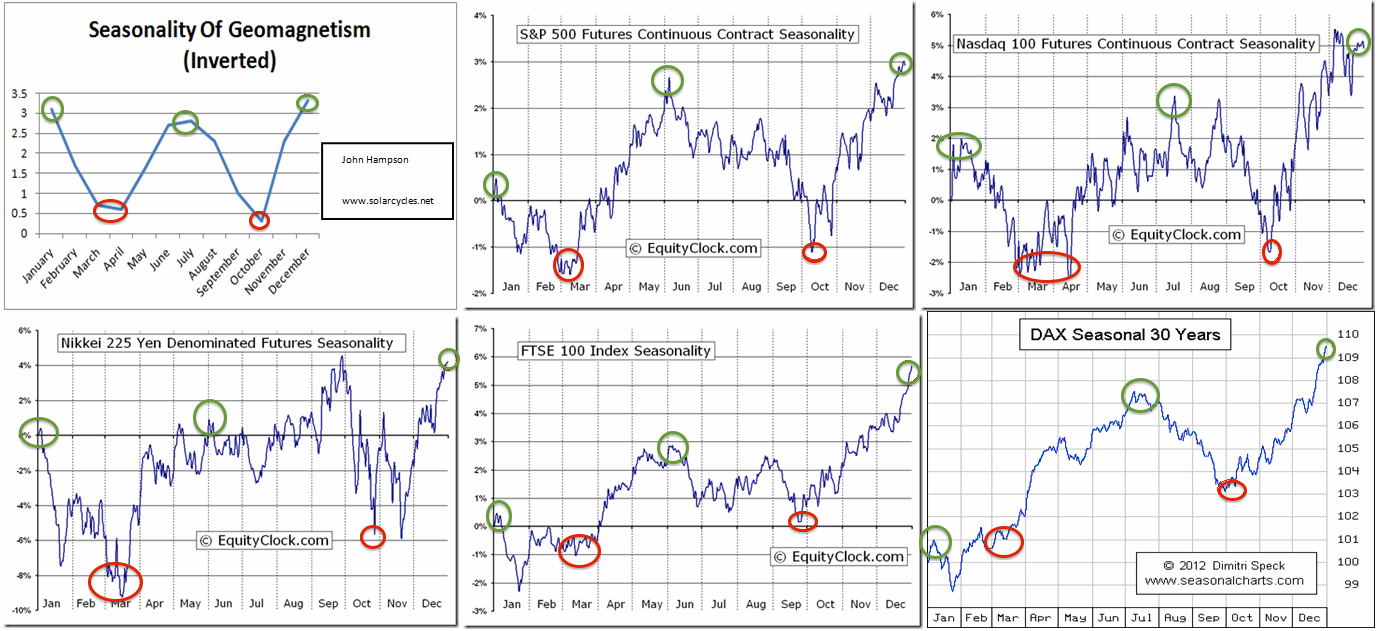
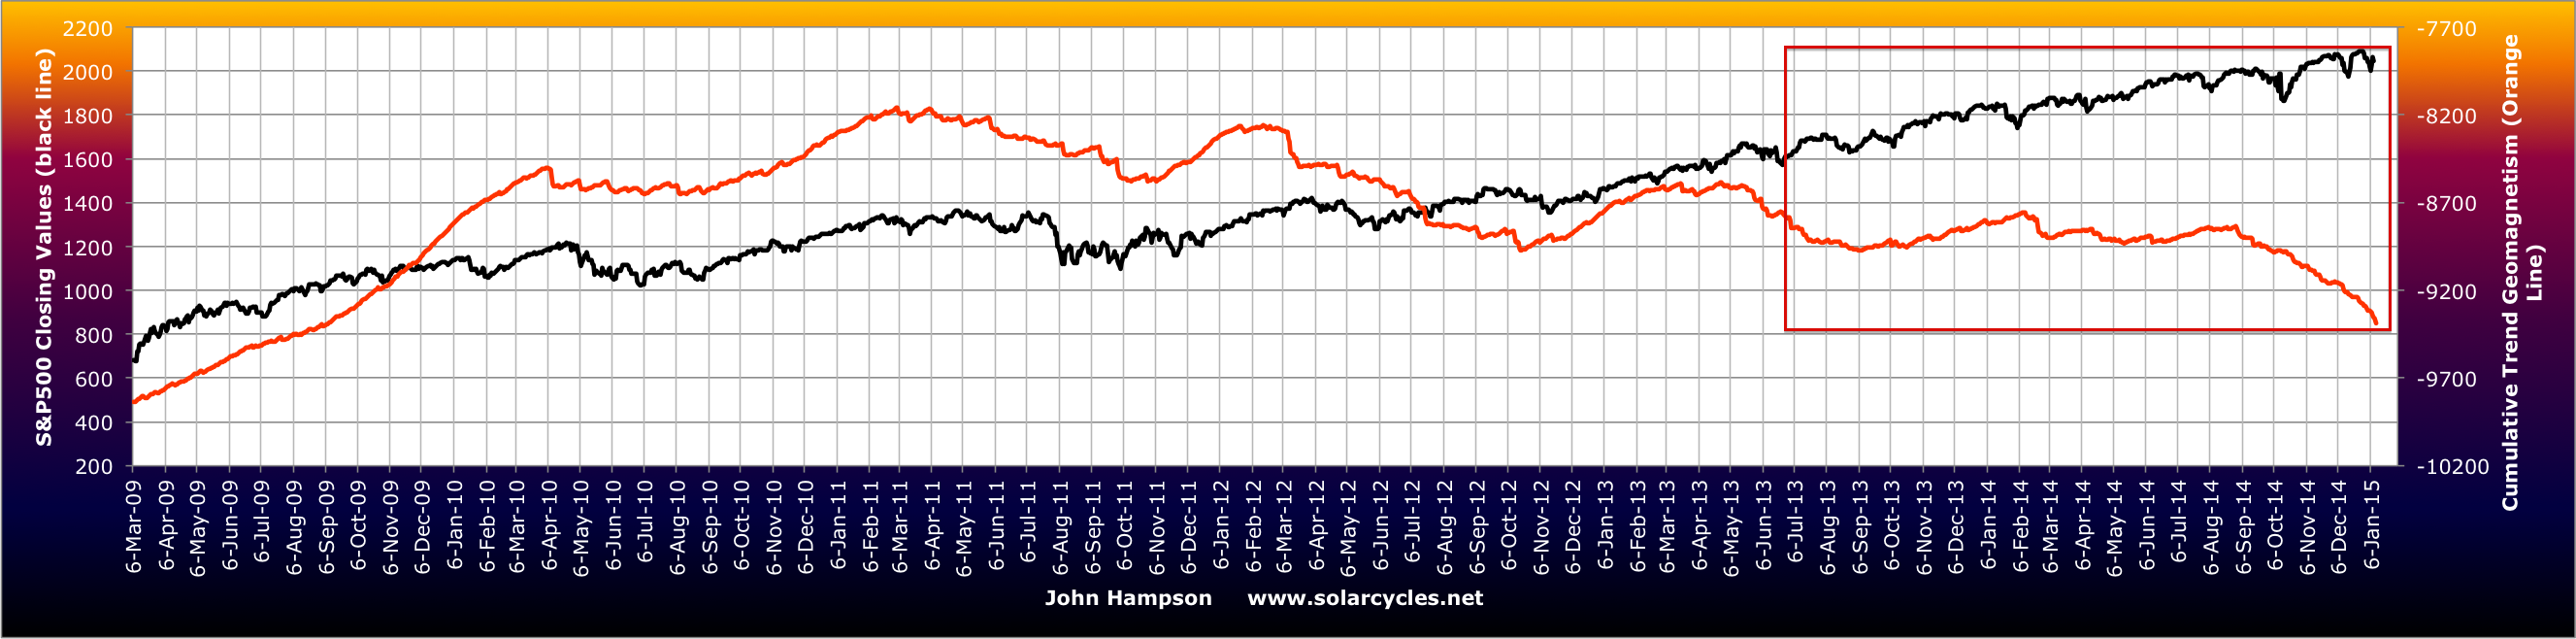
12. There is downward pressure into the full moon of March 5 and we have geomagnetic storming in progress:

1marc30

 Source: NOAA

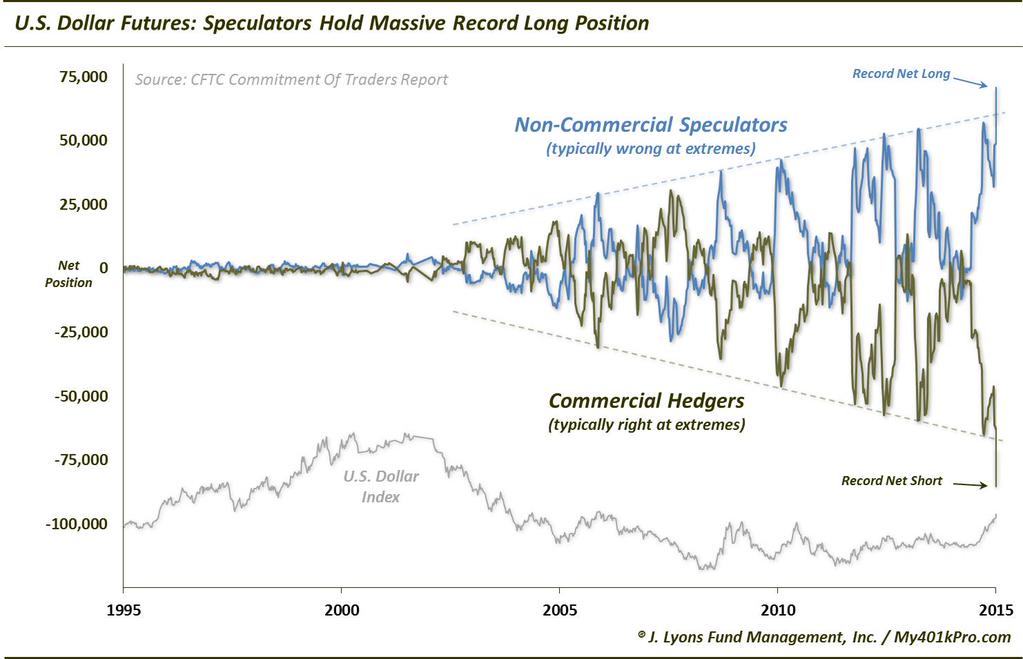
In summary, the current saturation in sentiment, allocations and exposure, together with what appears to be a renewed roll-over in various risk-off, breadth and volatility measures, sets the scene for a price correction in stocks, assisted by the twin negative pressures of lunar phase and geomagnetism. The triple fundamental negatives of earnings, economic surprises and leading indicators provide the justification, and the potential short term basing in gold and exhaustion in the dollar both cross-reference.

A price correction in stocks may or may not be ‘significant’. Cumulative advance-declines and NAAIM trend would both argue that prices need yet to continue higher whilst both make renewed divergences. On the other hand, a host of other indicators continue to pin us at the very end of a topping process that is 12 months old.

I’m going to start a short position again tomorrow morning playing for this correction. I opened long gold again already. We’ll then see how it develops: short and/or shallow, or increasing in momentum and more significant. If there is no correction and stock prices march higher, then by a process of elimination we can increasingly point to the historically abnormal: the dark pools and primary dealers. However, even if we assume an abnormally large influence on their part, they are still logical and self-interested. The case is strong for a near term correction or consolidation.

Weekend Updates

1. US stocks to bonds and to dollar ratios continue to show a clear top mid-2014:

21febu9 21febu11Source: Stockcharts

2. Dow Jones World stock index shows a peak the same as the above, but that peak may be under threat:

21febu43. The SP500 has broken upwards to new highs but breadth, volatility and junk bonds continue to show divergences. The resistance levels in all four are now being tested.

21febu6

4. Various risk measures remain in downtrends since the turn of 2014, though the cyclical to defensive sector ratio has repaired the most in recent weeks.

21febu55. Sentiment and allocations remain at extremes like previous major peaks. Here fund managers and Rydex:

21febu21

Source: Fat-Pitch

21febu13

6. Buybacks and mergers have pulled back from their peaks:

21febu25

 Source: Elliott Wave

7. Bloomberg financial conditions remain in a downtrend since mid-2014:

Screen Shot 2015-02-21 at 16.08.18

Source: Bloomberg

8. Earnings growth forecasts have turned down, mirroring the 2007 peak, but price has yet to conform:

Screen Shot 2015-02-21 at 16.13.53Source: Factset

9. The rise in share prices contrasts sharply with current trends in earnings and economic surprises, captured here:

Screen Shot 2015-02-21 at 15.41.10

10. The economy is showing signs of recession as evidenced here in wholesale inventories versus sales:

21febu25

Source: TheEconomicCollapseBlog

11. And leading indicators remain in negative growth and in the big picture continue to show a secular bear market:

21febu1

Source: Dshort / Ecri

12. Money has been pouring steadily into bonds, with the stocks:bonds ratio in decline since mid-2014.

22febu8

In summary, we see a hallmark, typical, run-of-the-mill major topping process, that fits with the smoothed solar maximum of April 2014. Firstly, the mania and excess is evident in valuations, sentiment and allocations. Secondly, between the start of 2014 and mid-2014 various indices, ratios and indicators made their telltale breakdowns and divergences. Thirdly, leading indicators, economic surprises and earnings have all turned down. Fourthly, buybacks, mergers, margin debt and leveraged loans have all stalled or declined. YET, despite all this, price has not conformed, so there is something missing from the analysis.

I don’t subscribe to the view that the solar maximum is producing an extended mania like in 1929. We see in the charts above that a typical underlying topping process has occurred centred around last April’s smoothed solar maximum. It all fits as expected. But something is keeping nominal prices rising. So what’s different this time? By a process of elimination we do get to the influence of dark pools and primary dealers against the backdrop of QE and ZIRP.

The dominance of the dark pools over the main exchanges the last couple of years is shown here:

21febu28Plus the leakage from the primary dealers (from who the central banks buy bonds with their QE money) into the stock market. 80% of QE money may be parked as excess reserves but correlations and reports suggest some of the rest finds its way into the stock market.

21febu30

It’s not easy to quantify either influence accurately. However, all historic manias saw leverage rising right into the peak. ZIRP enables the leverage here, but it’s not increasing through margin debt or leveraged loans. Speculation, as measured traditionally, peaked out with the solar maximum mid-2014. All things considered, it would make a lot of sense if, as BC said, several of these major players are driving price and using increasing leverage to do so, as that then explains the anomaly. It would mean the stock market has gone from being fair game governed by natural forces, to one in which – temporarily at least – a few large hands are controlling price to some degree.

If so, it doesn’t change the situation with earnings or economy which are moving the opposite way. It doesn’t stop the bulk of market players behaving as normally post solar/speculation peak, as shown in the charts. I don’t believe it changes the outcome, only delays, the crash. If the bull market has become highly concentrated in a few major hands using dark pools and leverage, playing a game of chicken in the face of valuations, earnings, concurrent and leading indicators, then it would take a broad improvement in all those to sustain it, otherwise the risk is the market collapses at any time as one or more players reverse, in self-interest.

We ended the week cementing the breakout in stocks, and I keep my options the same. Either stocks reverse down from the current marginal new highs, heading for seasonal March/April lows and maintaining the real stock market peak as July 2014 – or – stocks move higher in a final mania that extends to the summer. If the latter looks to be transpiring I won’t be playing the long side. I consider it far too dangerous as a collapse could occur any moment. Rather I would bide my time and short again when the pop looks to be occurring. I continue to watch gold for evidence of a renewed (and associated) move to safety, plus the extremes in sentiment and positioning pro-dollar and anti-euro look set for reversal at any time, which would likely fit with reversals in stocks and gold.

For the time being I will only be posting at the weekend. I have engaged in new projects during the week whilst the irrationality of the markets persist. But I remain poised to attack once they finally break, continuing to monitor each day and read your contributions on the board.

Behold

New highs in US equities despite…

1. Valuations on a par with the 1929 peak

2. Sentiment extreme lopsided (II 3.5x bulls vs bears, NAAIM 84% bulls)

3. Allocations to equities on a par with 2000 peak (household, fund manager, Rydex)

4. The solar maximum speculation peak being behind us in April 2014

5. Leverage having peaked out around then (margin debt Feb 2014, leveraged loans July 2014)

6. Multiple negative divergences in place 6-12 months (shift to defensives, breadth, financial conditions)

7. Economic surprises negative

8. Leading indicators negative

9. Earnings growth forecasts for H1 2015 negative

10. Buybacks peaked in Q1 2014

This is already so anomalous that I can’t offer much more by way of analysis. If there is a blow-off top about to unfold, then what is the fuel, given the extremes in allocations and sentiment and the stall in leverage and buybacks, plus the demographic headwind making for a shrinking investor pool? I believe it would have to come from leverage breaking its 12m ceiling and going to all-new extremes. But why would that occur, given the state of economic and earnings indicators versus valuations? And given we are approaching 12 months post solar maximum? It makes no sense.

I can still only side with logic, which says the real peak was mid-2014 and that this still represents last gasps of a topping process. That would mean nominal stock indices make marginal new highs here but then break down.

Screen Shot 2015-02-05 at 07.09.06

On the bullish side, there have been a couple of supportive developments. Cumulative advance-declines have broken upwards decisively, as they did in February 2014. Plus, cyclical sectors have taken over outperformance from defensive sectors now in 2015. These two developments alone certainly don’t overcome the list above, but, if stocks can now hold up whilst we go through the seasonal lows of March and April then we could perhaps again see economic surprises and earnings start to turn up again. In short, we could continue to see the market advancing in positive economic and earnings periods but not falling in negative periods despite the record lopsidedness, negative divergences and so on. Go figure.

That would in turn likely postpone the bear kick-off until the Autumn/Fall. I can’t compute that, but we have to consider the majorly anomalous here. Of course this can’t continue indefinitely. If stocks do somehow take off again here, then valuations, leverage, allocations and divergences will become yet more extreme, perhaps all-time extreme, making the subsequent crash even bigger and even more pressing.

But survival is key. So I have stepped aside and taken off my positions whilst we see how price action now unfolds. If we see a blow-off mania now somehow take hold, then I don’t want to hold short through that. If, instead, logic reigns, then stocks should only make marginal highs here on negative divergences and then be dragged down to new 2015 lows. We have the new moon on the 18th Feb into which I expect stocks to rise. Then we have the seasonally weak window into March and April. So either stocks make marginal new highs and then fall post 18 Feb into Mar/Apr to new 2015 lows, or they hold up and lift off through those seasonal lows heading for even higher highs in the summer. I will be looking to add back positions on evidence of the former unfolding.

Cross-market, gold’s behaviour will be another tell. If the bottom is in then gold should start to take off again here, making for a compelling higher low. Continued weakness and even a new low would postpone the whole process.

I still can’t regret my analysis, because it is as comprehensive and multi-angled as I could make it, and I still think the only logical outcome is that we do indeed look back on a topping process that kicked off at the start of 2014 but took a long time to play out. I can’t compute anything else, because I bring together such a wide range of angles and draw heavily on ‘fact’. However, it’s been a humbling 12 months and there is not yet sufficient clarity or hindsight to really diagnose it.

I host the website but you guys have created an excellent board, which is always a great read. Different opinions and approaches but there is a good balance and a lot of quality input. So thank you to all who comment.

So, let’s see now whether stocks break out decisively or fail at marginal new highs, whilst watching how gold performs.

Not So Different After All?

Comparing the 2000, 2007 and 2011 peaks to 2014-15.

Taking 2000 first, as that was the last solar maximum pre-2014 and therefore the most relevant, I’m using several measures that stretch back that far and show divergences pre-peak, namely Nasdaq breadth, 10 year treasury yields, cyclical to defensive sector performance and all set against the Dow Jones World stock index. Clear topping process progression and timings are labelled on the chart:

6febr20

Source: Stockcharts

Now here is 2014-2015. Amazingly it is almost identical in progression and timings in both the stock index and the indicators.

6febr21The only difference is that the July/Sept peaks in 2014 exceeded the solar maximum peak in nominal terms whilst in 2000 they were lower peaks.

Here are the 2007 and 2011 peaks to complete the comparison. No solar maximum in these two years, but otherwise a similar topping process with leading divergences in the indicators and a notable peak in July every time.

6febr23 6febr25With margin debt for December finally released here is the picture for net investor credit:

6febr1

 Source: Doug Short

We see another leading indicator for the 2000, 2007 and 2011 peaks, varying from 2 to 6 months on the monthly SP500. Currently we have a 4 month divergence versus the December 2014 existing SP500 monthly high, fitting in the historic range.

Lastly if we compare stocks:treasuries and stocks:dollar, we see additional leading indicators in a relative defensive shift with 0 to 3 month lead time for the 2000, 2007 and 2011 peaks.

Screen Shot 2015-02-05 at 07.09.06

Both measures show a 5 month divergence on our current December 2014 Wilshire 5K high. Yet both measures tie in exactly with when the Dow Jones World made its peak-to-date, July 2014.

All this strongly suggests the ‘real’ peak in stocks occurred back in July 2014. So how can we square fresh nominal highs in European indices and several US stock indices challenging for new all-time highs again? We can square it if European indices are making a final blow-off top and if US indices fail to make new highs here. Back in 2001 the DJW index turned down again at the start of February, heading for Mar/Apr lows, and that fits with the geomagnetic seasonal roadmap that I have presented before. It really means stocks must be repelled back down here, whilst gold ought to break upwards from its consolidation of the last 2 weeks. Drawing together time and price factors I suggest we have just a few trading days for this to transpire. As per my last post, if price and indicators start instead to break upwards then the picture changes and breaks with the logical case.

The Old Rules

Extremely stretched valuations, highly lop-sided sentiment and allocations, excessive leverage, long-standing negative divergences, persistent shift to defensives, negative leading indicators, disappointing earnings, declining financial conditions: these are some of the ‘old’ rules that dictated stock market peaks. Yet, many months in their presence, equities still haven’t dropped in any meaningful way.

Looking at the SP500, there has been no fall of even 10% in the last 2 years.

4febr10

Source: Rachael Shasha

Yet those indicators/rules would historically dictate a fully-fledged bear market. Add in the smoothed solar maximum timer, which now looks fairly definitively April 2014, and the continued levitation is even more surprising.

Screen Shot 2015-02-04 at 07.57.39

Source: Solen

Do the old rules still work? I still believe they have to. There are too many different angles amongst them for them to now all be redundant, even with central bank intervention distortion. But this really feels like the last chance for them to hold.

A selection of global stock indices shows what may turn out to be a long distributive topping process, if this isn’t to be a consolidation by time.

4febr1

Source: Stockcharts

A selection of risk-off negative divergences in play for a year would echo this:

4febr34febr9

If we argue the correction or ‘bear’ has been by time not price then such indicators would now be poised to break upwards again. The problem with that angle is that there has been no resetting of allocations, leverage, valuations, sentiment and various negative divergences. Corrections by time gradually neutralise such indicators to refuel the bull, yet this has not happened.

4febr5A look at breadth shows what appears to be an initial attempt at a stock market peak at the start of 2014, followed by a breakout to the upside. We have then had a second attempt at a peak in the last 6 months, but potentially NYAD is showing another breakout which would reset the topping attempt again.

4febr7This would fit with developments in European stocks indices which are breaking out and look positively bullish. Potentially, the Eurozone’s QE and improving leading indicators could keep US stocks from falling significantly here in early 2015, as we could argue the US did for European stocks in 2014.

The big picture still looks like this: a definitive trend change in major asset classes in mid-year 2014. But we need to watch to see if the up-ticking of the last week could potentially spell a break from, or pause in, the downtrend.

4febr2US economic surprises versus valuations looks like this. See how stocks largely ignored a breakdown in economic strength in the first half of 2014. Will they ignore the current trip into the negative? Also note how valuations have risen at their steepest rate since the October 2014 low: the move up in prices has been very much counter-earnings.

Screen Shot 2015-02-04 at 07.57.05Source: Yardeni

Draw it all together and I still have to favour the ‘last gasps of the topping process’ angle. I refer to my 3 key dates of the turn of Jan 2014, the end of June 2014 and the end of Dec 2014 as they three key milestones in this, all anchored to the 2014 smoothed solar maximum.

However, if equities (meaning US equities joining European) and indicators break upwards again, then it would raise the prospect of a final blow-off top, a parabolic termination that could perhaps take us to mid-2015. I base this on the 1929 experience post-1928-solar-max, the failed topping attempt in breadth in 2014 perhaps failing a second time here, and the geomagnetic seasonality of the markets. Something like being here (circles):

4febr11

I just still find that very difficult to make a case for, given how super-stretched sentiment, allocations, valuations and leverage already are. From where is the fuel for another significant leg up?

The next few days are key. Did yesterday’s full moon mark an inversion top from which we now decline, keeping US indices from making new highs, whilst European indices in hindsight will show a blow-off top? Or do we now have a clear 2 week period of typical strength ahead into the new moon making for a comprehensive global breakout in equities? If the latter I would expect gold would be repelled downwards again.

Charts Updates

The big picture looks like this:

28janu13

Source: Stockcharts

Global stocks, commodities and the world’s reserve currency turning in unison at the end of June 2014.

Extreme lop-sided positioning in the US dollar suggests a reversal should be close at hand. I expect gold to be a beneficiary.

28janu6

Source: J Lyons

Tying in with this, economic surprises have crossed fortunes in the US and Europe:

28janu30

Source: Moneymovesmarkets

Therefore, the Euro should be due a bounce versus the Dollar.

US leading indicators remain mired negative.

28janu14

Source: Dshort / ECRI

And so far, Q4 earnings have disappointed, as predicted by a rising dollar and falling oil. Here we can see the key turn down in earnings per share:

Screen Shot 2015-01-28 at 08.00.58Source: Factset

The SP500 looks on borrowed time since the end of June 2014, when we look behind price:

28janu20

The stocks:volatility ratio also turned down at that time, and resembles key changes in 2000 and 2007:
28janu40The sector performance tale in 2015 is the same as 2014: defensives lead as they tend to post-peaks:

28janu1

Source: Macromon

28janu2

 Source: J Lyons

Skew remains persistently high, warning of a potential big move in the markets:

Screen Shot 2015-01-28 at 07.01.56

Source: Barrons

Money continues to pour into government bonds, with Swiss 10 year yields now amazingly paying holders a negative return:

28janu11

Source: SoberLook

28janu9

The bullish development in equities is in Europe where various indices have broken upwards on the QE news, with Germany the leader. There is a 12 month divergence in breadth, which I would tie in to the bigger picture above which would suggest Europe may be experiencing a blow-off top.

28janu25

 Source: Indexindicators

If that is not the case, then we should see risk-on firm up again globally, making repairs to the various asset and indicator downtrends that I present. As things stand though, the balance of evidence is still weighted to the global peak being in the past, and if my three key dates are correct, then US stocks should not exceed their December peaks, with European stocks shortly falling into line. Which way this triangle resolves will tell us the answer:

28janu50

3 Exact Dates

As we wait for the ECB decision and market reaction, I see 3 exact dates being revealed that align with my ‘triple confluence peaks’ idea, i.e. we are seeing major market peaks form at the new moons closest to the geomagnetic seasonal highs (inverted) closest to the smoothed solar maximum.

The smoothed solar max is likely to have been around April 2014.

22janu14

The seasonal peaks (inverted geomagnetism) fall at the turn of the year and mid-year.

22janu1

The new moons closest to these seasonal peaks were 1 January 2014, 27 June 2014 and 22 December 2014, so it follows that we should see major speculation peaks at these dates in the year of the solar maximum, 2014.

Bullish percent to call/put, cyclicals to defensives, high yield to treasuries and small cap equities to bonds all peaked very close to the 1 January 2014 date.

22janu2Stocks:dollar, stocks:bonds, FTSE Eurostox and NYSE composite indices, NSYE breadth, volatility and junk:treasury bonds, oil, US dollar (inverted), leveraged loans and junk bonds all peaked very close to the 27 June 2014 date.

22janu7 22janu5

22janu3

The final date, 22 December, has tentatively topped out the remaining key indices and speculation measures, namely SP500, Dow and Wilshire 5000 (plus an associated bottom in gold) and a blow-off top in sentiment and allocations.

22janu4 22janu6If this ‘dumb’ model of the markets is correct then we should make no new highs from here but rather collapse to a March/April initial bear market bottom (first leg down).

If an anomaly is at hand and the solar max is still ahead or speculation somehow extends further in time, then the next logical peak would be mid-year 2015, likely June 16. However, I rate this possibility as negligible. Look again at the risk measures that changed course Jan 1 2014: they remain in downtrends ever since. Add to these the large range of assets and indicators that peaked June 27 and remain in downtrends ever since too. Then consider the change in market and cross-asset behaviour since the final date, Dec 22, together with that capitulation in sentiment and allocations. This has to be game over, in my opinion. However, if we consider it a game in which central banks can cheat and change the rules, then maybe, just maybe, natural forces can less freely flow through the markets. I don’t think this is likely as central bank members are solar subjects too. However, this is subject to confirmation in a critical real time test in 2014-2015. Market reaction over the next few days to the ECB announcement will be a key tell.


Saturday Markets Update

Stocks ended the week on some buying. We are approaching this coming Tuesday’s new moon and Thursday’s ECB meeting, at which we should expect some kind of QE or new programme of action, given the Swiss central bank’s pre-emptive action this week. Therefore, I expect a little more strength in the first half of this coming week and then a sell-the-news resumption of the equities downtrend, which ought to be the definitive breakdown in stocks, as we head into the geomagnetic low of March/April.

The Dax made a new high on Friday, but this has to be seen in the context of a fast-weakening Euro, and the majority of other global stock indices still dictate the overall peak around mid-year 2014. Shown below are other European indices in comparison to the Dax plus US stocks, together with breadth, volatility and junk:treasury bonds.

17janu1 17janu2

 Source: Stockcharts

Here we see the deflation problem Europe has to address with policy response.

17janu5Source: FT

US earnings season is underway for Q4 2014 and is currently reporting a blended earnings growth rate of 0.6% and a blended revenue growth rate of 0.8%. This the weakest in some time, and earnings forecasts for 2015 are also weak, due to the combined impact of rising dollar and tumbling oil. Meanwhile, economic surprises for the US are dropping towards the zero level and leading indicators for the US continue to flag red:

17janu3Source: DShort

Therefore, supports for the bull continuation have been significantly weakened.

Here is combined smart and dumb money for US stocks: a rare lop-sided agreement that has been a marker of previous major peaks:

17janu11Source: Sentimentrader

Similar topping flags have been raised throughout 2014 but at this point we see a more united degradation in leading indicators, negative divergences, earnings, and cross-asset action. Below we see how December to January has produced intensifying developments in government bonds and currencies.

17janu6 17janu8 17janu9

Industrial commodities have also seen acceleration to the downside in that period, whilst gold has taken off. All these developments make it unlikely stocks can continue their levitation, and this divergence in growth-dependent commodities versus safe haven commodities ought to continue. But what about agri/soft commodities? Largely unloved, but climate could give them a boost. 2014 ended up as the hottest year on record:

Screen Shot 2015-01-17 at 06.38.41

Source: NOAA

Perhaps when the US dollar finally turns, agri may attract buying interest. Positioning in the US dollar remains extreme, whilst the Euro is showing signs of capitulation. Again, I would the see ECB meeting this coming week to be the sell-the-news event.

In summary, developments are now much more supportive of stocks breaking down and gold breaking up. Post-solar-max, degradation in leading indicators and earnings, sharp moves in commodities and currencies, and a lot of data pointing to a mid-year 2014 ‘real’ peak. Back in 2008, stocks and leading indicators were tumbling whilst commodities levitated, but commodities could not levitate for long under those circumstances. I see the same here in reverse, with the cross-asset and cross-indicator breakdowns the prelude for the collapse in equities.

I previously looked at the ‘second chance’ peaks of the similar examples from history, e.g. Nasdaq 2000, Nikkei 1989, Dow 1937. They all showed a main peak followed by a lower high (failed) peak, which was then the trigger for waterfall selling. Looking at stock indices charts for 2014-15, we don’t see obvious such second chance peaks. The most parabolic of the indices was the Nasdaq 100, but this has produced more of an up-and-down range over the last couple of months, than a clear second-but-failed attempt at the high. So, we need to see price develop further to assess, but the picture may be one of a topping price range instead. It does not alter the likely subsequent collapse, which is already written in highly lopsided sentiment and allocations, extreme leverage and the post-solar-maximum rug-pulling.

17janu15


Solar Models

Solar maxima generate speculation peaks. The latest smoothed solar maximum is likely to have been April 2014. The chief speculation target has been equities, particularly US equities. That mania is demonstrated in valuations, sentiment, allocations, leverage and more. A speculative mania has indeed been delivered at a sunspot maximum again.

The chart looks like this:

13janu3

If we substitute the Dax for the SP500, the aligned peaking looks clearer:

13janu4

But where is the subsequent collapse? It really has to occur within the window January to April 2015 to be both within acceptable range and normal seasonality, with the latter guided by the sun’s second tool, geomagnetism:

30dec12

As things stand, the set-up is as compelling as it could be for this to occur. Global growth proxies, oil and copper, are collapsing. Bond yields are reaching for record lows and yield curves flattening. Volatility is in an uptrend. The US dollar has surged in a deflation wave. Earnings forecasts have been slashed on the moves in oil and the dollar. Plus, the key ingredients for a collapse remain in place, namely excess leverage, very lopsided sentiment and allocations, and a wide range of negative divergences.

Additionally, the real (actual) geomagnetic trend has intensified since August 2014. Here is the commodities index versus trend geomagnetism for the last 6 years. Note the geomagnetism is inverted as higher geomagnetism is negative for sentiment. We see geomagnetism has helped drag down commodities over the last several months.

13janu7

However, when we look at equities, we see them levitating away from the model in an 18 month mania:

13janu6

Combining equities with commodities we see the mania from another angle:

13janu2

The similarities with 2000 are notable. Back in 1998-2000, we saw a similar pulling away from the geomagnetic model. Eventually stocks were dragged back to it, in a post-mania bear:

13janu9

Note how the geomagnetic trend intensified downwards in the second half of 2000. This would have played a role in popping the uptrend in equities, as it tugged downwards on sentiment, and ought to play the same role now given the steepening over the last several months.

I maintain the parallels with 1937. Ultra low rates and QE, deflationary pressures, excessive valuation into the next solar maximum following the demographic peak. We should be heading for a major low in equities several years from now at the next solar minimum. Top chart from S. Tarassov.

12janu5